

Metabolomic Profiling of the Effects of Melittin on Cisplatin Resistant and Cisplatin Sensitive Ovarian Cancer Cells Using Mass Spectrometry and Biolog Microarray Technology
- PMID: 27754384
- PMCID: PMC5192441
- DOI: 10.3390/metabo6040035
Metabolomic Profiling of the Effects of Melittin on Cisplatin Resistant and Cisplatin Sensitive Ovarian Cancer Cells Using Mass Spectrometry and Biolog Microarray Technology
Abstract
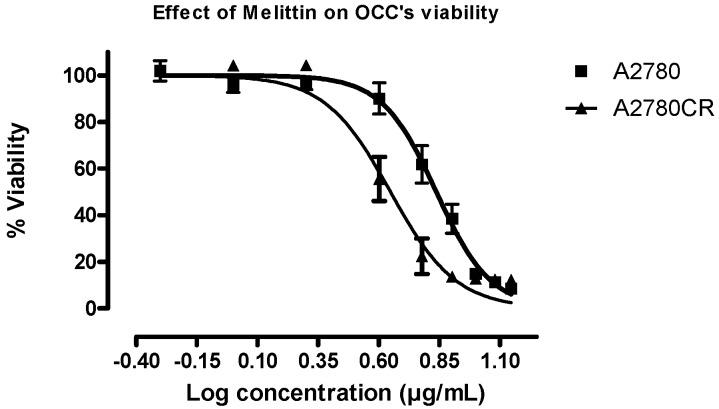
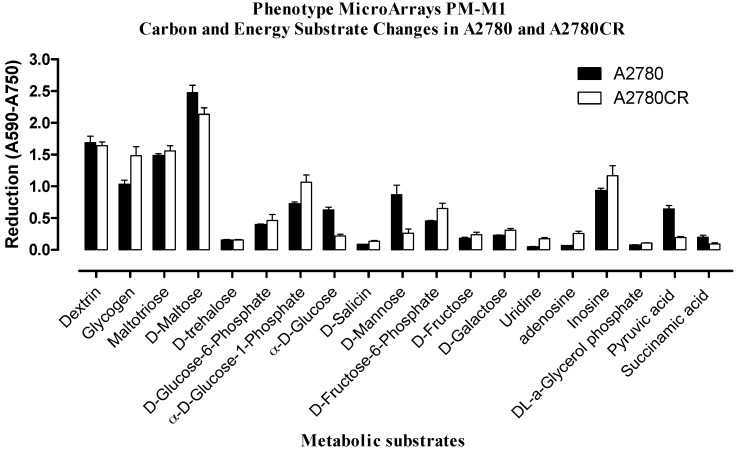
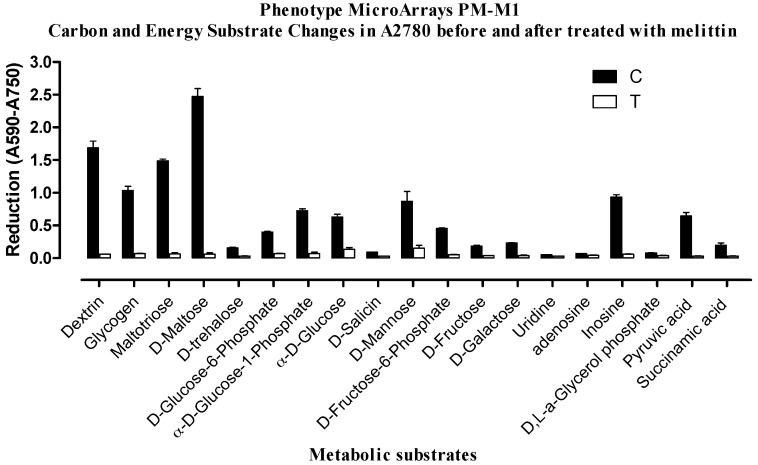
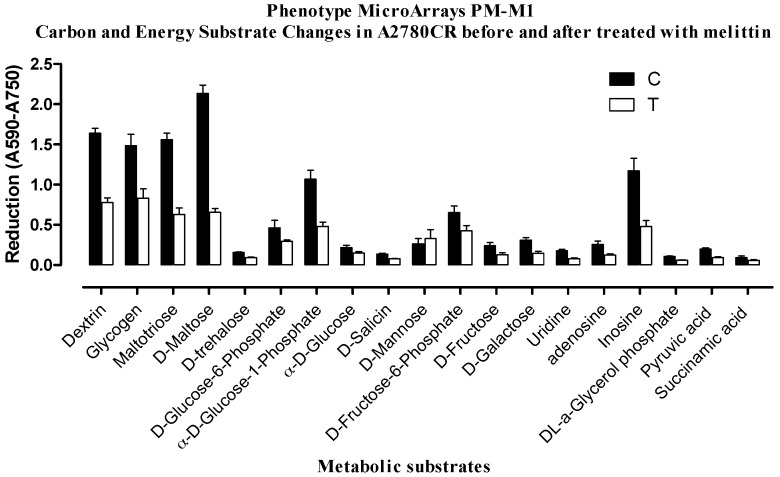
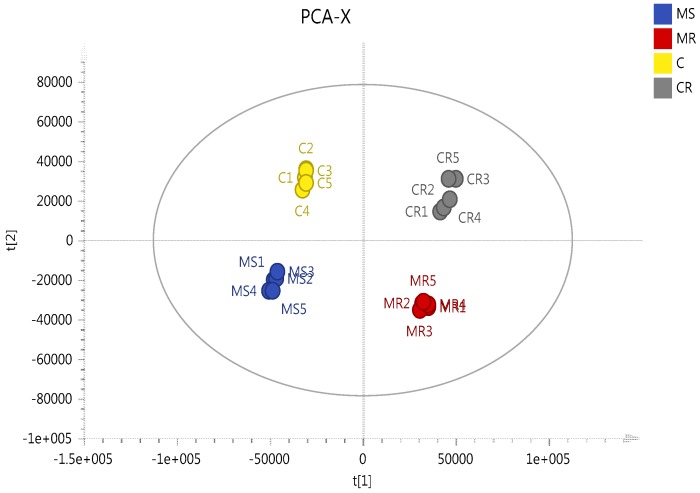
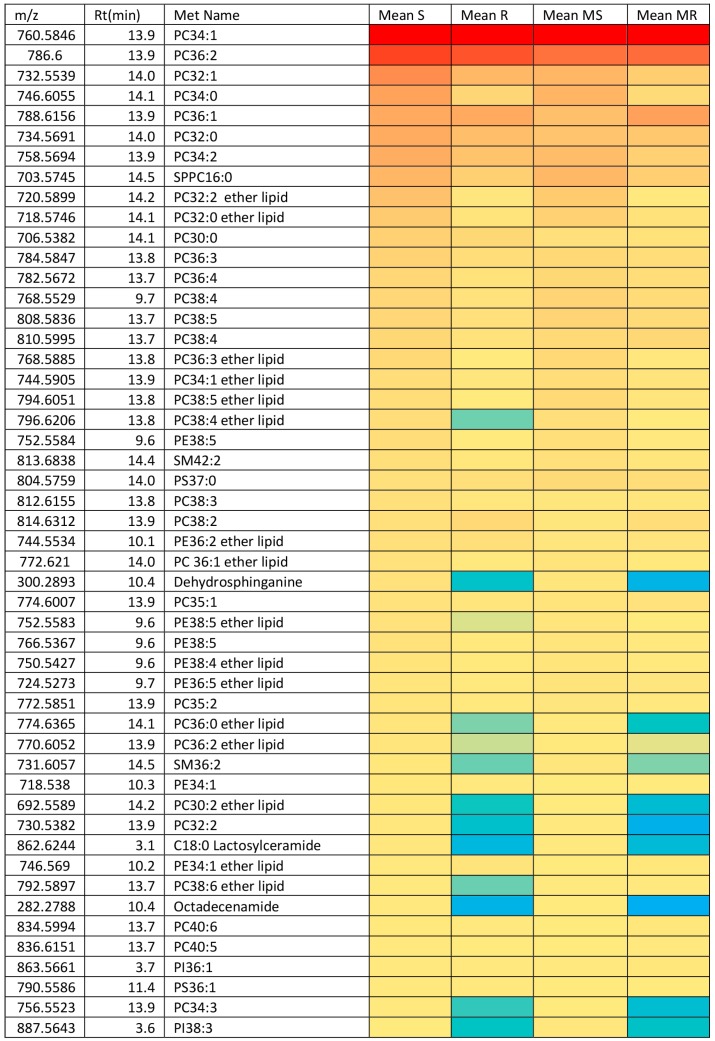
In the present study, liquid chromatography-mass spectrometry (LC-MS) was employed to characterise the metabolic profiles of two human ovarian cancer cell lines A2780 (cisplatin-sensitive) and A2780CR (cisplatin-resistant) in response to their exposure to melittin, a cytotoxic peptide from bee venom. In addition, the metabolomics data were supported by application of Biolog microarray technology to examine the utilisation of carbon sources by the two cell lines. Data extraction with MZmine 2.14 and database searching were applied to provide metabolite lists. Principal component analysis (PCA) gave clear separation between the cisplatin-sensitive and resistant strains and their respective controls. The cisplatin-resistant cells were slightly more sensitive to melittin than the sensitive cells with IC50 values of 4.5 and 6.8 μg/mL respectively, although the latter cell line exhibited the greatest metabolic perturbation upon treatment. The changes induced by melittin in the cisplatin-sensitive cells led mostly to reduced levels of amino acids in the proline/glutamine/arginine pathway, as well as to decreased levels of carnitines, polyamines, adenosine triphosphate (ATP) and nicotinamide adenine dinucleotide (NAD+). The effects on energy metabolism were supported by the data from the Biolog assays. The lipid compositions of the two cell lines were quite different with the A2780 cells having higher levels of several ether lipids than the A2780CR cells. Melittin also had some effect on the lipid composition of the cells. Overall, this study suggests that melittin might have some potential as an adjuvant therapy in cancer treatment.
Keywords: A2780 cells; LC-MS; Melittin; cisplatin resistance; metabolomics; ovarian cancer.
Conflict of interest statement
The authors declare no conflict of interest.
Figures
Similar articles
-
Effect of Melittin on Metabolomic Profile and Cytokine Production in PMA-Differentiated THP-1 Cells.Vaccines (Basel). 2018 Oct 13;6(4):72. doi: 10.3390/vaccines6040072. Vaccines (Basel). 2018. PMID: 30322119 Free PMC article.
-
Metabolomic Profiling of the Synergistic Effects of Melittin in Combination with Cisplatin on Ovarian Cancer Cells.Metabolites. 2017 Apr 14;7(2):14. doi: 10.3390/metabo7020014. Metabolites. 2017. PMID: 28420117 Free PMC article.
-
[Discrimination and clinical value of plasma metabolomic profiles in multidrug resistant epithelial ovarian cancer].Zhonghua Zhong Liu Za Zhi. 2017 Dec 23;39(12):896-902. doi: 10.3760/cma.j.issn.0253-3766.2017.12.004. Zhonghua Zhong Liu Za Zhi. 2017. PMID: 29262505 Chinese.
-
Mass spectrometric discrimination of phospholipid patterns in cisplatin-resistant and -sensitive cancer cells.Rapid Commun Mass Spectrom. 2019 Jan 15;33(1):97-106. doi: 10.1002/rcm.8320. Rapid Commun Mass Spectrom. 2019. PMID: 30376198
-
Cisplatin-induced apoptosis proceeds by caspase-3-dependent and -independent pathways in cisplatin-resistant and -sensitive human ovarian cancer cell lines.Cancer Res. 1999 Jul 1;59(13):3077-83. Cancer Res. 1999. PMID: 10397248
Cited by
-
Untargeted LC-MS/MS analysis reveals metabolomics feature of osteosarcoma stem cell response to methotrexate.Cancer Cell Int. 2020 Jun 24;20:269. doi: 10.1186/s12935-020-01356-y. eCollection 2020. Cancer Cell Int. 2020. PMID: 32587477 Free PMC article.
-
Melittin, a major peptide component of bee venom, and its conjugates in cancer therapy.Cancer Lett. 2017 Aug 28;402:16-31. doi: 10.1016/j.canlet.2017.05.010. Epub 2017 May 20. Cancer Lett. 2017. PMID: 28536009 Free PMC article. Review.
-
Harnessing the power of bee venom for therapeutic and regenerative medical applications: an updated review.Front Pharmacol. 2024 Jul 18;15:1412245. doi: 10.3389/fphar.2024.1412245. eCollection 2024. Front Pharmacol. 2024. PMID: 39092234 Free PMC article. Review.
-
Effect of Melittin on Metabolomic Profile and Cytokine Production in PMA-Differentiated THP-1 Cells.Vaccines (Basel). 2018 Oct 13;6(4):72. doi: 10.3390/vaccines6040072. Vaccines (Basel). 2018. PMID: 30322119 Free PMC article.
-
Metabolomic Profiling of the Synergistic Effects of Melittin in Combination with Cisplatin on Ovarian Cancer Cells.Metabolites. 2017 Apr 14;7(2):14. doi: 10.3390/metabo7020014. Metabolites. 2017. PMID: 28420117 Free PMC article.
References
LinkOut - more resources
Full Text Sources
Other Literature Sources
