. 2016 Oct 14;8(10):285.
doi: 10.3390/v8100285.

Single Amino Acid Substitution N659D in HIV-2 Envelope Glycoprotein (Env) Impairs Viral Release and Hampers BST-2 Antagonism

Affiliations

Single Amino Acid Substitution N659D in HIV-2 Envelope Glycoprotein (Env) Impairs Viral Release and Hampers BST-2 Antagonism

François E Dufrasne et al. Viruses. .

Abstract

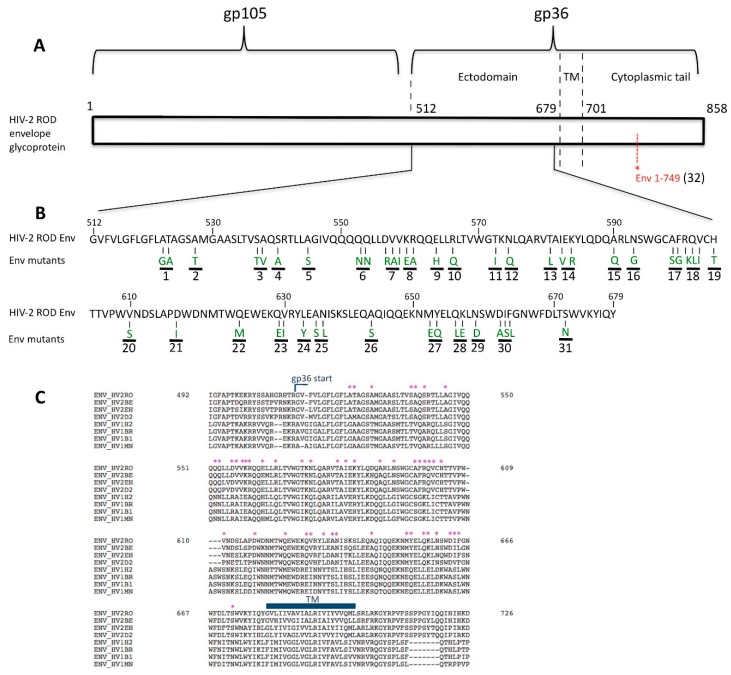
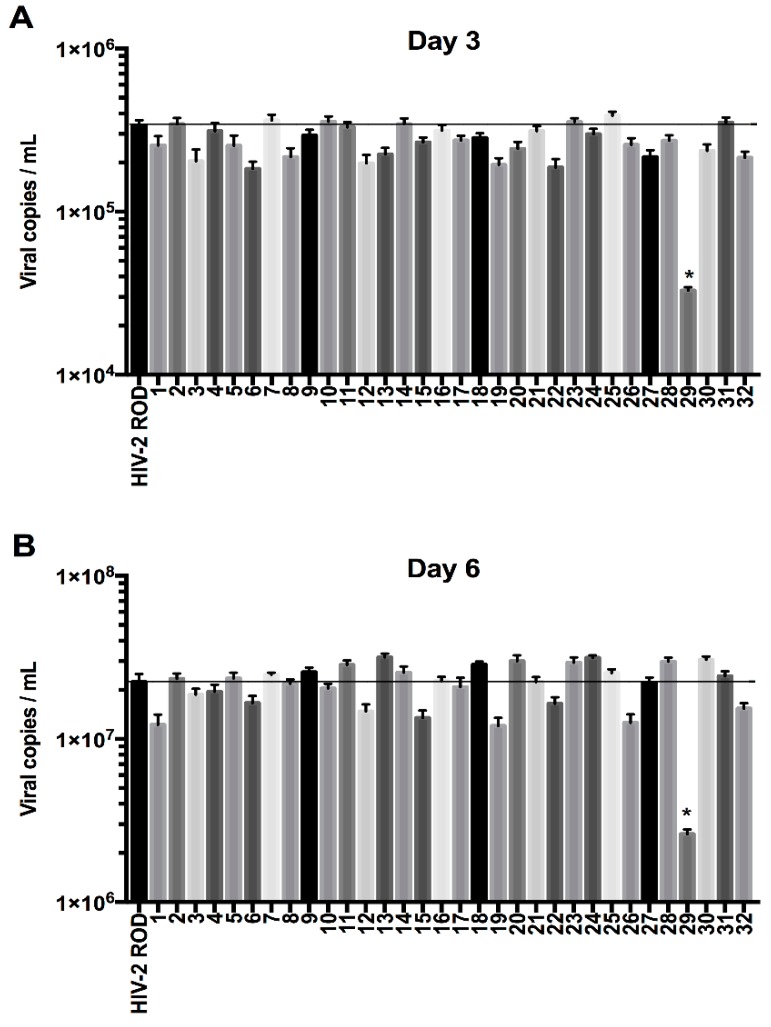
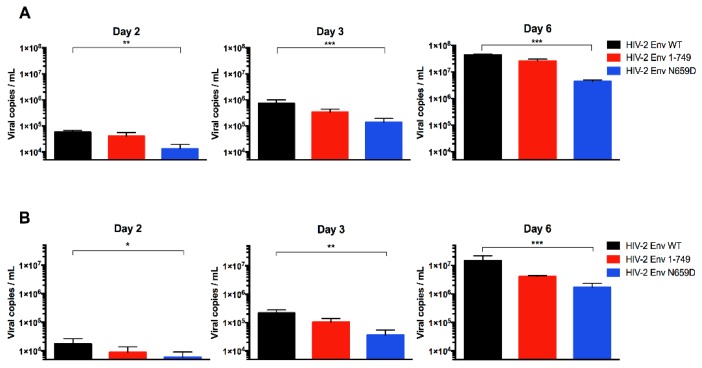
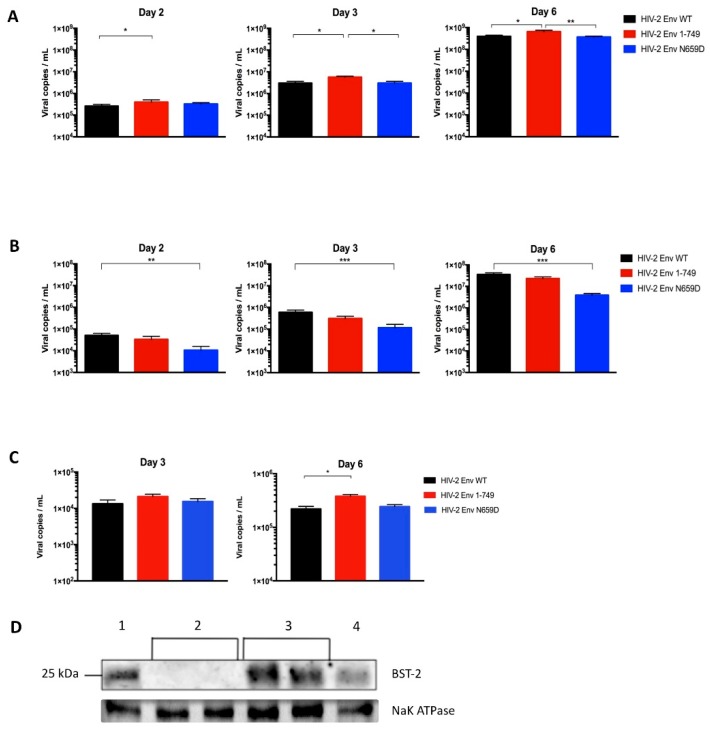
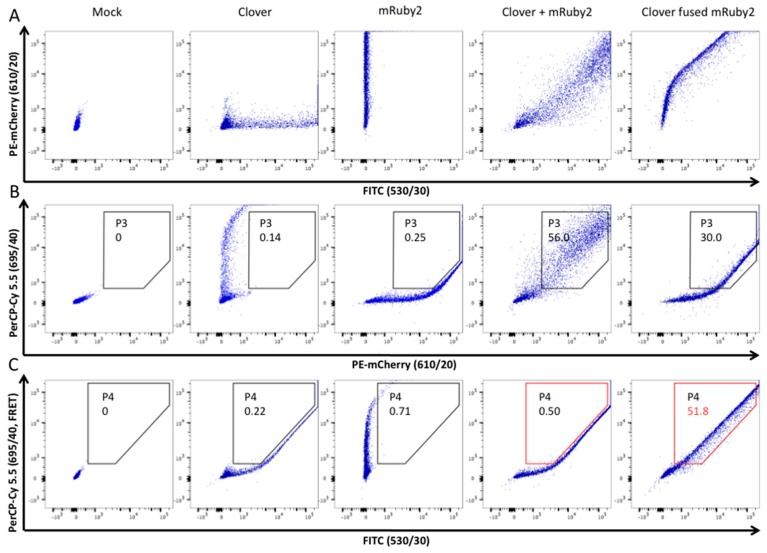
BST-2 or tetherin is a host cell restriction factor that prevents the budding of enveloped viruses at the cell surface, thus impairing the viral spread. Several countermeasures to evade this antiviral factor have been positively selected in retroviruses: the human immunodeficiency virus type 2 (HIV-2) relies on the envelope glycoprotein (Env) to overcome BST-2 restriction. The Env gp36 ectodomain seems involved in this anti-tetherin activity, however residues and regions interacting with BST-2 are not clearly defined. Among 32 HIV-2 ROD Env mutants tested, we demonstrated that the asparagine residue at position 659 located in the gp36 ectodomain is mandatory to exert the anti-tetherin function. Viral release assays in cell lines expressing BST-2 showed a loss of viral release ability for the HIV-2 N659D mutant virus compared to the HIV-2 wild type virus. In bst-2 inactivated H9 cells, those differences were lost. Subtilisin treatment of infected cells demonstrated that the N659D mutant was more tethered at the cell surface. Förster resonance energy transfer (FRET) experiments confirmed a direct molecular link between Env and BST-2 and highlighted an inability of the mutant to bind BST-2. We also tested a virus presenting a truncation of 109 amino acids at the C-terminal part of Env, a cytoplasmic tail partial deletion that is spontaneously selected in vitro. Interestingly, viral release assays and FRET experiments indicated that a full Env cytoplasmic tail was essential in BST-2 antagonism. In HIV-2 infected cells, an efficient Env-mediated antagonism of BST-2 is operated through an intermolecular link involving the asparagine 659 residue as well as the C-terminal part of the cytoplasmic tail.

Keywords: BST-2; CRISPR/Cas9 knockout; Env; FRET; HIV-2; envelope glycoprotein; gp36; restriction factors; tetherin; viral antagonist.


Conflict of interest statement

The authors declare no conflict of interest.

Figures

Figure 1
Figure 1
Schematic representation of human immunodeficiency virus type 2 (HIV-2) ROD envelope glycoprotein (Env). (A) The functional HIV-2 ROD Env protein is composed of an external domain (gp105) and a transmembrane domain (gp36). Three regions comprise gp36: the ectodomain, the membrane spanning domain and the cytoplasmic tail (158 amino acids). To generate a mutant virus with a truncated cytoplasmic tail (Env 1–749), the tryptophan residue (TGG) at the env position 749 was replaced with a stop codon (TAA) using site-directed mutagenesis. This position is indicated in red in this figure (TM: transmembrane domain); (B) Amino acids 512 to 679 composing the HIV-2 ROD gp36 ectodomain are shown in this panel. Based on a comparison of the HIV-1 and HIV-2 gp41/36 amino acid sequences, 47 positions were selected (Env mutants). All the selected amino acids mutations are highlighted in green, each corresponding to the related HIV-1 Env residues used to generate substitutions by side-directed mutagenesis of the pKP59 HIV-2 ROD plasmid. The 32 HIV-2 Env mutants generated in this study are numbered and highlighted with the black lines in this figure; (C) Alignment and comparison of the HIV-1 and HIV-2 gp41/36 amino acid sequences. Selected amino acids are pointed with the symbol * (Env_HV2RO: HIV-2 ROD strain; Env_HV2BE: HIV-2 BEN strain; Env_HV2EH: HIV-2 EHO strain; Env_HV2D2: HIV-2 D205 strain; Env_HV1H2: HIV-1 HXB2 strain; Env_HV1BR: HIV-1 BRU/LAI strain; Env_HV1B1: HIV-1 BH10 strain and Env_HV1MN: HIV-1 MN strain).
Figure 2
Figure 2
Absolute quantification of viral release ability among thirty-two HIV-2 Env mutants. The different clones were generated by site-directed mutagenesis and transfected in HEK293T cells. The viral particles were then used to infect H9 cells, a BST-2 producing cell line. Quantification was performed at three (A) and six (B) days post-infection (n = 3 independent experiments). The mutant numbers 1 to 32 are the same as highlighted substitutions in Figure 1B. The HIV-2 Env N659D mutant (mutant 29) showed a lower viral release compared to the HIV-2 Env WT. Error bars indicate mean ± standard deviation (SD) and statistical tests give statistical significance with a p < 0.05 (*).
Figure 3
Figure 3
Absolute quantification of the HIV-2 Env wild-type (WT), Env 1–749 and Env N659D viral release capacity. (A) Quantification of the number of viral particles released from infected H9 cells in the supernatant at two, three and six days post-infection; (B) Quantification of the number of viral particles released from infected Jurkat cells in the supernatant at two, three and six days post-infection. Graphs present the number of viral copies in a logarithmic scale. Error bars indicate mean ± SD for n = 6 independent experiments. Statistical tests give statistical significance for HIV-2 Env WT and HIV-2 Env N659D with a p < 0.05 (*), p < 0.01 (**) or p < 0.001 (***).
Figure 4
Figure 4
At three days post-infection, infected H9 cells were conserved and then treated with the bacterial protease subtilisin that released the tethered virions. Graph shows relative quantification of viral particles tethered at the cell surface. Data for the HIV-2 Env WT has been normalized to 1 (dashed line in the graph). Data for the others viruses has been compared to this normalized value and has been expressed as folds increase. Error bars indicate mean ± SD for n = 4 independent experiments. Statistical tests (one-way ANOVA followed by Tukey’s multiple comparisons test) give statistical significance with a p < 0.001 (***) both for Env WT and Env N659D viruses, and for Env 1–749 and Env N659D viruses. There is no statistical significance in titer between the Env WT and Env 1–749 viruses. Two negative controls were also tested: a medium from uninfected H9 cells treated with subtilisin, and a medium from infected H9 cells untreated with subtilisin.
Figure 5
Figure 5
(A) Absolute quantification of the HIV-2 Env WT, Env 1–749 and Env N659D viral release capacity from BST-2-depleted H9 cells at two, three and six days post-infection; (B) Absolute quantification of viral particles released from H9 cells transduced with pseudotyped viruses that encoded Cas9 protein and a single guide RNA (sgRNA) sequence recognizing an intron sequence. The replicative capacity of the three viruses remained equivalent to the viral release assay using H9 cells that expressed BST-2 (Figure 3A); (C) Absolute quantification of viral release capacity from transfected HEK293T cells, which do not express BST-2, at three and six days post-transfection; (D) BST-2 expression in those cells was verified by immunoblotting proteins from H9 cells lysates (1), two different populations of BST-2-depleted H9 cells (2), two different populations of H9 cells transduced with pseudotyped viruses that encoded a sgRNA sequence recognizing an intron sequence (3) and Jurkat cells (4). Graphs present the number of viral copies in a logarithmic scale. Error bars indicate mean ± SD for n = 4 independent experiments (except for the panel C, n = 3). Statistical tests give statistical significance with a p < 0.05 (*), p < 0.01 (**) or p < 0.001 (***).
Figure 6
Figure 6
BD FACSAria™ III cell sorter configuration and experimental setup of Förster resonance energy transfer (FRET)-measurements. Firstly, gate P1 selecting living cells (according to forward and sideward scatter FSC-A/SSC-A) and gate P2 selecting cells in P1 (according to forward and sideward scatter FSC-W/SSC-W in order to exclude joined or grouped cells), have been applied (not shown in this figure). Secondly, HEK293T cells expressing Clover or mRuby2 individually, in combination or as a fusion protein, were analyzed with three different filters in order to construct analysis gates and to define the FRET-positive signal. Clover (green fluorescent protein variant) was excited with the laser 488 nm and the FITC filter was used to examine fluorescence emission. mRuby2 (red fluorescent protein variant) was excited with the laser 561 nm and the PE-mCherry filter was used (panel A). Importantly, mRuby2 and Clover showed some emission in the FRET-channel (PerCP-Cy 5.5 filter). Thus, a gate (P3) was constructed to exclude cells that emitted a false-positive signal in the FRET-channel (panel B). As described in this image, cells co-transfected with Clover and mRuby2 exerted an aleatory FRET signal that should also be excluded. Therefore, an analysis gate (P4, in red) was applied to determine the FRET-positive cells when the FRET-adapted filters were selected (PerCP-Cy 5.5 and FITC filters, panel C). This P4 gate excluded cells that were co-transfected with Clover and mRuby2 and thus are FRET-negative (0.5% of P2), while including cells that showed a FRET-positive signal (Clover fused mRuby2; 51.8% of P2). This gating strategy allowed for assessment the enhanced emission of the acceptor fluorochrome and therefore demonstrated the energy transfer between the two fluorochromes; namely the protein interactions.
Figure 7
Figure 7
HEK293T cells co-expressing the fusion proteins in the following combinations were analyzed with the configured BD FACSAria™ III cell sorter. (A) BST-2 fused Clover and HIV-2 Env WT fused to mRuby2; (B) BST-2 fused Clover and HIV-2 Env 1–749 fused mRuby2; (C) BST-2 fused Clover and HIV-2 Env N659D fused mRuby2 and (D) BST-2 fused Clover and HIV-2 Nef fused mRuby2. Numbers indicated in gate P4 give the percentage of FRET-positive cells included in P2 according to the previous fluorescence-activated cell sorting (FACS) configuration for the different co-expression in living cells (Figure 6); (E) Bar diagram summarizing the FRET-positive signals from four independent experiments (n = 4). Statistical tests give a significance with a p < 0.05 (*), p < 0.01 (**) or p < 0.001 (***).

Similar articles

Cited by

References

    1. Clavel F., Guétard D., Brun-Vézinet F., Chamaret S., Rey M.A., Santos-Ferreira M.O., Laurent G., Dauguet C., Katlama C., Rouzioux C., et al. Isolation of a new human retrovirus from West African patients with AIDS. Science. 1986;233:343–346. doi: 10.1126/science.2425430. - DOI - PubMed
    1. Sharp P.M., Hahn B.H. Origins of HIV and the AIDS pandemic. Cold Spring Harb. Perspect. Med. 2011;1:a006841. doi: 10.1101/cshperspect.a006841. - DOI - PMC - PubMed
    1. Lemey P., Pybus O.G., Wang B., Saksena N.K., Salemi M., Vandamme A.M. Tracing the origin and history of the HIV-2 epidemic. Proc. Natl. Acad. Sci. USA. 2003;100:6588–6592. doi: 10.1073/pnas.0936469100. - DOI - PMC - PubMed
    1. De Silva T.I., Cotten M., Rowland-Jones S.L. HIV-2: The forgotten AIDS virus. Trends Microbiol. 2008;16:588–595. doi: 10.1016/j.tim.2008.09.003. - DOI - PubMed
    1. Peeters M., D’Arc M., Delaporte E. The origin and diversity of human retroviruses. AIDS Rev. 2014;16:23–34. - PMC - PubMed

MeSH terms

LinkOut - more resources