

Diatom growth responses to photoperiod and light are predictable from diel reductant generation
- PMID: 27754547
- PMCID: PMC5363399
- DOI: 10.1111/jpy.12483
Diatom growth responses to photoperiod and light are predictable from diel reductant generation
Abstract
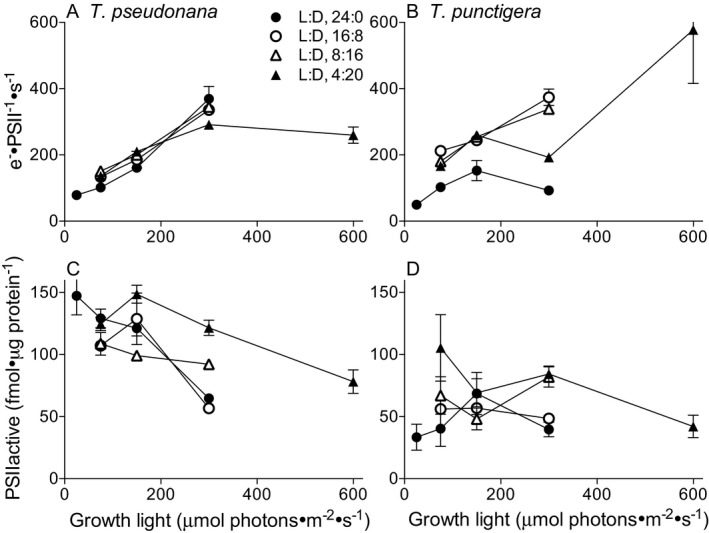
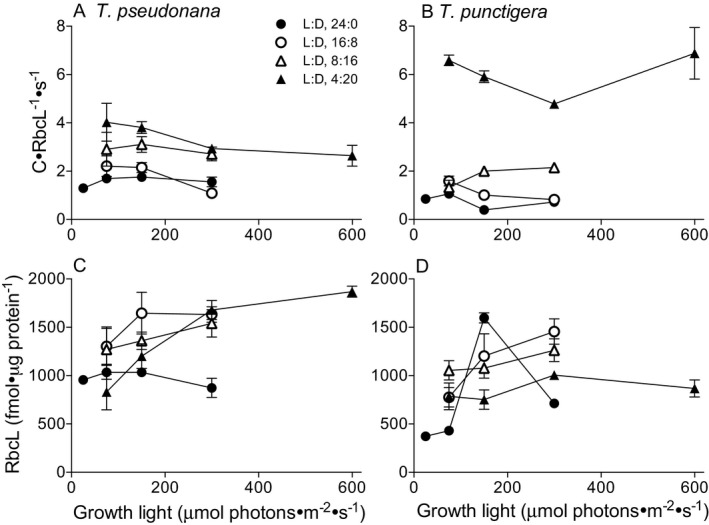
Light drives phytoplankton productivity, so phytoplankton must exploit variable intensities and durations of light exposure, depending upon season, latitude, and depth. We analyzed the growth, photophysiology and composition of small, Thalassiosira pseudonana, and large, Thalassiosira punctigera, centric diatoms from temperate, coastal marine habitats, responding to a matrix of photoperiods and growth light intensities. T. pseudonana showed fastest growth rates under long photoperiods and low to moderate light intensities, while the larger T. punctigera showed fastest growth rates under short photoperiods and higher light intensities. Photosystem II function and content responded primarily to instantaneous growth light intensities during the photoperiod, while diel carbon fixation and RUBISCO content responded more to photoperiod duration than to instantaneous light intensity. Changing photoperiods caused species-specific changes in the responses of photochemical yield (e- /photon) to growth light intensity. These photophysiological variables showed complex responses to photoperiod and to growth light intensity. Growth rate also showed complex responses to photoperiod and growth light intensity. But these complex responses resolved into a close relation between growth rate and the cumulative daily generation of reductant, across the matrix of photoperiods and light intensities.
Keywords: RUBISCO; Thalassiosira; cell size; diatom; electron transport; growth; photoperiod; photosystem II.
© 2016 The Authors. Journal of Phycology published by Wiley Periodicals, Inc. on behalf of Phycological Society of America.
Figures


Similar articles
-
High antioxidant capability interacts with respiration to mediate two Alexandrium species growth exploitation of photoperiods and light intensities.Harmful Algae. 2019 Feb;82:26-34. doi: 10.1016/j.hal.2018.12.008. Epub 2019 Jan 4. Harmful Algae. 2019. PMID: 30928008
-
Interactive effects of nitrogen and light on growth rates and RUBISCO content of small and large centric diatoms.Photosynth Res. 2017 Jan;131(1):93-103. doi: 10.1007/s11120-016-0301-7. Epub 2016 Aug 26. Photosynth Res. 2017. PMID: 27566625 Free PMC article.
-
Cell size trade-offs govern light exploitation strategies in marine phytoplankton.Environ Microbiol. 2010 Jan;12(1):95-104. doi: 10.1111/j.1462-2920.2009.02046.x. Epub 2009 Sep 4. Environ Microbiol. 2010. PMID: 19735282
-
Physiological responses of the diatoms Thalassiosira weissflogii and Thalassiosira pseudonana to nitrogen starvation and high light.Mar Environ Res. 2021 Apr;166:105276. doi: 10.1016/j.marenvres.2021.105276. Epub 2021 Feb 5. Mar Environ Res. 2021. PMID: 33578138
-
Changes in the Rubisco to photosystem ratio dominates photoacclimation across phytoplankton taxa.Photosynth Res. 2015 Jun;124(3):275-91. doi: 10.1007/s11120-015-0137-6. Epub 2015 Apr 11. Photosynth Res. 2015. PMID: 25862645
Cited by
-
Opposite Growth Responses of Alexandrium minutum and Alexandrium catenella to Photoperiods and Temperatures.Plants (Basel). 2021 May 25;10(6):1056. doi: 10.3390/plants10061056. Plants (Basel). 2021. PMID: 34070469 Free PMC article.
-
Photosynthetic Characteristics of Smaller and Larger Cell Size-Fractioned Phytoplankton Assemblies in the Daya Bay, Northern South China Sea.Microorganisms. 2021 Dec 23;10(1):16. doi: 10.3390/microorganisms10010016. Microorganisms. 2021. PMID: 35056465 Free PMC article.
-
Phytoplankton communities in temporary ponds under different climate scenarios.Sci Rep. 2021 Sep 9;11(1):17969. doi: 10.1038/s41598-021-97516-9. Sci Rep. 2021. PMID: 34504259 Free PMC article.
-
Coupling Effects of Environmental Factors on the Phytoplankton Community Structure in Ebinur Lake, a Saltwater Lake in China.Ecol Evol. 2025 Jun 14;15(6):e71516. doi: 10.1002/ece3.71516. eCollection 2025 Jun. Ecol Evol. 2025. PMID: 40519891 Free PMC article.
-
Responses of Different Temperature-Acclimated Diatom Species, Smaller Thalassiosira pseudonana and Larger Thalassiosira rotula, to Increased Ambient Temperature.Microorganisms. 2025 Jul 12;13(7):1652. doi: 10.3390/microorganisms13071652. Microorganisms. 2025. PMID: 40732161 Free PMC article.
References
-
- Anning, T. , MacIntyre, H. L. , Pratt, S. M. , Sammes, P. J. , Gibb, S. & Geider, R. J. 2000. Photoacclimation in the marine diatom Skeletonema costatum . Limnol. Oceanogr. 45:1807–17.
-
- Bailleul, B. , Berne, N. , Murik, O. , Petroutsos, D. , Prihoda, J. , Tanaka, A. , Villanova, V. et al. 2015. Energetic coupling between plastids and mitochondria drives CO2 assimilation in diatoms. Nature 524:366–9. - PubMed
-
- Beardall, J. , Allen, D. , Bragg, J. , Finkel, Z. V. , Flynn, K. J. , Quigg, A. , Alwyn, T. et al. 2009. Allometry and stoichiometry of unicellular, colonial and multicellular phytoplankton. New Phytol. 181:295–309. - PubMed
-
- Berlett, B. S. & Stadtman, E. R. 1997. Protein oxidation in aging, disease, and oxidative stress. J. Biol. Chem. 272:20313–6. - PubMed
-
- Brand, L. E. & Guillard, R. R. L. 1981. The effects of continuous light and light intensity on the reproduction rates of twenty‐two species of marine phytoplankton. J. Exp. Mar. Biol. Ecol. 50:119–32.
Publication types
MeSH terms
Substances
LinkOut - more resources
Full Text Sources
Other Literature Sources
