. 2017 May;17(5):1242-1254.
doi: 10.1111/ajt.14087. Epub 2016 Nov 21.

Age-Dependent Metabolic and Immunosuppressive Effects of Tacrolimus

Affiliations

Age-Dependent Metabolic and Immunosuppressive Effects of Tacrolimus

F Krenzien et al. Am J Transplant. 2017 May.

Abstract

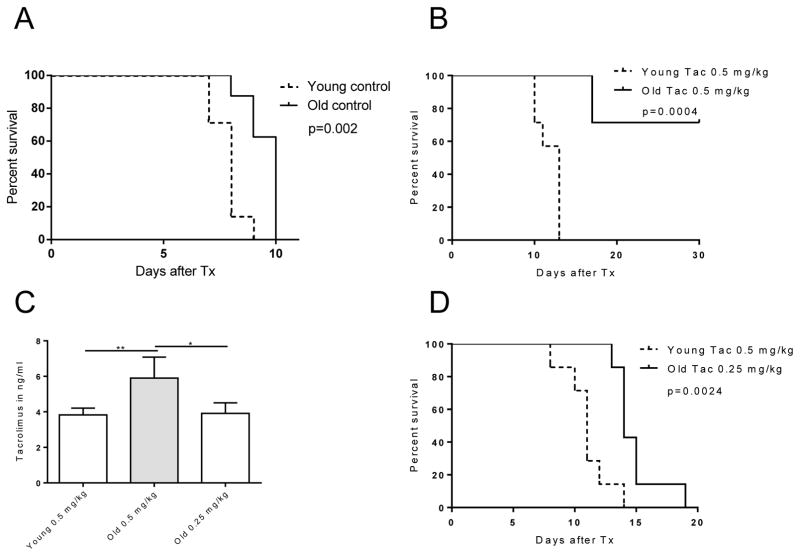
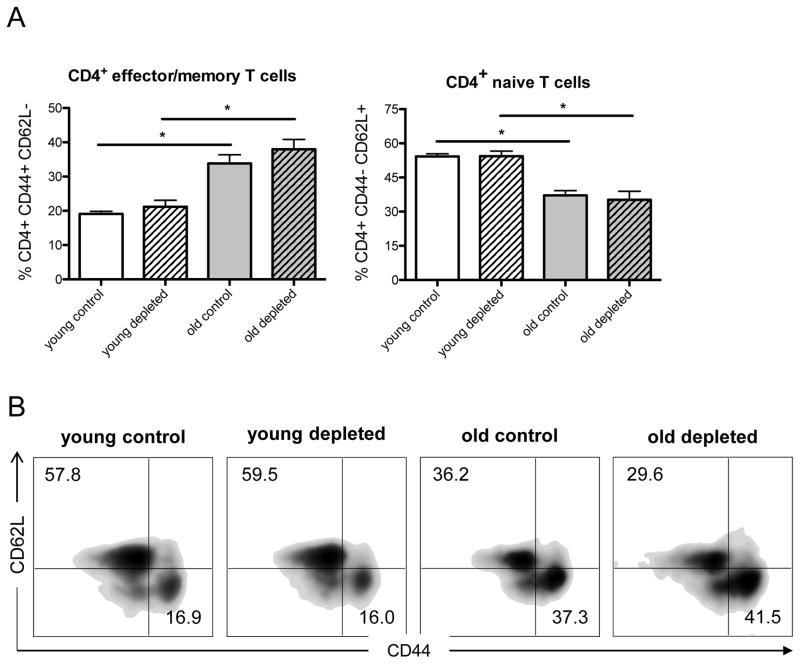
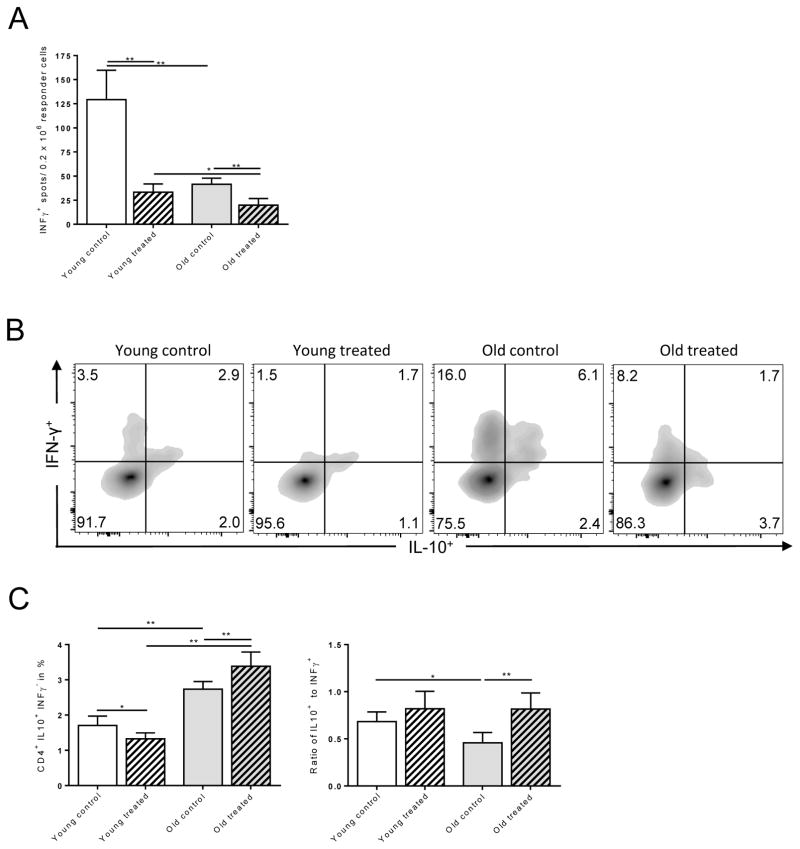
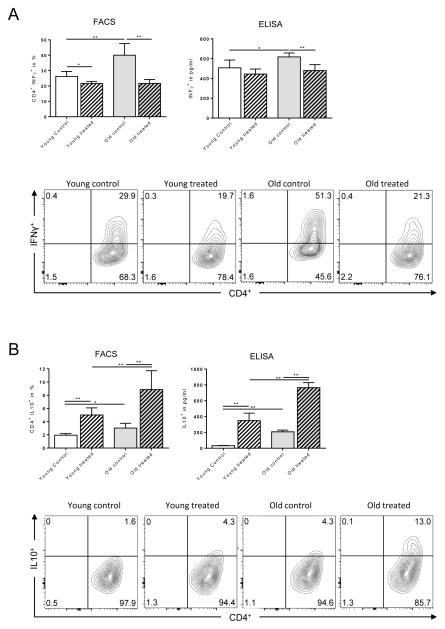
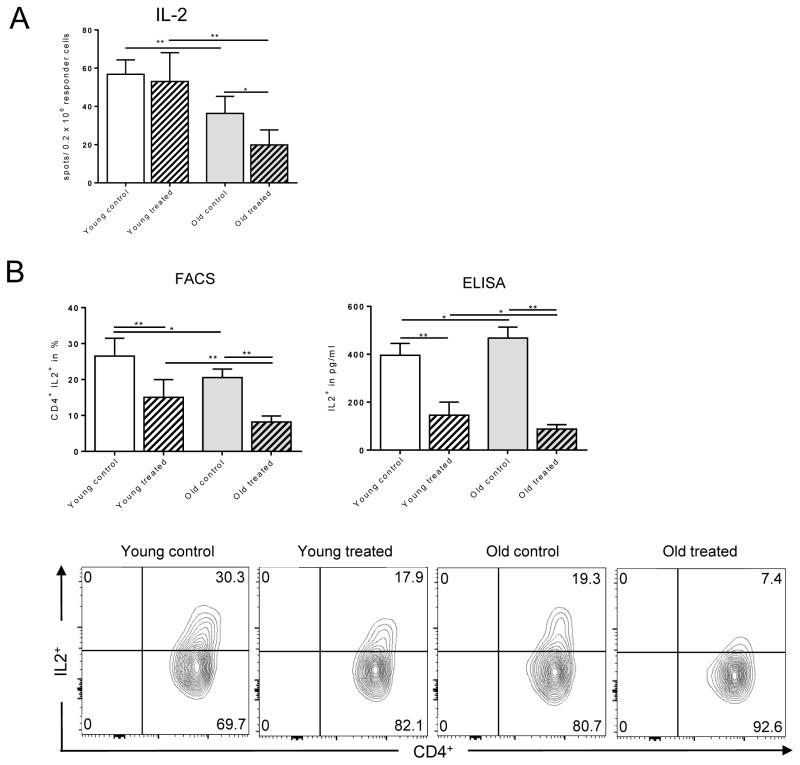
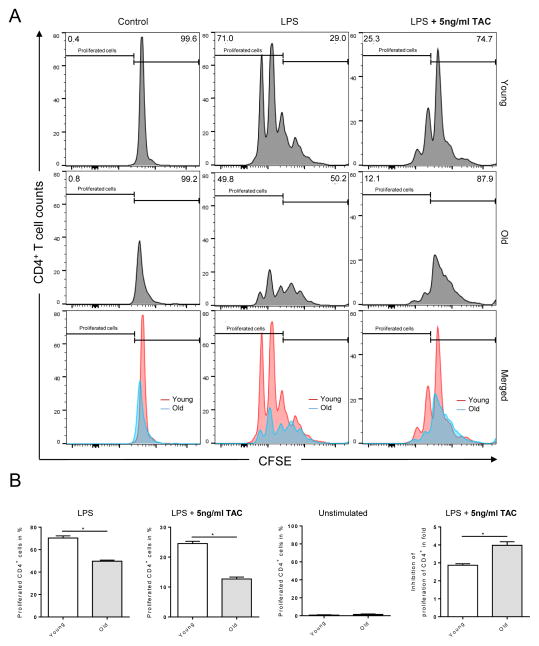
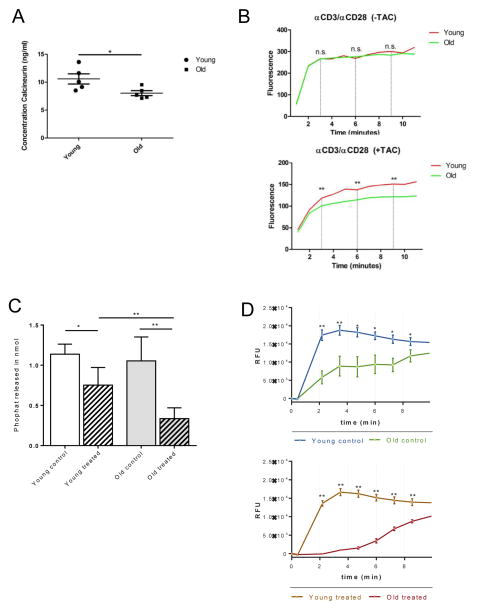
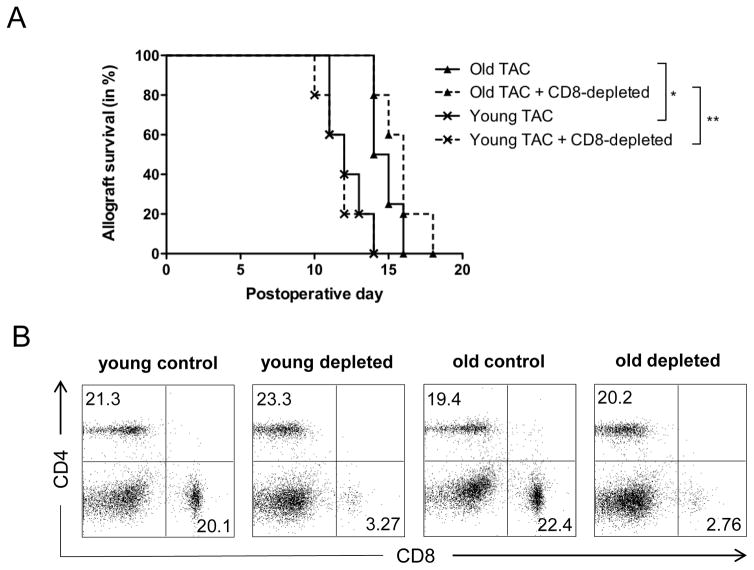
Immunosuppression in elderly recipients has been underappreciated in clinical trials. Here, we assessed age-specific effects of the calcineurin inhibitor tacrolimus (TAC) in a murine transplant model and assessed its clinical relevance on human T cells. Old recipient mice exhibited prolonged skin graft survival compared with young animals after TAC administration. More important, half of the TAC dose was sufficient in old mice to achieve comparable systemic trough levels. TAC administration was able to reduce proinflammatory interferon-γ cytokine production and promote interleukin-10 production in old CD4+ T cells. In addition, TAC administration decreased interleukin-2 secretion in old CD4+ T cells more effectively while inhibiting the proliferation of CD4+ T cells in old mice. Both TAC-treated murine and human CD4+ T cells demonstrated an age-specific suppression of intracellular calcineurin levels and Ca2+ influx, two critical pathways in T cell activation. Of note, depletion of CD8+ T cells did not alter allograft survival outcome in old TAC-treated mice, suggesting that TAC age-specific effects were mainly CD4+ T cell mediated. Collectively, our study demonstrates age-specific immunosuppressive capacities of TAC that are CD4+ T cell mediated. The suppression of calcineurin levels and Ca2+ influx in both old murine and human T cells emphasizes the clinical relevance of age-specific effects when using TAC.

Keywords: basic (laboratory) research/science; calcineurin inhibitor (CNI); graft survival; immunobiology; immunosuppressant; immunosuppression/immune modulation; translational research/science.


Conflict of interest statement

Disclosure

The authors of this manuscript have no conflicts of interest to disclose as described by the American Journal of Transplantation.

Figures

Figure 1
Figure 1. Graft survival in young and old recipients
Skin allografts from young DBA mice were transplanted onto young and old C57BL/6 mice (n=7 per group). Recipients remained either (A) untreated, (B) received weight-adjusted TAC, or (C) trough level adjusted TAC. (D) Old recipients required only half of the weight-adapted dose (n=5 per group) to reach comparable, age-matched trough levels. Graft survival was significantly prolonged in old recipients receiving weight-adjusted TAC doses. Age-differences in graft survival remained, albeit less pronounced, when TAC was applied based on trough levels. Statistics: mean±SD; *p<0.05; **p<0.01. Log-rank test was used to compare graft survival; Mann-Whitney U test was used to compare groups.
Figure 2
Figure 2. TAC does not alter CD4+ T cell subpopulations
Skin allografts from young DBA mice were transplanted onto young and old C57BL/6 mice (n=5 per group) and treated with trough level adjusted TAC levels (young mice received 0.5mg/kg TAC and old mice 0.25mg/kg TAC). Mice received either α-CD8 (100μl in 1ml) or carrier solution (PBS, 1ml) intraperitoneally every other day after transplantation. After 7 days, splenocytes were collected and frequencies of CD4+CD44highCD62Llow effector/memory T cells and CD4+CD44lowCD62Lhigh naïve T cells were measured by flow cytometry (A). Representative FACS plots for each group are given (B). Statistics: n 5; mean±SD; *p<0.05; *p<0.001. Mann-Whitney U test was used to compare groups.
Figure 3
Figure 3. Th1-specific effects of TAC in old mice
Splenocytes (0.5 × 10⁶) from young and old C57BL/6 recipients were co-cultured with anergic, mitomycin-treated DBA/2 splenocytes (A). After 48 hrs, frequencies of IFN-γ+ CD4+ T cells were measured by ELISpot. Skin allografts from young DBA mice were transplanted onto young and old C57BL/6 mice (young mice received 0.5mg/kg TAC, old mice 0.25mg/kg TAC). By day 6, CD4+ T cells were isolated and stimulated for 4 hrs. CD4+ T cells were analyzed for IL-10 and IFN-γ production by flow cytometry (B, C). Statistics: n ≥ 5; mean±SD; *p<0.05; **p<0.001. Mann-Whitney U test was used to compare groups.
Figure 4
Figure 4. Effects of TAC in Th1-polarizing conditions
Naïve CD4+ T cells were cultured under Th1-polarizing conditions (50ng ml−1 recombinant mouse IL-2, 50ng ml−1 recombinant mouse IL-12 and 10 μg ml−1 anti-mouse Il-4; eBioscience, CA, USA). By 96 hrs, (A) IFN-γ and (B) IL-10 production were measured by flow cytometry and ELISA. Statistics: n ≥ 5; mean±SD; *p<0.05; **p<0.001. Mann-Whitney U test was used to compare groups.
Figure 5
Figure 5. More pronounced suppression of IL-2 in old CD4+ T cells subsequent to TAC treatment
Splenocytes (0.5 × 10⁶) from young and old C57BL/6 recipients of DBA/2 skin allografts were collected 6 days after transplantation; mice received trough level adjusted TAC (young mice received 0.5mg/kg TAC and old mice 0.25mg/kg TAC). Splenocytes were co-cultured with anergic DBA/2 splenocytes. By 48 hrs, IL-2 secretion was assessed by ELISpot (A). CD4+ T cells were isolated and stimulated with PMA/Ionomycin/Brefeldin A for 4 hrs. IL-2 secretion was measured by flow cytometry and ELISA (B). Statistics: n ≥5; mean±SD; *p<0.05; **p<0.001. Mann-Whitney U test was used to compare groups.
Figure 6
Figure 6. Impaired proliferation of old CD4+ T cells following TAC treatment
Splenocytes (0.5 × 10⁶) from young and old C57BL/6 recipients of DBA/2 skin allografts were collected 7 days after transplantation; mice received trough level adjusted TAC (young mice received 0.5mg/kg TAC and old mice 0.25mg/kg TAC). Afterwards, total splenocytes were cultured with (i) LPS (10ng/ml), (ii) LPS (10ng/ml) and treated with 5ng/ml TAC, or (iii) media alone and proliferation was determined by CFSE staining. After 72 hrs, cells were analyzed by flow cytometry. Statistics: n ≥ 5; mean±SD; *p<0.05. Mann-Whitney U test was used to compare groups.
Figure 7
Figure 7. Intracellular concentrations of calcineurin and Ca2+ in young and old murine and human CD4+ T cells
Isolated naïve CD4+ T cells from young and old mice were cultured in Th1-polarizing conditions and in presence of α-CD3/α-CD28. By 96 hrs, intracellular concentration of calcineurin was measured by sandwich ELISA (Cloud-Clone Corp., Houston, USA) (A). For measurement of Ca2+ influx, isolated naïve CD4+ T cells from young and old mice were cultured in Th1-polarizing conditions and in presence of α-CD3/α-CD28 for 96 hrs and treated with and without TAC (5ng/ml). Cells were dyed with a fluorescent Ca2+ calcium indicator (Fluo-4 NW calcium Assay kit, Molecular Probes, OR, USA) and then stimulated with PMA/Ionomycin including Brefeldin A (Biolegend, CA, USA) and subsequently analyzed with a fluorescence reader at 494 nm and 516 nm (B). In addition, isolated naïve CD4+ T cells from young (<30) and old (>75) volunteers were cultured under Th1-polarizing conditions, in presence of α-CD3 and α-CD28 with or without TAC (5ng/ml). By 96 hrs, the concentration of calcineurin was measured using a cellular calcineurin phosphatase activity assay (C). Next, isolated naïve young and old human CD4+ T cells were cultured under Th1-polarizing conditions and in presence of α-CD3 and α-CD28 for 96 hrs with or without TAC (5ng/ml) and dyed with a fluorescent Ca2+ calcium indicator (Fluo-4 NW calcium assay kit, Thermo Fisher Scientific). Following incubation, cells were stimulated with PMA/Ionomycin and fluorescence was read at 495nm and 520nm (D). Statistics: n=5; mean±SD; *p<0.05; **p<0.01. Mann-Whitney U test was used to compare groups.
Figure 8
Figure 8. Prolonged graft survival in old recipient animals following TAC administration is not mediated by CD8+ T cells
Skin allografts from young DBA mice were transplanted onto young and old C57BL/6 mice and treated with trough level adjusted TAC levels (young mice received 0.5mg/kg TAC and old mice 0.25mg/kg TAC). Mice received either α-CD8 (100μl in 1ml) or carrier solution (PBS, 1ml) intraperitoneally every other day after transplantation and graft survival was monitored (A). After 7 days, splenocytes were collected and frequencies of CD4+ and CD8+ T cells were measured using flow cytometry (B). Representative plots of n=5 per group are shown. Statistics: *p<0.05; **p<0.01. Log-rank test was used to compare graft survival.

Similar articles

Cited by

References

    1. World Population Ageing 2013. United Nations, Department of Economic and Social Affairs, Population Division; 2013. ST/ESA/SER.A/348.
    1. Organ Procurement and Transplantation Network (OPTN) and Scientific Registry of Transplant Recipients (SRTR) OPTN/SRTR 2012 Annual Data Report. U.S. Department of Health and Human Services, Health Resources and Services Administration; 2014.
    1. Watt KDS, Pedersen RA, Kremers WK, Heimbach JK, Sanchez W, Gores GJ. Long-term probability of and mortality from de novo malignancy after liver transplantation. Gastroenterology. 2009;137:2010–7. - PMC - PubMed
    1. Karim A, Farrugia D, Cheshire J, Mahboob S, Begaj I, Ray D, et al. Recipient age and risk for mortality after kidney transplantation in England. Transplantation. 2014;97:832–8. - PubMed
    1. Blosser CD, Huverserian A, Bloom RD, Abt PD, Goral S, Thomasson A, et al. Age, exclusion criteria, and generalizability of randomized trials enrolling kidney transplant recipients. Transplantation. 2011;91:858–63. - PMC - PubMed