

Estimation of influenza-attributable medically attended acute respiratory illness by influenza type/subtype and age, Germany, 2001/02-2014/15
- PMID: 27754611
- PMCID: PMC5304576
- DOI: 10.1111/irv.12434
Estimation of influenza-attributable medically attended acute respiratory illness by influenza type/subtype and age, Germany, 2001/02-2014/15
Abstract
Background: The total burden of influenza in primary care is difficult to assess. The case definition of medically attended "acute respiratory infection" (MAARI) in the German physician sentinel is sensitive; however, it requires modelling techniques to derive estimates of disease attributable to influenza. We aimed to examine the impact of type/subtype and age.
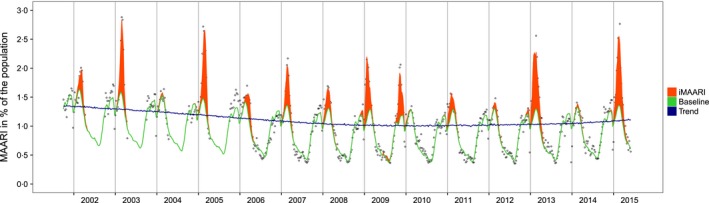
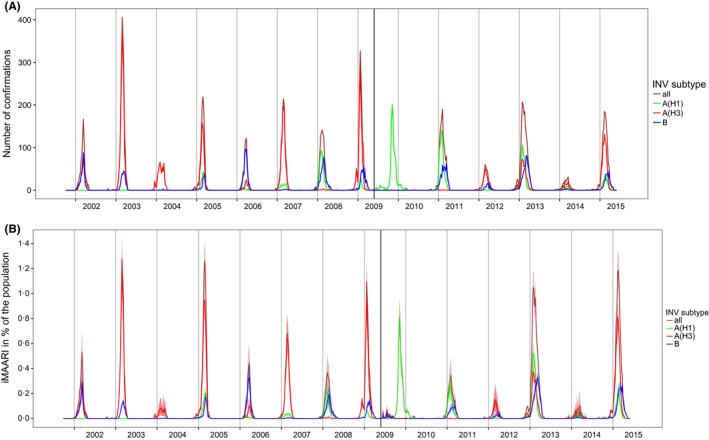
Methods: Data on MAARI and virological results of respiratory samples (virological sentinel) were available from 2001/02 until 2014/15. We constructed a generalized additive regression model for the periodic baseline and the secular trend. The weekly number of influenza-positive samples represented influenza activity. In a second step, we distributed the estimated influenza-attributable MAARI (iMAARI) according to the distribution of types/subtypes in the virological sentinel.
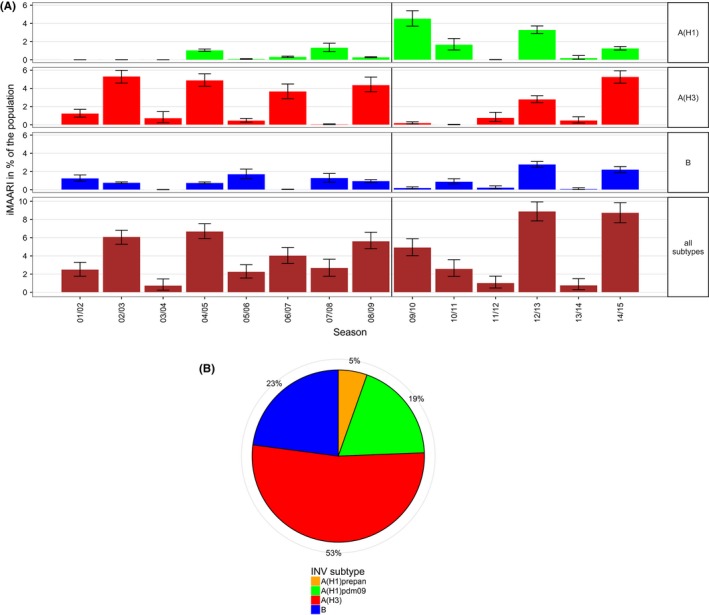
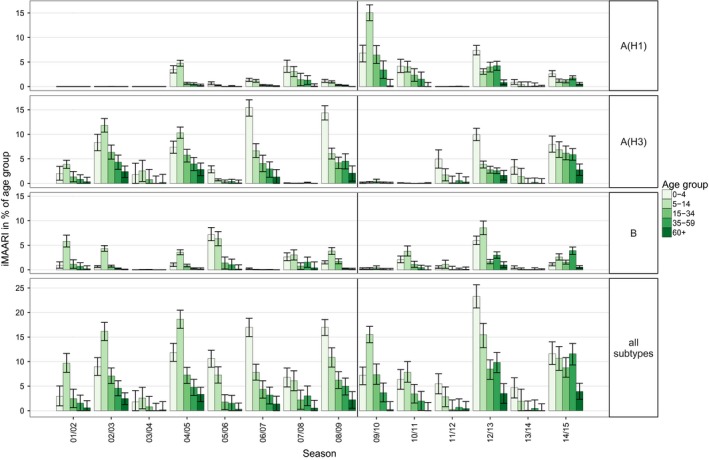
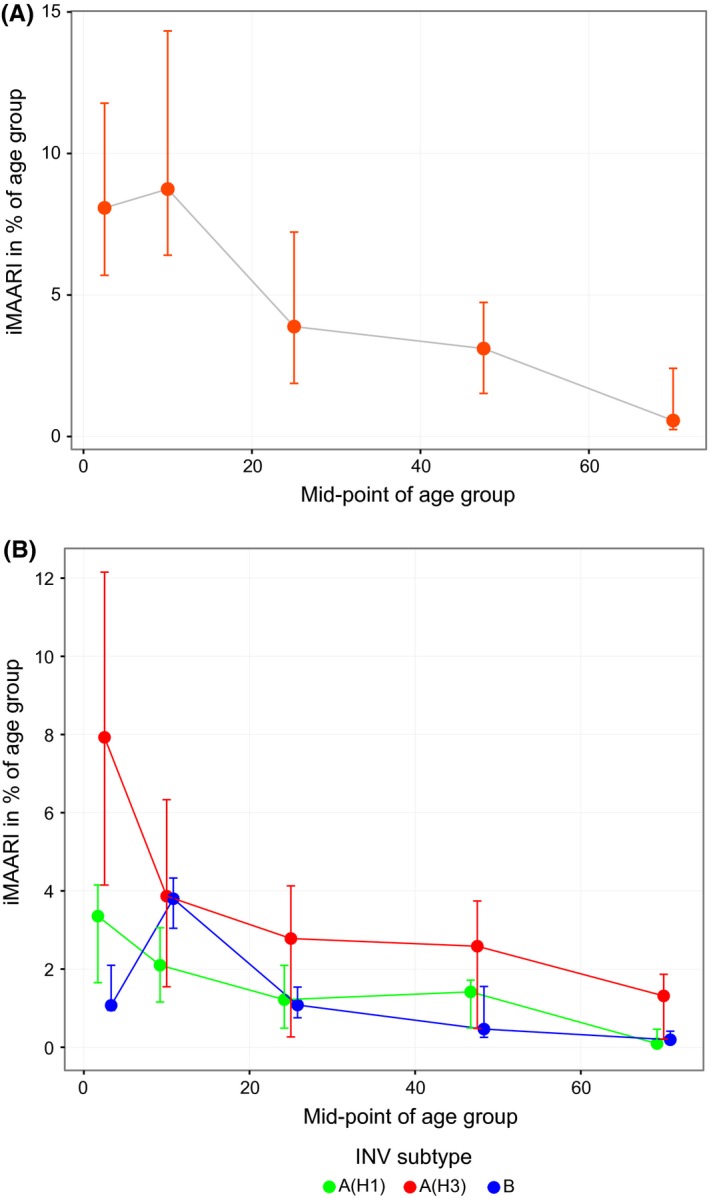
Results: Season-specific iMAARI ranged from 0.7% to 8.9% of the population. Seasons with the strongest impact were dominated by A(H3), and iMAARI attack rate of the pandemic 2009 (A(H1)pdm09) was 4.9%. Regularly the two child age groups (0-4 and 5-14 years old) had the highest iMAARI attack rates reaching frequently levels up to 15%-20%. Influenza B affected the age group of 5- to 14-year-old children substantially more than any other age group. Sensitivity analyses demonstrated both comparability and stability of the model.
Conclusion: We constructed a model that is well suited to estimate the substantial impact of influenza on the primary care sector. A(H3) causes overall the greatest number of iMAARI, and influenza B has the greatest impact on school-age children. The model may incorporate time series of other pathogens as they become available.
Keywords: Germany; burden of disease; generalised additive model; influenza; influenza type/subtype; medically attended acute respiratory illness.
© 2016 The Authors. Influenza and Other Respiratory Viruses Published by John Wiley & Sons Ltd.
Figures
Similar articles
-
Spotlight influenza: Laboratory-confirmed seasonal influenza in people with acute respiratory illness: a literature review and meta-analysis, WHO European Region, 2004 to 2017.Euro Surveill. 2021 Sep;26(39):2000343. doi: 10.2807/1560-7917.ES.2021.26.39.2000343. Euro Surveill. 2021. PMID: 34596019 Free PMC article. Review.
-
School absenteeism among school-aged children with medically attended acute viral respiratory illness during three influenza seasons, 2012-2013 through 2014-2015.Influenza Other Respir Viruses. 2017 May;11(3):220-229. doi: 10.1111/irv.12440. Epub 2017 Feb 15. Influenza Other Respir Viruses. 2017. PMID: 27885805 Free PMC article.
-
Influenza Virus Subtyping by Multiplex PCR during Winter Months of 2017-2018.J Coll Physicians Surg Pak. 2019 May;29(5):459-462. doi: 10.29271/jcpsp.2019.05.459. J Coll Physicians Surg Pak. 2019. PMID: 31036119
-
[Influenza surveillance in five consecutive seasons during post pandemic period: results from National Influenza Center, Turkey].Mikrobiyol Bul. 2016 Jul;50(3):401-17. doi: 10.5578/mb.27775. Mikrobiyol Bul. 2016. PMID: 27525396 Turkish.
-
Impact of Nonpharmaceutical Interventions During the COVID-19 Pandemic on Medically Attended Acute Respiratory Infection: The U.S. Naval Academy Experience.Mil Med. 2023 May 16;188(5-6):e953-e956. doi: 10.1093/milmed/usab469. Mil Med. 2023. PMID: 36940347 Free PMC article. Review.
Cited by
-
Estimation of influenza- and respiratory syncytial virus-attributable medically attended acute respiratory infections in Germany, 2010/11-2017/18.Influenza Other Respir Viruses. 2019 Jul 24;13(5):517-21. doi: 10.1111/irv.12666. Online ahead of print. Influenza Other Respir Viruses. 2019. PMID: 31339223 Free PMC article.
-
Influenza B virus infections in Western Saxony, Germany in three consecutive seasons between 2015 and 2018: Analysis of molecular and clinical features.Vaccine. 2019 Oct 8;37(43):6550-6557. doi: 10.1016/j.vaccine.2019.08.027. Epub 2019 Sep 11. Vaccine. 2019. PMID: 31521415 Free PMC article.
-
Respiratory infections in children and adolescents in Germany during the COVID-19 pandemic.J Health Monit. 2023 Jun 14;8(2):20-38. doi: 10.25646/11437. eCollection 2023 Jun. J Health Monit. 2023. PMID: 37408711 Free PMC article.
-
Spotlight influenza: Laboratory-confirmed seasonal influenza in people with acute respiratory illness: a literature review and meta-analysis, WHO European Region, 2004 to 2017.Euro Surveill. 2021 Sep;26(39):2000343. doi: 10.2807/1560-7917.ES.2021.26.39.2000343. Euro Surveill. 2021. PMID: 34596019 Free PMC article. Review.
-
Burden of medically attended influenza in Norway 2008-2017.Influenza Other Respir Viruses. 2019 May;13(3):240-247. doi: 10.1111/irv.12627. Epub 2019 Jan 13. Influenza Other Respir Viruses. 2019. PMID: 30637942 Free PMC article.
References
-
- Aguilera JF, Paget WJ, Mosnier A, et al. Heterogeneous case definitions used for the surveillance of influenza in Europe. Eur J Epidemiol. 2003;18:751–754. - PubMed
-
- CDC (Centers for Disease Control and Prevention) . Overview of Influenza Surveillance in the United States. http://www.cdc.gov/flu/weekly/overview.htm. Accessed April 10, 2015.
-
- ECDC (European Centers for Disease Control and Prevention) . Influenza case definitions. http://ecdc.europa.eu/en/activities/surveillance/eisn/surveillance/pages.... Accessed April 10, 2015.
-
- Carrat F, Vergu E, Ferguson NM, et al. Time lines of infection and disease in human influenza: a review of volunteer challenge studies. Am J Epidemiol. 2008;167:775–785. - PubMed
MeSH terms
LinkOut - more resources
Full Text Sources
Other Literature Sources
Medical
