. 2016 Dec 16;15(24):3419-3431.
doi: 10.1080/15384101.2016.1246093. Epub 2016 Oct 18.

Fbxo28 promotes mitotic progression and regulates topoisomerase IIα-dependent DNA decatenation

Affiliations

Fbxo28 promotes mitotic progression and regulates topoisomerase IIα-dependent DNA decatenation

Anne-Sophie Kratz et al. Cell Cycle. .

Abstract

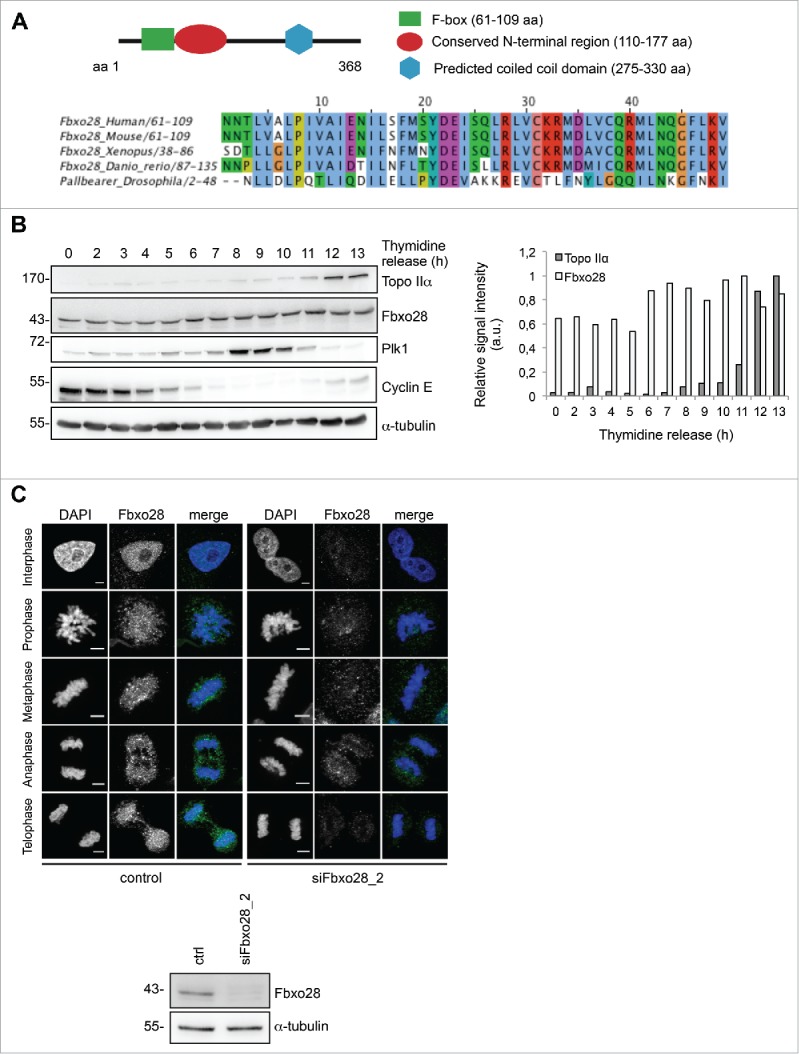
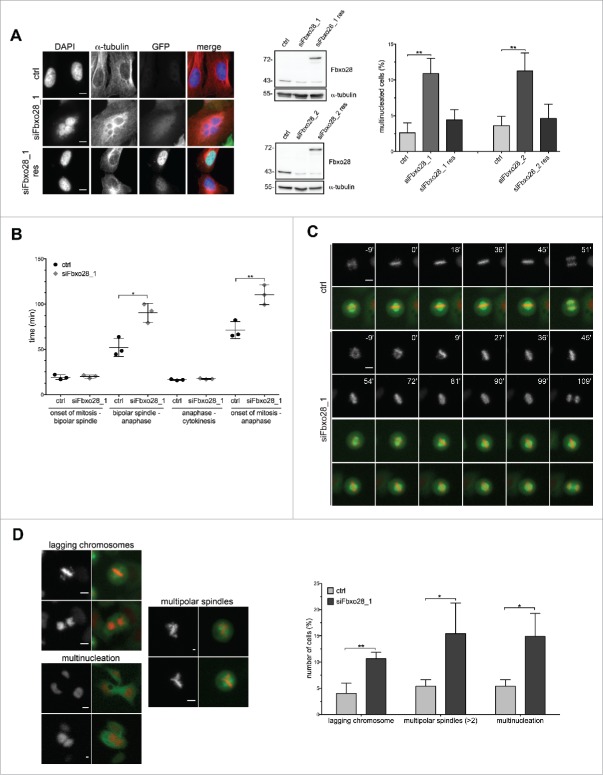
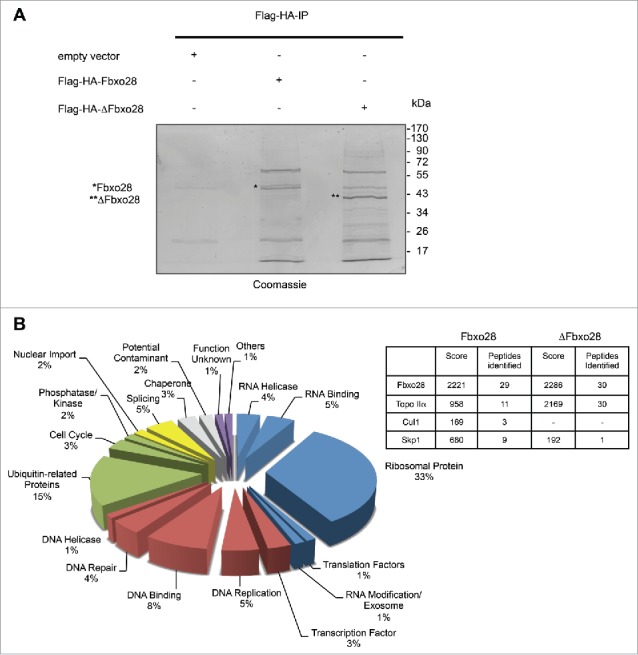
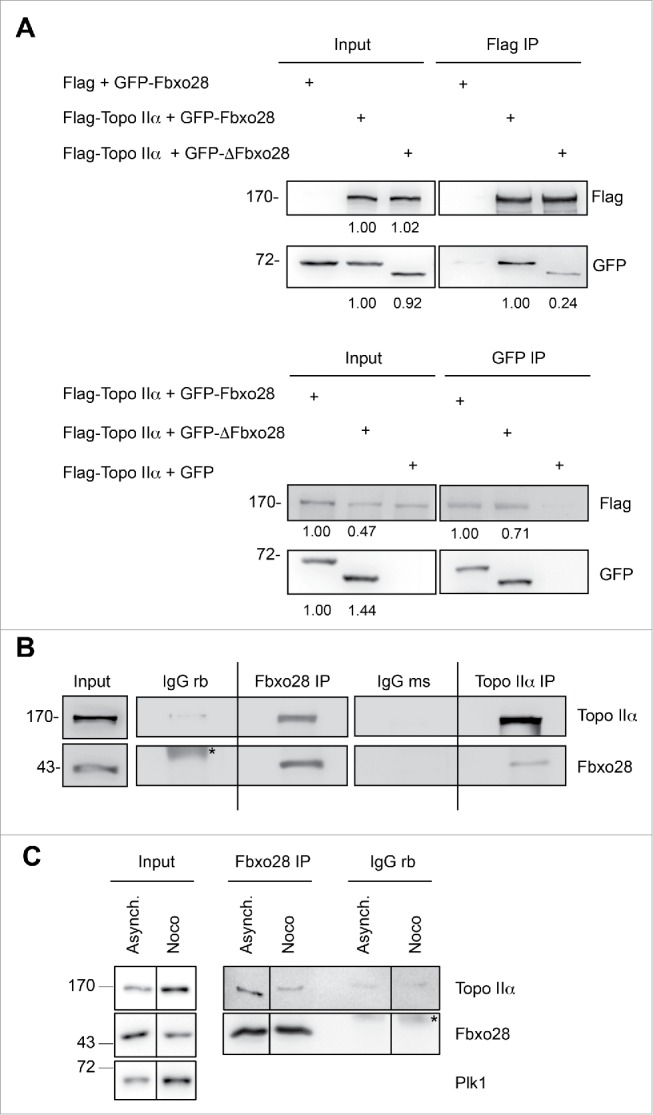
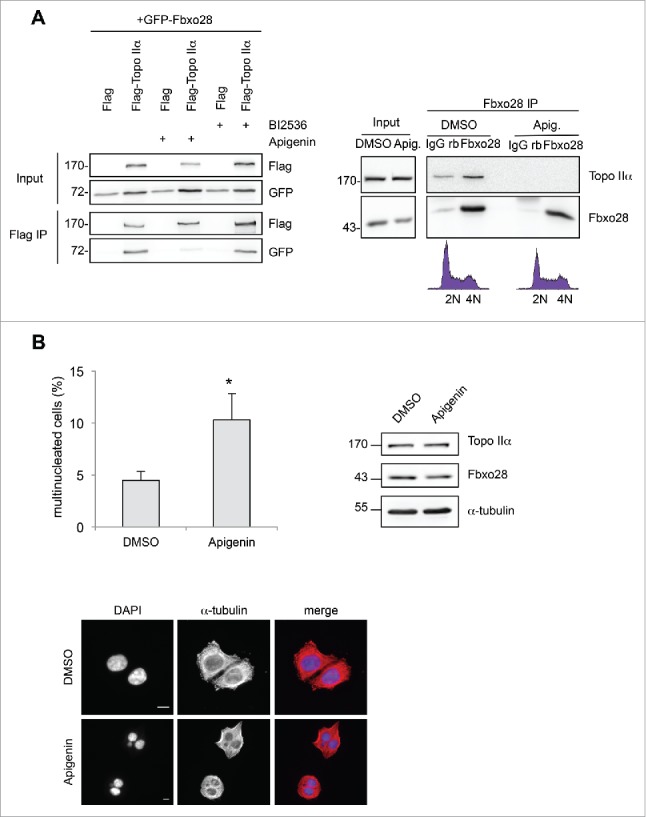
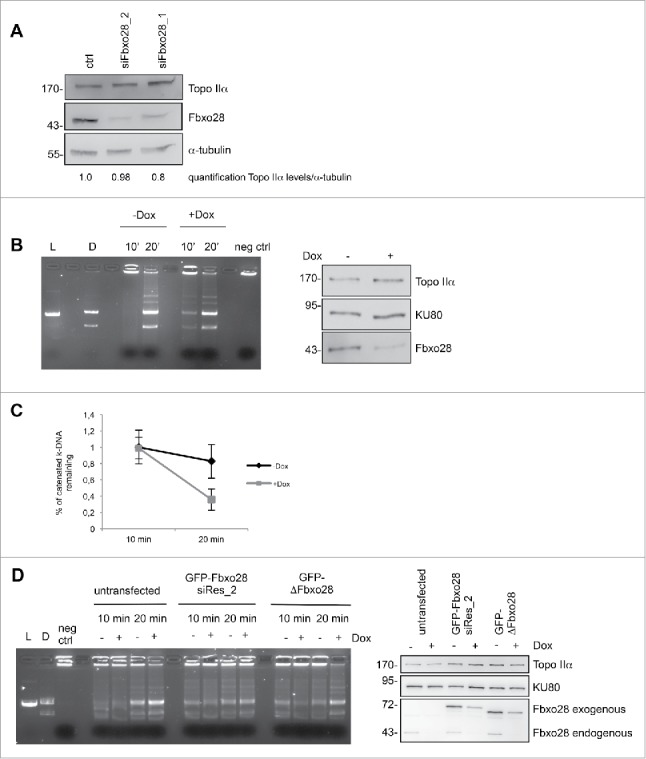
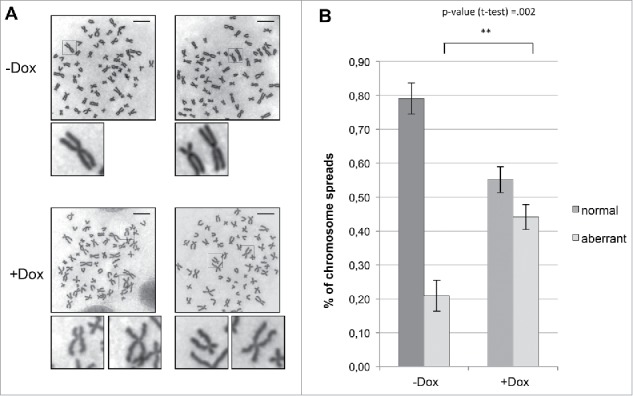
Topoisomerase IIα is an essential enzyme that resolves topological constraints in genomic DNA. It functions in disentangling intertwined chromosomes during anaphase leading to chromosome segregation thus preserving genomic stability. Here we describe a previously unrecognized mechanism regulating topoisomerase IIα activity that is dependent on the F-box protein Fbxo28. We find that Fbxo28, an evolutionarily conserved protein, is required for proper mitotic progression. Interfering with Fbxo28 function leads to a delay in metaphase-to-anaphase progression resulting in mitotic defects as lagging chromosomes, multipolar spindles and multinucleation. Furthermore, we find that Fbxo28 interacts and colocalizes with topoisomerase IIα throughout the cell cycle. Depletion of Fbxo28 results in an increase in topoisomerase IIα-dependent DNA decatenation activity. Interestingly, blocking the interaction between Fbxo28 and topoisomerase IIα also results in multinucleated cells. Our findings suggest that Fbxo28 regulates topoisomerase IIα decatenation activity and plays an important role in maintaining genomic stability.

Keywords: Cell cycle; F-box protein; Fbxo28; SCF; Topoisomerase IIα; decatenation; mitosis.


Figures

Figure 1.
Figure 1.
Fbxo28 is an evolutionary conserved nuclear protein. (A) Scheme of Fbxo28 structure and protein alignment of the Fbxo28 F-box sequence from Human, Mouse, Xenopus, Danio rerio and Drosophila reveals a high conservation in multiple species. (B) HeLa cells were synchronized by a double thymidine block and released for 13 h. Fbxo28 (Fbxo28 ab2) and Topo IIα (Topo IIα ab2) protein levels were analyzed by immunoblotting. Cyclin E and Plk1 were used to monitor cell cycle progression. α−tubulin served as a loading control. The quantification shows relative Topo IIα and Fbxo28 signal intensities after normalization to the α−tubulin signals. (C) For indirect immunofluorescence analysis HeLa cells were treated twice with 10 nM control or Fbxo28 siRNA for 48 h. Cells were fixed and stained with Fbxo28 ab1 (green). Nuclei were counterstained with DAPI (blue) and endogenous Fbxo28 localization was imaged throughout the cell cycle. Scale bar, 5 µm. Western blot showing downregulation of Fbxo28 (Fbxo28 ab1). α-tubulin served as a loading control.
Figure 2.
Figure 2.
Fbxo28 depletion leads to multinucleation and prolonged mitosis. (A) U2OS cells were transiently transfected with control (ctrl) or Fbxo28 siRNA (siFbxo28_1, siFbxo28_2) and with GFP alone or siRNA-resistant version of GFP-Fbxo28 (res). Cells were synchronized with a double thymidine block for 48 h. Multinucleated cells (n = 450–700 cells for siFbxo28_2; n = 200 cells for siFbxo28_1) were analyzed by immunofluorescence staining from 3 independent experiments. Representative images of multinucleation upon Fbxo28 siRNA depletion. Western blot showing downregulation of Fbxo28 and expression of GFP-Fbxo28 siRNA-resistant plasmids (using Fbxo28 ab1). Quantification showing percentages of multinucleated cells. Error bars in the graph represent standard deviation (SD). Student's t-test was used to calculate p-values. ** denotes significance at P < 0.01. (B) HeLa cells stably expressing GFP-α-tubulin/RFP-H2B were transfected twice with control (ctrl, GL2) or Fbxo28 siRNA (siFbxo28_1) for 72 h and synchronized by a double thymidine block followed by live-cell imaging for 10–12 h. Quantification of live-cell imaging displaying the time from either onset of mitosis to the formation of a bipolar spindle, bipolar spindle to anaphase or anaphase to cytokinesis or onset of mitosis until anaphase. Scatter dot plot showing mean of 3 unbiased experiments. n = 38–127 cells each from 3 independent experiments. (C) Representative frame series of movies from prometaphase to anaphase of control and Fbxo28 siRNA treated cells with continuous time points (min) (gray: RFP-H2B; merge: GFP-α-tubulin/RFP-H2B). (D) HeLa cells stably expressing GFP-α-tubulin/RFP-H2B were treated as described in (B). Representative images of cells with lagging chromosomes, multinucleation and multipolar spindles upon Fbxo28 downregulation are shown (left). Quantification of live-cell imaging of lagging chromosomes, multinucleation and multipolar spindles (right). n = 50–145 cells each from 3 independent experiments. Scale bar, 10 µm. Error bars in the graph represent standard deviation, SD. Student's t-test was used to calculate p-values. *denotes significance at p < 0.05; **denotes significance at p < 0.01.
Figure 3.
Figure 3.
Identification of Fbxo28 interacting proteins. (A) HEK293T cells were transfected with Flag-HA-Fbxo28, Flag-HA-ΔFbxo28 or control plasmid (Flag). MG132 was added 4h before harvesting the cells. Fbxo28 was immunoprecipitated first with an anti-Flag tag antibody followed by Flag-peptide elution. The eluate was then subjected to a second anti-HA immunoprecipitation with subsequent HA-peptide elution. The final elutions were separated by SDS-PAGE and proteins were stained with colloidal coomassie. The gel was sent for mass spectrometry analysis. Asterisk (*) indicates eluted Flag-HA-Fbxo28, double asterisk (**) indicates Flag-HA-ΔFbxo28. (B) Classification of identified proteins by functional category. Numbers indicate the percentage of identified proteins in each category. The table summarizes a selection of specifically identified proteins in the Flag-HA-Fbxo28 IP, Cul1 and Skp1 as known interaction partners and Topo IIα as a novel Fbxo28 interaction partner.
Figure 4.
Figure 4.
Interaction between Topo IIα and Fbxo28. (A) Co-immunoprecipitation of Flag-Topo IIα and GFP-Fbxo28 or GFP-ΔFbxo28. Lysates from HEK293T cells were transfected with the indicated plasmids and subjected to immunoprecipitations using anti-Flag or anti-GFP antibodies. Immunoprecipitations were washed 5 times in lysis buffer. Input and IP samples were analyzed by Western blotting with antibodies against Flag-tag or GFP-tag. Quantifications of the Flag and GFP signal intensities are indicated below the corresponding blots. Flag and GFP signal intensities in the IP samples were normalized using the bait signal intensities. (B) Co-immunoprecipitation of endogenous Fbxo28 and Topo IIα. Endogenous Fbxo28 and Topo IIα were immunoprecipitated from HEK293T lysates by anti-Fbxo28 (Fbxo28 ab2) and anti-Topo IIα (Topo IIα ab2) antibodies. IP with non-specific IgGs served as a control. Co-immunoprecipitated proteins were detected by Western blotting using the indicated antibodies. Asterisk (*) indicates unspecific band. The dividing lane marks the grouping of images from different parts of the same gel, as an intervening lane was removed for presentation purposes. (C) Co-immunoprecipitation of endogenous Fbxo28 and Topo IIα. Endogenous Fbxo28 was immunoprecipitated from lysates of asynchronous or Nocodazole (Noco)-treated (mitotic) cells by anti-Fbxo28 antibodies (Fbxo28 ab2). IP with non-specific rabbit IgGs served as a control. Co-immunoprecipitated proteins were detected by Western blotting using Topo IIα ab2 and Fbxo28 ab2. Plk1 was detected to monitor the cell cycle stage. Asterisk (*) indicates IgG heavy chains. The dividing lanes mark the grouping of images from different parts of the same gel, as an intervening lane was removed for presentation purposes.
Figure 5.
Figure 5.
Inhibition of Fbxo28 binding to Topo IIα leads to multinucleated cells. (A) left, HEK293T cells were either transfected with GFP-Fbxo28 and Flag alone (control) or with Flag-Topo IIα for 24 h and treated either with 100 nM BI2536 (Plk1 inhibitor) for 2 h or 50 µM Apigenin (CK2 inhibitor) for 5 h. Flag-Topo IIα was immunoprecipitated using anti-Flag antibodies and samples were analyzed by Western blotting using antibodies against the Flag or GFP-tag. Right, Endogenous Fbxo28 (Fbxo28 ab2) and Topo IIα (Topo IIα ab2) were immunoprecipitated from HEK293T lysates (treated with either DMSO or 50 µM Apigenin for 5h). IP with non-specific IgGs served as a control. Co-immunoprecipitated proteins were detected by Western blotting. (B) To synchronize cells in mitosis HeLa cells were treated with thymidine for 22 h, released from the thymidine block for 6 h and arrested in mitosis by Nocodazole treatment for 4 h. After mitotic shake-off and release from the Nocodazole block, 50 µM Apigenin was added to the cells for 5 h in order to inhibit CK2 kinase activity. Control cells were treated with DMSO. Multinucleation was analyzed by immunofluorescence microscopy in 3 independent experiments (n = 55–85 cells for each independent experiment). Representative images illustrate multinucleation upon Apigenin treatment. Scale bar: 10 µm. The graph shows a quantification of multinucleated cells. Error bars in the graph represent SD. Student's t-test was used to calculate p-values. *denotes significance at P < 0.05. Topo IIα (Topo IIα ab1) and Fbxo28 (Fbxo28 ab2) protein levels were monitored by Western blotting.
Figure 6.
Figure 6.
Downregulation of Fbxo28 leads to an increased Topoisomerase IIα decatenation activity. (A) Fbxo28 downregulation does not affect Topo IIα levels. HeLa cells were transfected twice with 10 nM of control (GL2) or Fbxo28 oligos and incubated for 48 h. Cells were lysed and total protein levels were analyzed by Western blotting using Topo IIα ab1 and Fbxo28 ab2. Topo IIα protein levels were quantified relative to α-tubulin levels. (B) In vitro decatenation assay was carried out with nuclear extracts (2 µg) from Dox-inducible HeLa S/A shFbxo28 cell line (induced for 72 h). The reactions were stopped after 10 or 20 min and catenated vs. decatenated DNA was separated by agarose gel electrophoresis. L, linearized k-DNA marker. D, decatenated k-DNA marker. Equally loaded amounts of Topo IIα (Topo IIα ab 2) and Fbxo28 (Fbxo28 ab 2) downregulation were verified by Western blotting (left). The DNA-binding protein KU80 served as a loading control. (C) Quantification of remaining k-DNA from 3 independent decatenation assays. (D) In vitro decatenation assay was carried out as in (b). Additionally GFP-Fbxo28 siRes_2 or GFP-ΔFbxo28 plasmids were transfected. Western blot showing equally loaded amounts of Topo IIα and Fbxo28 downregulation. L, linearized k-DNA marker. D, decatenated k-DNA marker.
Figure 7.
Figure 7.
Fbxo28 depletion leads to aberrant chromosome morphology. HeLa S/A shFbxo28 cells induced with doxycycline for 72 h were treated with Colchicine for 1 h, harvested, and Giemsa-stained chromosome spreads were prepared. (A) Representative images show normal chromosome spreads in control (-Dox) cells and aberrant chromosome spreads in Fbxo28-depleted cells (+Dox), Scale bar: 10 µm. (B) Quantification of the percentage of normal and aberrant chromosome spreads in control or Fbxo28-depleted cells from 3 independent experiments (n = 100 cells per experiment). Error bars in the graph represent SD. Student's t-test was used to calculate p-values. **denotes significance at P < 0.01.

Similar articles

Cited by

References

    1. Chen SH, Chan NL, Hsieh TS. New mechanistic and functional insights into DNA topoisomerases. Annu Rev Biochem 2013; 82:139-70; PMID:23495937; http://dx.doi.org/10.1146/annurev-biochem-061809-100002 - DOI - PubMed
    1. Heck MM, Hittelman WN, Earnshaw WC. Differential expression of DNA topoisomerases I and II during the eukaryotic cell cycle. Proc Natl Acad Sci U S A 1988; 85:1086-90; PMID:2829215; http://dx.doi.org/10.1073/pnas.85.4.1086 - DOI - PMC - PubMed
    1. Ishida R, Sato M, Narita T, Utsumi KR, Nishimoto T, Morita T, Nagata H, Andoh T. Inhibition of DNA topoisomerase II by ICRF-193 induces polyploidization by uncoupling chromosome dynamics from other cell cycle events. J Cell Biol 1994; 126:1341-51; PMID:8089169; http://dx.doi.org/10.1083/jcb.126.6.1341 - DOI - PMC - PubMed
    1. Oliveira RA, Hamilton RS, Pauli A, Davis I, Nasmyth K. Cohesin cleavage and Cdk inhibition trigger formation of daughter nuclei. Nat Cell Biol 2010; 12:185-92; PMID:20081838; http://dx.doi.org/10.1038/ncb2018 - DOI - PMC - PubMed
    1. Holm C, Goto T, Wang JC, Botstein D. DNA topoisomerase II is required at the time of mitosis in yeast. Cell 1985; 41:553-63; PMID:2985283; http://dx.doi.org/10.1016/S0092-8674(85)80028-3 - DOI - PubMed