. 2017 May 4;11(3):196-208.
doi: 10.1080/19336950.2016.1249076. Epub 2016 Oct 18.

TRPV3 mutants causing Olmsted Syndrome induce impaired cell adhesion and nonfunctional lysosomes

Affiliations

TRPV3 mutants causing Olmsted Syndrome induce impaired cell adhesion and nonfunctional lysosomes

Manoj Yadav et al. Channels (Austin). .

Abstract

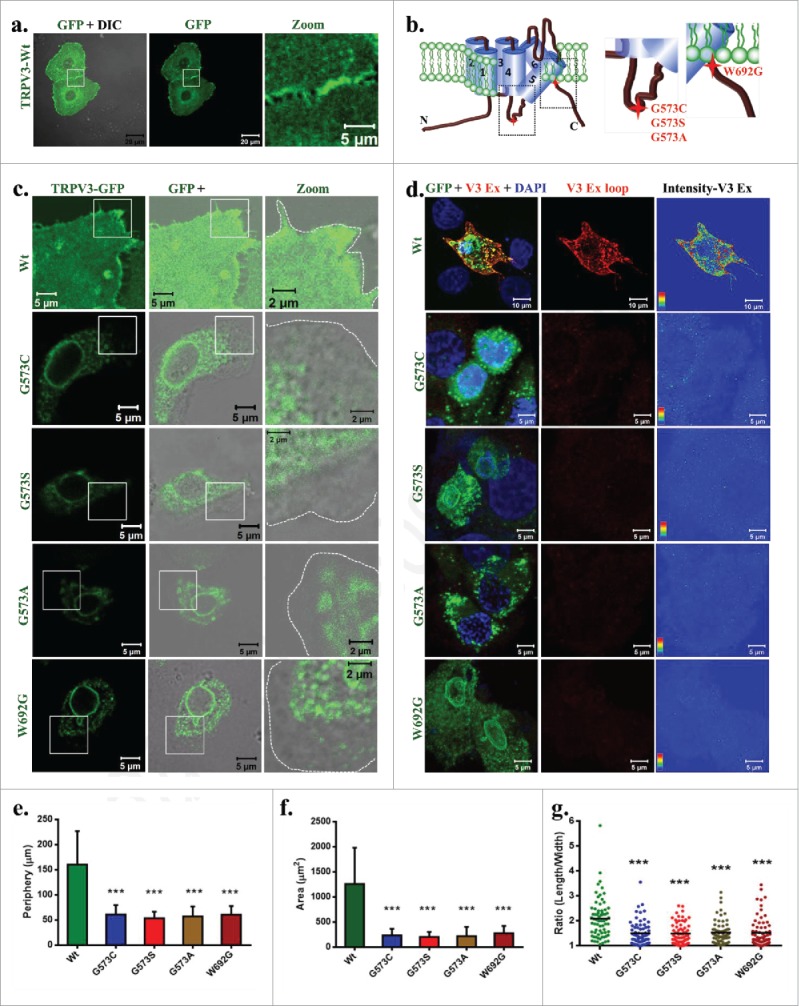
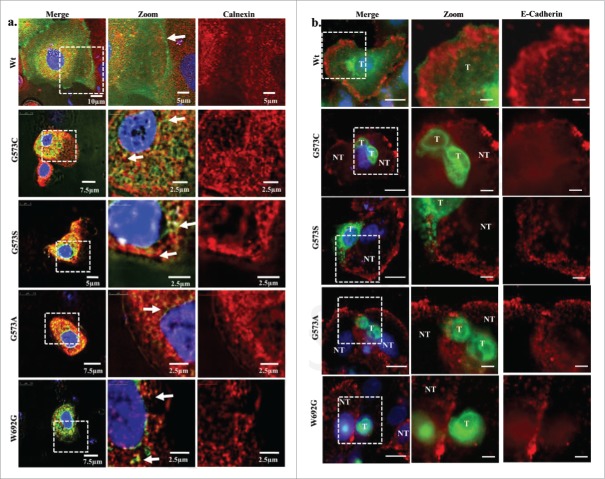
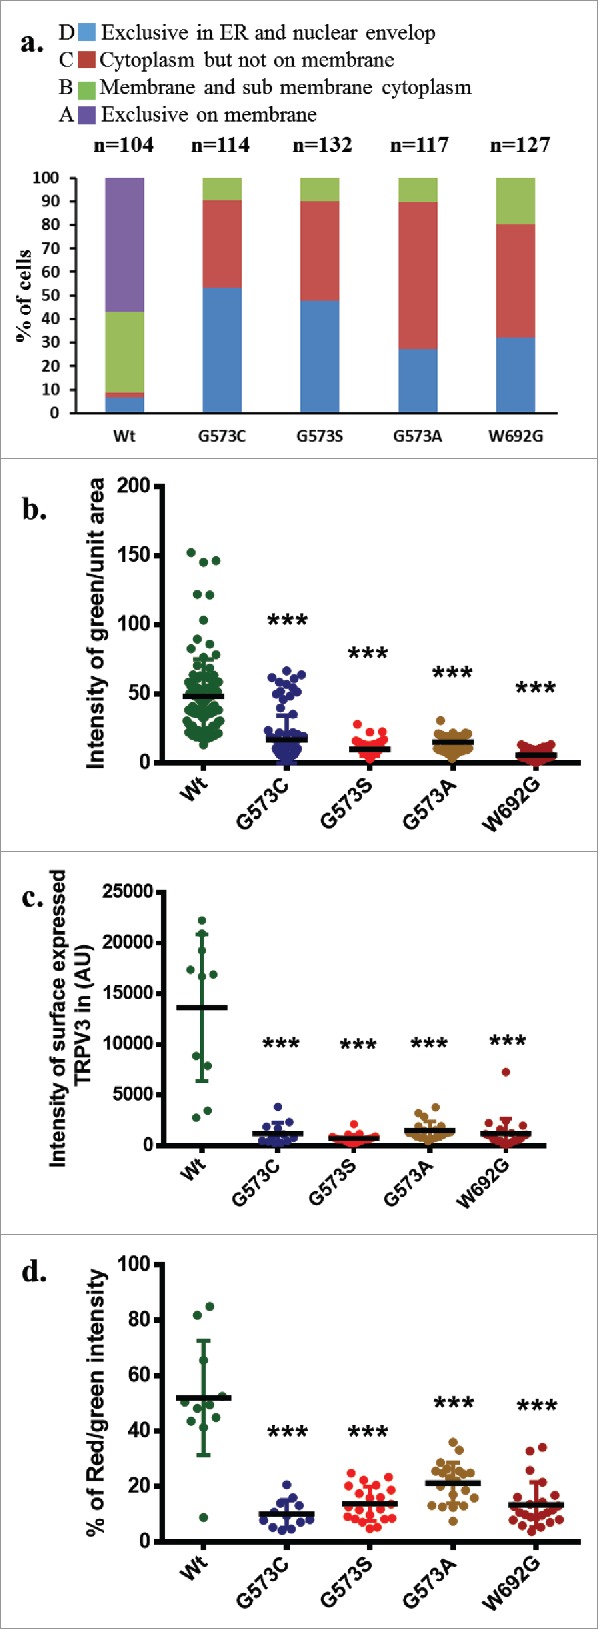
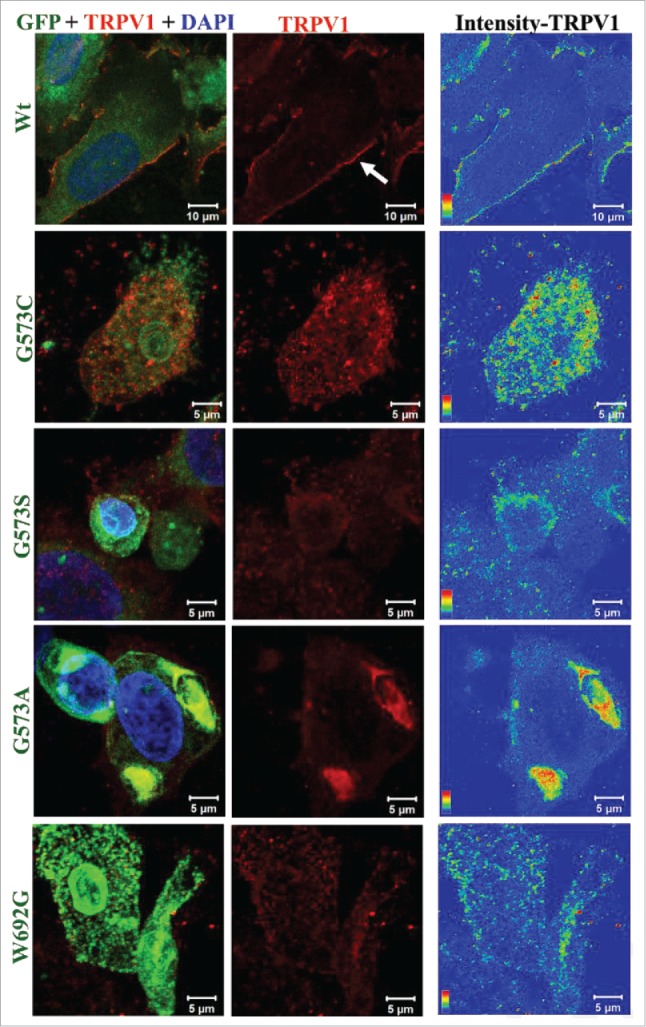
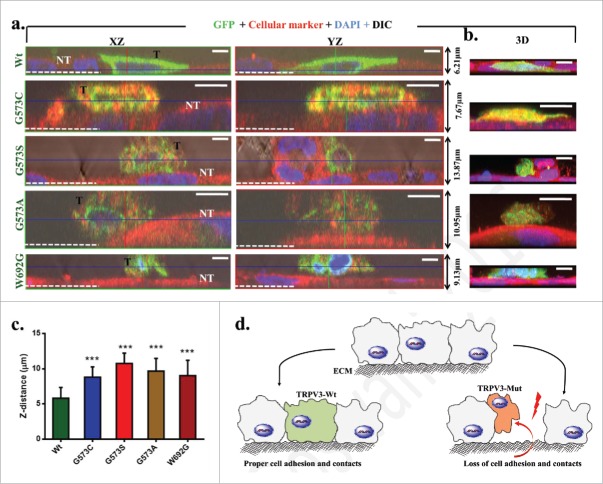
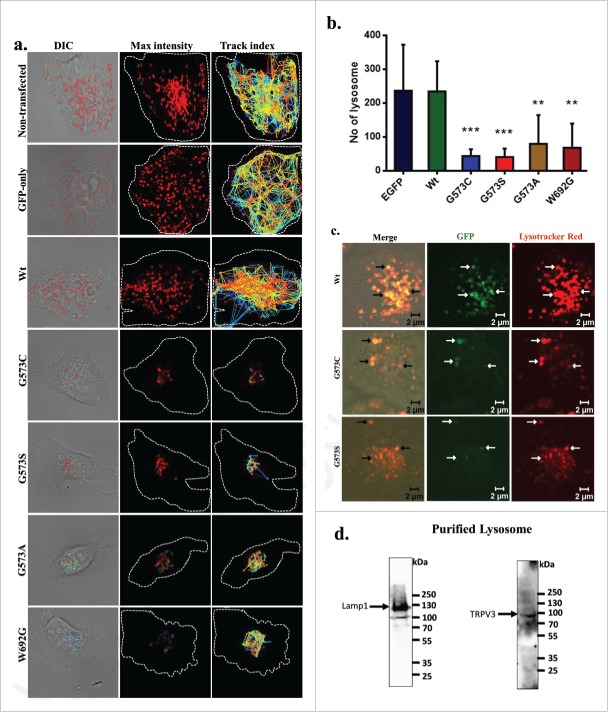
TRPV3 is a non-selective cationic channel and is important for several physiological functions. It can be activated by physiological temperature and selective endogenous and exogenous compounds. TRPV3 is one of the key ion channel involved in Ca2+-signaling in keratinocyte and thus involved in skin-related functions. Recently, naturally occurring mutations in TRPV3, namely G573A, G573S, G573C and W692G have been detected which are linked with the development of pathophysiological conditions such as Olmsted Syndrome (OS) and other skin disorders. Our qualitative and quantitative data suggests that these naturally occurring TRPV3 mutants are mainly restricted in the ER. Expression of OS-mutants cause impaired vesicular trafficking resulting reduced surface localization of these mutants and other membrane proteins too. OS-mutants also cause reduced cell adhesion, altered distribution and less number of lysosomes. Our data confirms that TRPV3 is a lysosomal protein suggesting that Olmsted Syndrome is a lysosomal disorder. These findings may have a broad implication in the context of keratinocyte functions, skin-degeneration and in skin-cancer.

Keywords: Olmsted Syndrome; TRPV; keratinocytes; lysosomal disorder; skin; surface expression.


Figures

Figure 1.
Figure 1.
OS-mutants but not TRPV3-Wt have reduced surface expression. (A) Shown are the 3D-reconstituted confocal images of HaCaT cells transiently expressing TRPV3-Wt-GFP. The enlarged image demonstrates the presence of TRPV3 at cell-cell contact sites. (B) Positions of point mutations (G573A, G573S, G573C and W692G) are indicated. (C) The GFP fluorescence (green) alone or merged with DIC are shown. OS-mutants show no localization at the cell surface (cell boundary is indicated by dotted line) and accumulate at the ER. (D) An extracellular loop-specific antibody detects TRPV3 available at the cell surface (red) only in un-permeabilized cells expressing TRPV3-Wt but not in un-permeabilized cells expressing OS-mutants. Intensity of TRPV3staining is provided in the right side. (E-G) expressing OS-mutants have much reduced cell periphery (E), area (F) and are more round in shape (in each case n = 70 cells and p value < 0.001 is considered as significant).
Figure 2.
Figure 2.
OS-mutants co localize with calnexin and not with E cadherin. (A) Shown are the confocal images of HaCaT cells transiently expressing TRPV3-Wt-GFP or OS-mutants. Cells were fixed within 36 hours after transfection and the cells were stained for anti Calnexin antibody. TRPV3-Wt shows discrete ER labeling and TRPV3 localization on membrane, while OS mutants shows co localization with ER (Merge image) suggesting that OS mutants have reduced surface expression and are primarily retained in ER. (B) Immunolocalization of TRPV3-Wt-GFP and OS mutants with membrane marker E cadherin is shown. TRPV3-Wt-GFP shows proper E cadherin labeling and proper TRPV3 localization on membrane, while OS mutants are not localize on the membrane. In most cases, cells expressing OS-mutants have much reduced E cadherin staining (T and NT represent transfected and non-transfected cells respectively). Scale bar is 10µm and 5µm for merge and zoom images.
Figure 3.
Figure 3.
OS mutants reveal reduced surface expression. (A) Percentage scoring of cells expressing TRPV3-Wt-GFP or OS-mutants are shown. Cells were classified according to the localization of TRPV3, i.e.: exclusively on the membrane (A-type), in membrane and in the sub-membranous region (B-type), in cytoplasm but not on the membrane (C-type), and exclusively in the ER and in nuclear envelope (D-type). TRPV3-Wt-GFP is primarily localized on membrane and sub membranous region, while OS mutants are mainly restricted in the ER and in the nuclear envelop. (B) Quantification of the amount of TRPV3 (GFP fluorescence) present in plasma membrane per unit surface area are shown. Minimum 10 or more numbers of region-of-interests (ROI) in the membrane region from individual cells (n = 20 or more) in each group was considered and plotted. (C) Quantification of the total surface expression of TRPV3 is shown. Amount of TRPV3 present in the surface is quantified by calculating total intensity of fluorescence in un-permeabilized cells detected by extracellular loop-specific antibody raised against TRPV3. Microscopic images of similar experiments are represented in Fig. 1D. (D) Percentage expression of TRPV3 at the surface is estimated by quantifying the total GFP fluorescence (considered as 100%) present in individual cells and the fluorescence of TRPV3 that can be labeled by extracellular-loop specific antibody. In each case, the p value <0.001 is considered as significant.
Figure 4.
Figure 4.
OS-mutants show impaired trafficking for membrane proteins. Confocal images of HaCaT cells transiently expressing TRPV1 along with either TRPV3-Wt-GFP or OS-mutants are shown. Cells were fixed 36 hours after transfection and were stained for TRPV1 using an antibody that is raised against extracellular loop of TRPV1. This antibody detects TRPV1 at the surface (red) only in cells expressing TRPV3-Wt-GFP but much less or not at all in cells expressing OS-mutants. Fluorescence of TRPV3-Wt-GFP or OS-mutants are represented in green and TRPV1 is represented in red. Intensity of surface-expressed TRPV1 is indicated in the rainbow scale (right panel).
Figure 5.
Figure 5.
Expression of OS-mutants induce impaired cell adhesion. (A) Shown are the XZ, YZ plane and 3D (right panel) confocal images of representative HaCaT cells that transiently express either TRPV3-Wt or OS-mutants. The GFP fluorescence (green) distinguishes the transfected cells (T) from non-transfected (NT) cells (red) and the white dotted line indicate the Z-position of the uncoated glass coverslip. While cells expressing TRPV3-Wt are flat and tightly adhere to the glass surface, the cells expressing OS-mutants are spherical, loosely attached to the glass surface and mostly grow on other non-transfected cells. Scale bar (5 μm). (C) OS-mutants reveal increment in Z-distance than the cells that express TRPV3-Wt (n = 20 cells in each case, P-value < 0.001). (D) A schematic diagram demonstrating the loss of cell adhesion and cell-to-cell contacts due to expression of OS-mutants.
Figure 6.
Figure 6.
TRPV3 is present in lysosomes and OS-mutants alter lysosomal numbers and movement. (A) Time-series confocal images were acquired for analyzing lysosomal movements in stable cells expressing TRPV3-Wt –GFP or OS-mutants. DIC images (white dotted lines show the periphery of the cells) superimposed with the florescence images (for Lysotraker-red labeled Lysosomes, red circles). The track-index of Lysosomal movements are indicated by lines (Right panel). For more details see movies (S1-S5). (B) HaCaT cells stably expressing OS-mutants have lower number of lysosomes (labeled with Lysotracker red) than the cells expressing TRPV3-Wt-GFP (P-values: *** < 0.001, ** < 0.01 TRPV3-G573C or TRPV3-G573S; n = 20 cells in each case). (C) Confocal images of stable HaCaT cells show that both TRPV3-Wt-GFP and OS-mutants:localize (white arrows) in lysosomes in live cells. Colocalization experiments with TRPV3-G573A and TRPV3-W692G failed mainly due to the undetectable level of tagged proteins and absence of lysosomes properly labeled with Lysotracker red. (D) Western blot analysis of lysosomal fraction isolated from goat brain shows the presence of endogenous TRPV3 there (indicated by arrow) and enrichment of lysosomal fraction shown with lysosomal marker.

Similar articles

Cited by

References

    1. Olmsted HC. Keratoderma palmaris et plantaris congenitalis: report of a case showing associated lesions of unusual location. Am J Dis Child 1927; 33:757-64; https://doi.org/10.1001/archpedi.1927.04130170055008 - DOI
    1. Duchatelet S, Hovnanian A. Olmsted syndrome: clinical, molecular and therapeutic aspects. Orphanet J Rare Dis 2015; 10:33; PMID:25886873; https://doi.org/10.1186/s13023-015-0246-5 - DOI - PMC - PubMed
    1. Requena L, Manzarbeitia F, Moreno C, Izquierdo MJ, Pastor MA, Carrasco L, Farina MC, Martin L. Olmsted syndrome: report of a case with study of the cellular proliferation in keratoderma. Am J Dermatopathol 2001; 23:514-20; PMID:11801792; https://doi.org/10.1097/00000372-200112000-00003 - DOI - PubMed
    1. Mevorah B, Goldberg I, Sprecher E, Bergman R, Metzker A, Luria R, Gat A, Brenner S. Olmsted syndrome: mutilating palmoplantar keratoderma with periorificial keratotic plaques. J Am Acad Dermatol 2005; 53:S266-72; PMID:16227106; https://doi.org/10.1016/j.jaad.2005.03.036 - DOI - PubMed
    1. Tharini GK, Hema N, Jayakumar S, Parveen B. Olmsted syndrome: report of two cases. Indian J Dermatol 2011; 56:591-3; PMID:22121289; https://doi.org/10.4103/0019-5154.87166 - DOI - PMC - PubMed

Substances