

Combined Deletion of Slc30a7 and Slc30a8 Unmasks a Critical Role for ZnT8 in Glucose-Stimulated Insulin Secretion
- PMID: 27754787
- PMCID: PMC5133349
- DOI: 10.1210/en.2016-1573
Combined Deletion of Slc30a7 and Slc30a8 Unmasks a Critical Role for ZnT8 in Glucose-Stimulated Insulin Secretion
Abstract
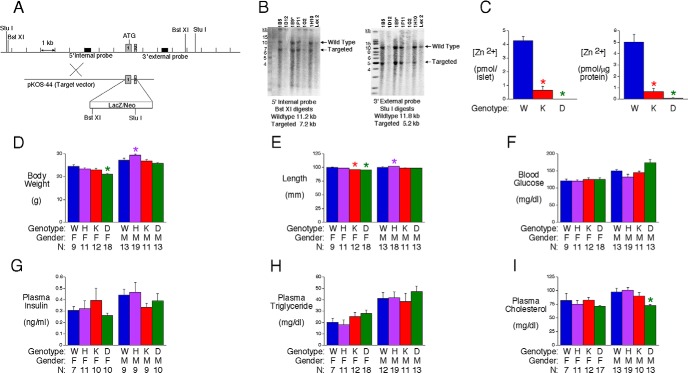
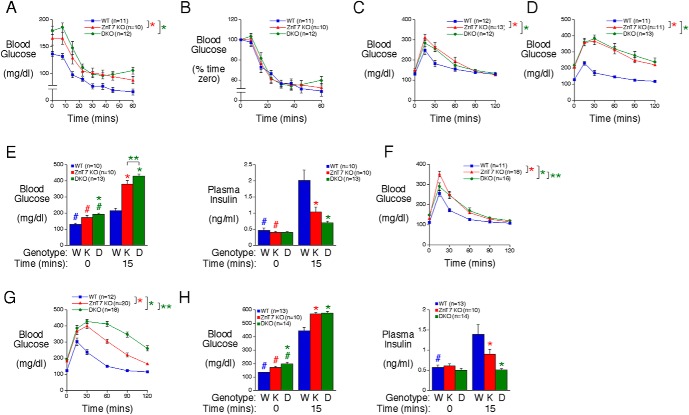
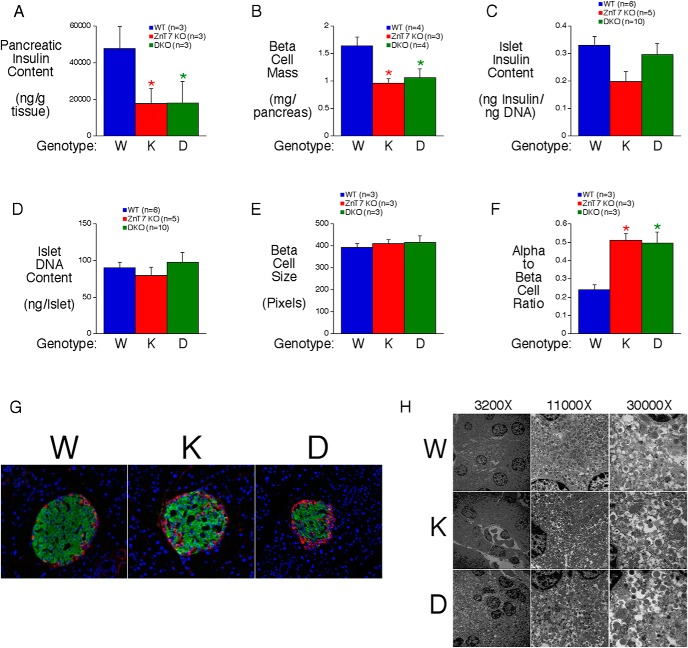
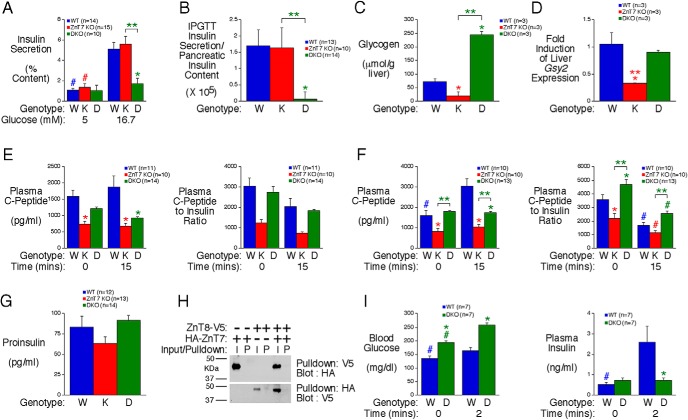
Polymorphisms in the SLC30A8 gene, which encodes the ZnT8 zinc transporter, are associated with altered susceptibility to type 2 diabetes (T2D), and SLC30A8 haploinsufficiency is protective against the development of T2D in obese humans. SLC30A8 is predominantly expressed in pancreatic islet β-cells, but surprisingly, multiple knockout mouse studies have shown little effect of Slc30a8 deletion on glucose tolerance or glucose-stimulated insulin secretion (GSIS). Multiple other Slc30a isoforms are expressed at low levels in pancreatic islets. We hypothesized that functional compensation by the Slc30a7 isoform, which encodes ZnT7, limits the impact of Slc30a8 deletion on islet function. We therefore analyzed the effect of Slc30a7 deletion alone or in combination with Slc30a8 on in vivo glucose metabolism and GSIS in isolated islets. Deletion of Slc30a7 alone had complex effects in vivo, impairing glucose tolerance and reducing the glucose-stimulated increase in plasma insulin levels, hepatic glycogen levels, and pancreatic insulin content. Slc30a7 deletion also affected islet morphology and increased the ratio of islet α- to β-cells. However, deletion of Slc30a7 alone had no effect on GSIS in isolated islets, whereas combined deletion of Slc30a7 and Slc30a8 abolished GSIS. These data demonstrate that the function of ZnT8 in islets can be unmasked by removal of ZnT7 and imply that ZnT8 may affect T2D susceptibility through actions in other tissues where it is expressed at low levels rather than through effects on pancreatic islet function.
Figures
Comment in
-
Zinc Transport Gets Its Zing Back: Double-Knockout of ZnT7 and ZnT8 Reveals the Importance of Zinc Transporters to Insulin Secretion.Endocrinology. 2016 Dec;157(12):4542-4544. doi: 10.1210/en.2016-1797. Endocrinology. 2016. PMID: 27911147 Free PMC article. No abstract available.
Similar articles
-
METRNL represses beta-to-alpha cell trans-differentiation to maintain beta cell function under diabetic metabolic stress in mice.Diabetologia. 2025 Aug;68(8):1769-1788. doi: 10.1007/s00125-025-06459-7. Epub 2025 Jun 10. Diabetologia. 2025. PMID: 40495021
-
Dapagliflozin Does Not Directly Affect Human α or β Cells.Endocrinology. 2020 Aug 1;161(8):bqaa080. doi: 10.1210/endocr/bqaa080. Endocrinology. 2020. PMID: 32428240 Free PMC article.
-
SGLT2 is not expressed in pancreatic α- and β-cells, and its inhibition does not directly affect glucagon and insulin secretion in rodents and humans.Mol Metab. 2020 Dec;42:101071. doi: 10.1016/j.molmet.2020.101071. Epub 2020 Sep 5. Mol Metab. 2020. PMID: 32896668 Free PMC article.
-
Evaluating glucose-dependent insulinotropic polypeptide and glucagon as key regulators of insulin secretion in the pancreatic islet.Am J Physiol Endocrinol Metab. 2024 Jul 1;327(1):E103-E110. doi: 10.1152/ajpendo.00360.2023. Epub 2024 May 22. Am J Physiol Endocrinol Metab. 2024. PMID: 38775725 Free PMC article. Review.
-
Zinc transporter 8 (ZnT8) and β cell function.Trends Endocrinol Metab. 2014 Aug;25(8):415-24. doi: 10.1016/j.tem.2014.03.008. Epub 2014 Apr 18. Trends Endocrinol Metab. 2014. PMID: 24751356 Free PMC article. Review.
Cited by
-
Cooperative function of Pdx1 and Oc1 in multipotent pancreatic progenitors impacts postnatal islet maturation and adaptability.Am J Physiol Endocrinol Metab. 2018 Apr 1;314(4):E308-E321. doi: 10.1152/ajpendo.00260.2017. Epub 2017 Dec 12. Am J Physiol Endocrinol Metab. 2018. PMID: 29351489 Free PMC article.
-
Zinc Transporter Proteins.Neurochem Res. 2018 Mar;43(3):517-530. doi: 10.1007/s11064-017-2454-y. Epub 2017 Dec 14. Neurochem Res. 2018. PMID: 29243032 Review.
-
Zinc Transport Gets Its Zing Back: Double-Knockout of ZnT7 and ZnT8 Reveals the Importance of Zinc Transporters to Insulin Secretion.Endocrinology. 2016 Dec;157(12):4542-4544. doi: 10.1210/en.2016-1797. Endocrinology. 2016. PMID: 27911147 Free PMC article. No abstract available.
-
Role of Zinc Homeostasis in the Pathogenesis of Diabetes and Obesity.Int J Mol Sci. 2018 Feb 6;19(2):476. doi: 10.3390/ijms19020476. Int J Mol Sci. 2018. PMID: 29415457 Free PMC article. Review.
-
SLC30A family expression in the pancreatic islets of humans and mice: cellular localization in the β-cells.J Mol Histol. 2018 Apr;49(2):133-145. doi: 10.1007/s10735-017-9753-0. Epub 2018 Jan 25. J Mol Histol. 2018. PMID: 29372370
References
-
- Rutter GA, Chimienti F. SLC30A8 mutations in type 2 diabetes. Diabetologia. 2015;58(1):31–36. - PubMed
-
- Kirchhoff K, Machicao F, Haupt A, et al. Polymorphisms in the TCF7L2, CDKAL1 and SLC30A8 genes are associated with impaired proinsulin conversion. Diabetologia. 2008;51(4):597–601. - PubMed
-
- Xu K, Zha M, Wu X, et al. Association between rs13266634 C/T polymorphisms of solute carrier family 30 member 8 (SLC30A8) and type 2 diabetes, impaired glucose tolerance, type 1 diabetes–a meta-analysis. Diabetes Res Clin Pract. 2011;91(2):195–202. - PubMed
-
- Boesgaard TW, Zilinskaite J, Vänttinen M, et al. The common SLC30A8 Arg325Trp variant is associated with reduced first-phase insulin release in 846 non-diabetic offspring of type 2 diabetes patients–the EUGENE2 study. Diabetologia. 2008;51(5):816–820. - PubMed
MeSH terms
Substances
Grants and funding
LinkOut - more resources
Full Text Sources
Other Literature Sources
Medical
Molecular Biology Databases
