. 2016 Dec;157(12):4943-4960.
doi: 10.1210/en.2016-1615. Epub 2016 Oct 18.

Hepatic Glucocorticoid Receptor Plays a Greater Role Than Adipose GR in Metabolic Syndrome Despite Renal Compensation

Affiliations

Hepatic Glucocorticoid Receptor Plays a Greater Role Than Adipose GR in Metabolic Syndrome Despite Renal Compensation

Sandip K Bose et al. Endocrinology. 2016 Dec.

Abstract

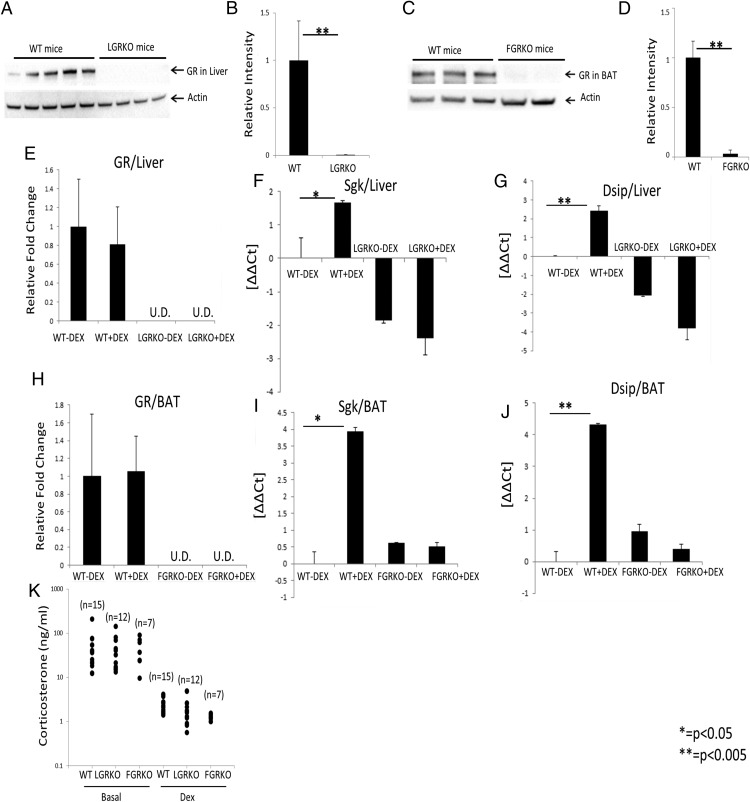
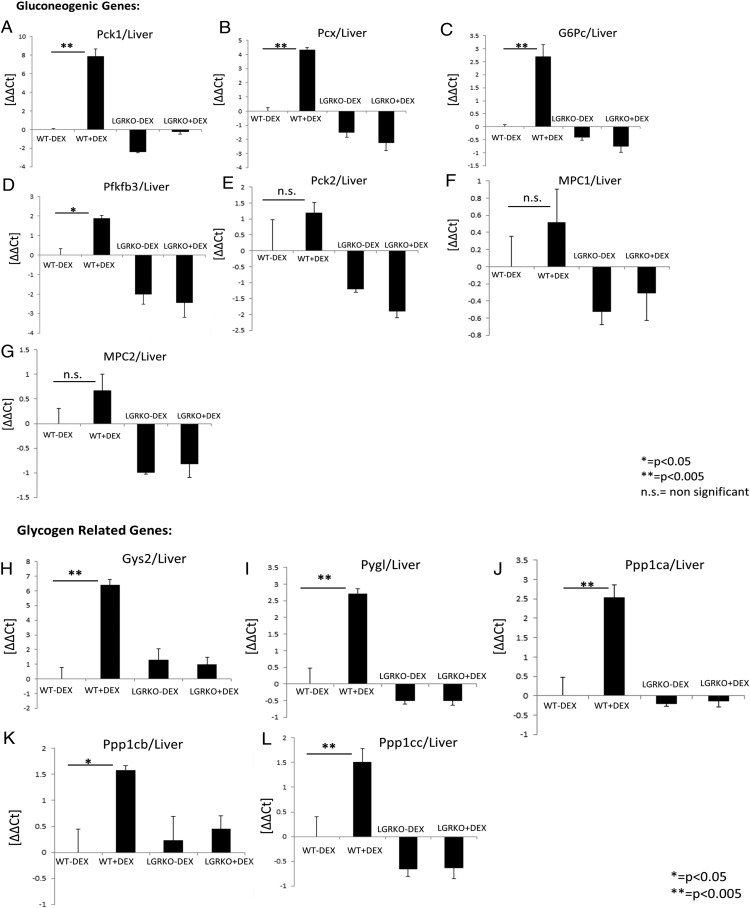
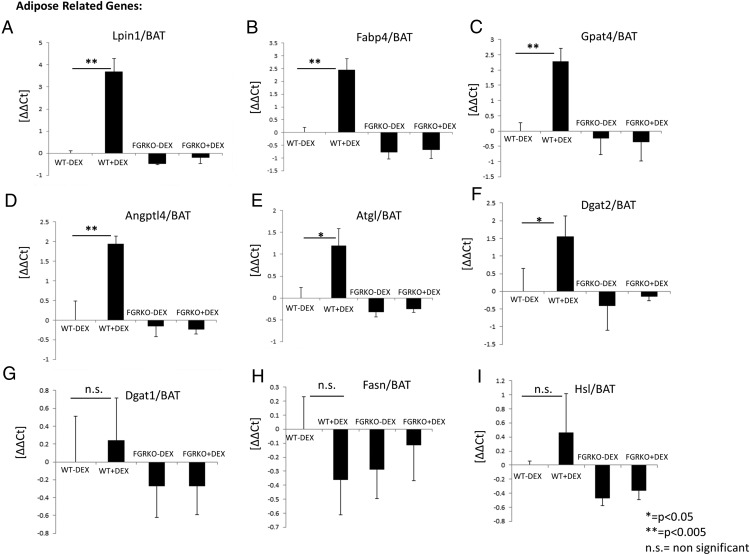
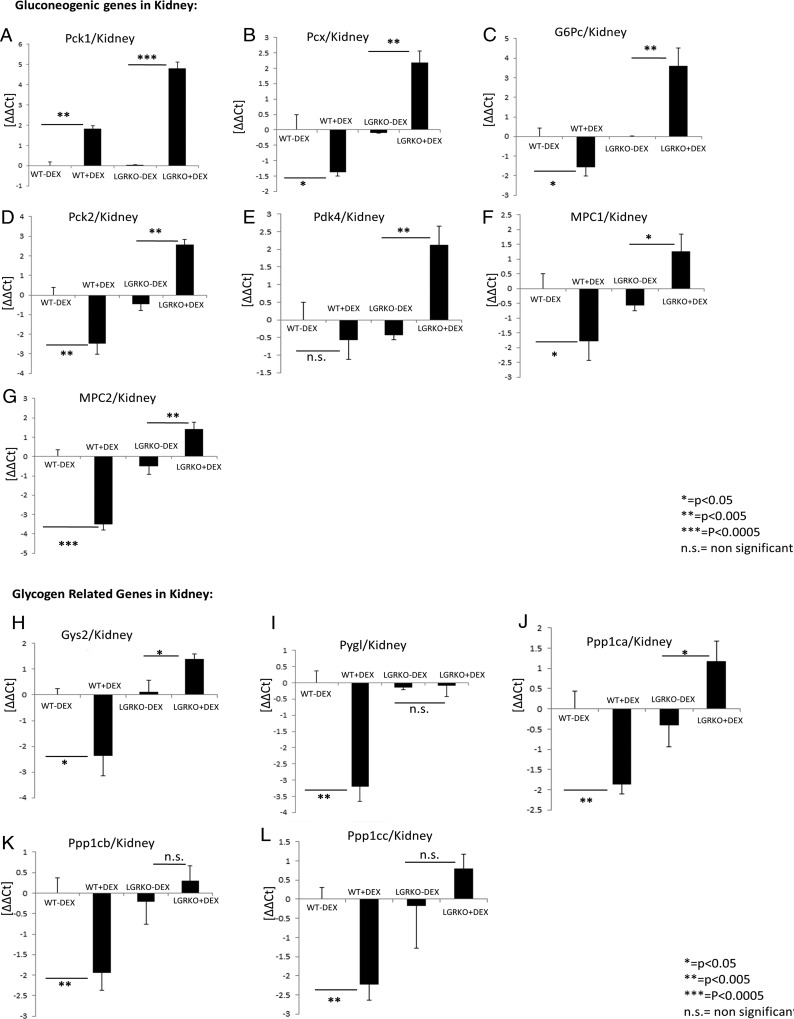
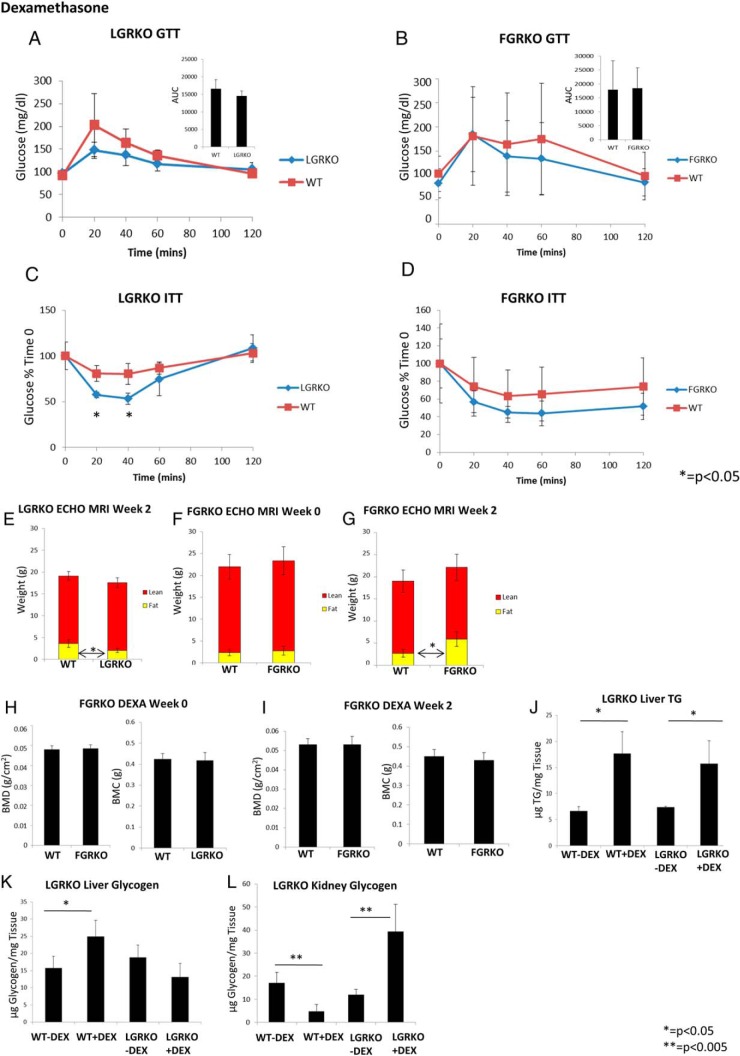
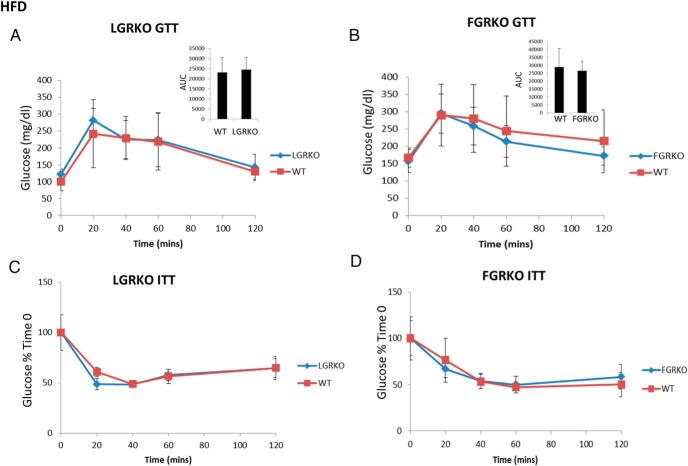
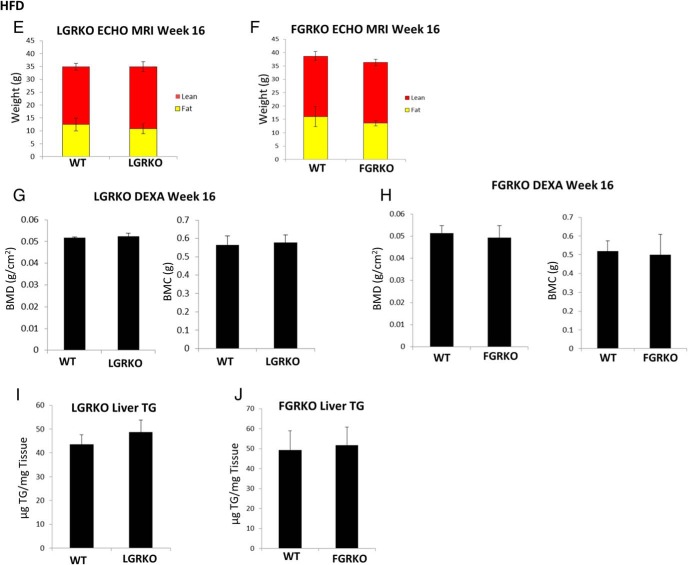
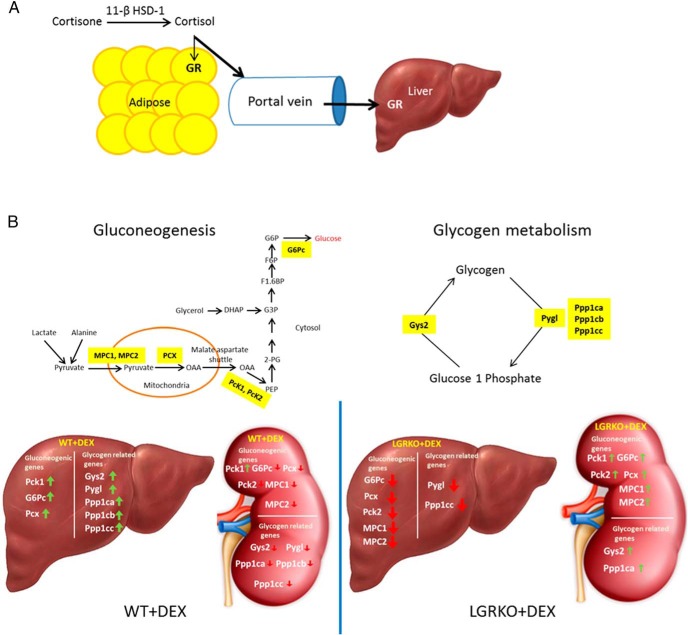
Exogenous glucocorticoid administration results in hyperglycemia, insulin resistance, hepatic dyslipidemia, and hypertension, a constellation of findings known as Cushing's syndrome. These effects are mediated by the glucocorticoid receptor (GR). Because GR activation in liver and adipose has been implicated in metabolic syndrome (MS), we wanted to determine the role of GR in these tissues in the development of MS. Because GR knockout (KO) mice (whole-body KO) exhibit perinatal lethality due to respiratory failure, we generated tissue-specific (liver or adipose) GRKO mice using cre-lox technology. Real-time PCR analysis of liver mRNA from dexamethasone-treated wildtype (WT) and liver GRKO mice indicated that hepatic GR regulates the expression of key genes involved in gluconeogenesis and glycogen metabolism. Interestingly, we have observed that liver-specific deletion of GR resulted in a significant increase in mRNA expression of key genes involved in gluconeogenesis and glycogen metabolism in kidney tissue, indicating a compensatory mechanism to maintain glucose homeostasis. We have also observed that GR plays an important role in regulating the mRNA expression of key genes involved in lipid metabolism. Liver GRKO mice demonstrated decreased fat mass and liver glycogen content compared with WT mice administered dexamethasone for 2 weeks. Adipose-specific deletion of GR did not alter glucose tolerance or insulin sensitivity of adipose GRKO mice compared with WT mice administrated dexamethasone. This indicates that liver GR might be more important in development of MS in dexamethasone-treated mice, whereas adipose GR plays a little role in these paradigms.


Figures

Figure 1.
Figure 1.
Validation of KO of GR in tissue-specific GRKO mice. A, Western blot analysis for determining protein expression of GR in liver samples of WT and LGRKO mice. Each lane represents a separate mouse. Actin levels were determined as a loading control. B, Quantification of GR protein level in liver from Western blotting of A using Image Lab Software (Bio-Rad). C, Western blot analysis for determining protein expression of GR in BAT samples of WT and FGRKO mice. Each lane represents a separate mouse. Actin levels were determined as a loading control. D, Quantification of GR protein level in BAT from Western blotting of C using Image Lab Software (Bio-Rad). E–G, Real-time PCR analysis for determining the mRNA expression status of GR and GR target genes induced in most cell types (Sgk, Dsip1) in liver samples of WT and LGRKO mice injected with saline or dexamethasone (10 mg/kg) for 6 h); U.D., undetermined. H–J, Real-time PCR analysis for determining the mRNA expression status of GR and GR target genes induced in most cell types (Sgk, Dsip1), in BAT samples of WT and FGRKO mice injected with saline or dexamethasone (10 mg/kg) for 6 hours. K, Plasma concentration of corticosterone in WT, LGRKO, and FGRKO mice at basal state, injected with saline or 1-mg/kg dexamethasone for 4 hours. Values are mean ± SD. (real-time PCR data for E and H have been normalized with WT-Dex equal to 1 for ease of understanding, for all other real-time PCR data, we have represented the data as ΔΔCt).
Figure 2.
Figure 2.
Liver-specific KO of GR inhibits dexamethasone-mediated stimulation of genes involved in carbohydrate metabolism. A–G, Real-time PCR analysis for determining the mRNA expression status of genes involved in gluconeogenesis (Pck1, Pcx, G6Pc, Pfkfb3, Pck2, Mpc1, Mpc2) in liver tissue of WT and LGRKO mice injected with saline or dexamethasone (10 mg/kg) for 6 hours. H–L, Real-time PCR analysis for determining the mRNA expression status of genes involved in glycogen metabolism (Gys2, Pygl, Ppp1ca, Ppp1cb, Ppp1cc) in liver tissue of WT and LGRKO mice injected with saline or dexamethasone (10 mg/kg) for 6 hours.
Figure 3.
Figure 3.
Adipose-specific KO of GR inhibits dexamethasone-mediated stimulation of genes involved in lipid metabolism. A–I, Real-time PCR analysis for determining the mRNA expression status of adipose-specific genes (Lpin1, Fabp4, Gpat4, Angptl4, Pnpla2, Dgat2, Dgat1, Fasn, Hsl) in BAT tissue of WT and FGRKO mice injected with saline or dexamethasone (10 mg/kg) for 6 hours.
Figure 4.
Figure 4.
Liver-specific KO of GR results in increased dexamethasone-mediated expression of genes involved in carbohydrate metabolism in kidney tissue. A–G, Real-time PCR analysis for determining the mRNA expression status of genes involved in gluconeogenesis (Pck1, Pcx, G6Pc, Pck2, Pdk4, Mpc1, Mpc2) in kidney tissue of WT and LGRKO mice injected with saline or dexamethasone (10 mg/kg) for 6 hours. H–L, Real-time PCR analysis for determining the mRNA expression status of genes involved in glycogen metabolism (Gys2, Pygl, Ppp1ca, Ppp1cb, Ppp1cc) in kidney tissue of WT and LGRKO mice injected with saline or dexamethasone (10 mg/kg) for 6 hours.
Figure 5.
Figure 5.
Deletion of GR in liver tissue alters insulin sensitivity, body composition, and glycogen content upon dexamethasone administration. A and B, GTT in WT, LGRKO, and FGRKO mice administered dexamethasone for 2 weeks, respectively. C and D, ITT in LGRKO and FGRKO mice administered dexamethasone for 2 weeks, respectively. Blue line indicates tissue-specific GRKO mice (LGRKO/FGRKO). Red line indicates WT mice. E, Body composition analysis by EchoMRI in WT, LGRKO mice at week 2 after dexamethasone administration. F and G, Body composition analysis by EchoMRI in WT, FGRKO mice at week 0 (before dexamethasone administration) and week 2 after dexamethasone administration, respectively. H and I, BMD, BMC analysis by DEXA in WT, FGRKO mice at week 0 and week 4 after dexamethasone administration, respectively. J, Liver TG content in WT, LGRKO mice administered saline or dexamethasone for 2 weeks. K, Liver glycogen content in WT, LGRKO mice administered saline or dexamethasone for 2 weeks. L, Kidney glycogen content in WT, LGRKO mice administered saline or dexamethasone for 2 weeks.
Figure 6.
Figure 6.
Tissue-specific deletion of GR does not alter the metabolic response of mice fed HFD. A and B, GTT in LGRKO and FGRKO mice fed HFD for 16 weeks, respectively. C and D, ITT in LGRKO and FGRKO mice fed HFD for 16 weeks, respectively. E, Body composition analysis by EchoMRI in WT, LGRKO mice after 16 weeks of HFD feeding, respectively. F, Body composition analysis by EchoMRI in WT, FGRKO mice after 16 weeks of HFD feeding, respectively. G, BMD, BMC analysis by DEXA in WT, LGRKO mice after 16 weeks of HFD feeding. H, BMD, BMC analysis by DEXA in WT, FGRKO mice after 16 weeks of HFD feeding. I, Liver TG content in WT, LGRKO mice after 16 weeks of HFD feeding. J, Liver TG content in WT, FGRKO mice after 16 weeks of HFD feeding. All values are given as mean ± SD.
Figure 6.
Figure 6.
Tissue-specific deletion of GR does not alter the metabolic response of mice fed HFD. A and B, GTT in LGRKO and FGRKO mice fed HFD for 16 weeks, respectively. C and D, ITT in LGRKO and FGRKO mice fed HFD for 16 weeks, respectively. E, Body composition analysis by EchoMRI in WT, LGRKO mice after 16 weeks of HFD feeding, respectively. F, Body composition analysis by EchoMRI in WT, FGRKO mice after 16 weeks of HFD feeding, respectively. G, BMD, BMC analysis by DEXA in WT, LGRKO mice after 16 weeks of HFD feeding. H, BMD, BMC analysis by DEXA in WT, FGRKO mice after 16 weeks of HFD feeding. I, Liver TG content in WT, LGRKO mice after 16 weeks of HFD feeding. J, Liver TG content in WT, FGRKO mice after 16 weeks of HFD feeding. All values are given as mean ± SD.
Figure 7.
Figure 7.
Schematic diagram showing the importance of liver GR in MS and renal compensation. A, 11β-HSD1 activates GC precursors (cortisone) into active hormone (cortisol) that acts locally in adipose tissue and also on the liver due to the portal venous drainage of visceral adipose tissue. Our data indicate that liver GR plays a greater role in development of MS as compared with adipose GR. B, Simplified schematic of gluconeogenesis and glycogen metabolism with the key genes highlighted in yellow. Our data indicate that in WT mice, dexamethasone activates gluconeogenic and glycogen metabolism-related genes in the liver and suppresses their expression in the kidney. On the other hand, we have observed that in LGRKO mice, dexamethasone represses gluconeogenic and glycogen metabolism-related genes in the liver and activates their expression in the kidney.

References

    1. Ford ES, Giles WH, Dietz WH. Prevalence of the metabolic syndrome among US adults: findings from the third National Health and Nutrition Examination Survey. JAMA. 2002;287(3):356–359. - PubMed
    1. Isomaa B, Almgren P, Tuomi T, et al. Cardiovascular morbidity and mortality associated with the metabolic syndrome. Diabetes Care. 2001;24(4):683–689. - PubMed
    1. Ramamoorthy S, Cidlowski JA. Exploring the molecular mechanisms of glucocorticoid receptor action from sensitivity to resistance. Endocr Dev. 2013;24:41–56. - PMC - PubMed
    1. Chrousos GP, Kino T. Glucocorticoid action networks and complex psychiatric and/or somatic disorders. Stress. 2007;10(2):213–219. - PubMed
    1. Greenberg AK, Hu J, Basu S, et al. Glucocorticoids inhibit lung cancer cell growth through both the extracellular signal-related kinase pathway and cell cycle regulators. Am J Respir Cell Mol Biol. 2002;27(3):320–328. - PubMed