. 2016 Oct;28(10):2464-2477.
doi: 10.1105/tpc.15.00569. Epub 2016 Oct 17.

A Model of Differential Growth-Guided Apical Hook Formation in Plants

Affiliations

A Model of Differential Growth-Guided Apical Hook Formation in Plants

Petra Žádníková et al. Plant Cell. 2016 Oct.

Abstract

Differential cell growth enables flexible organ bending in the presence of environmental signals such as light or gravity. A prominent example of the developmental processes based on differential cell growth is the formation of the apical hook that protects the fragile shoot apical meristem when it breaks through the soil during germination. Here, we combined in silico and in vivo approaches to identify a minimal mechanism producing auxin gradient-guided differential growth during the establishment of the apical hook in the model plant Arabidopsis thaliana Computer simulation models based on experimental data demonstrate that asymmetric expression of the PIN-FORMED auxin efflux carrier at the concave (inner) versus convex (outer) side of the hook suffices to establish an auxin maximum in the epidermis at the concave side of the apical hook. Furthermore, we propose a mechanism that translates this maximum into differential growth, and thus curvature, of the apical hook. Through a combination of experimental and in silico computational approaches, we have identified the individual contributions of differential cell elongation and proliferation to defining the apical hook and reveal the role of auxin-ethylene crosstalk in balancing these two processes.


Figures

Figure 1.
Figure 1.
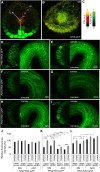
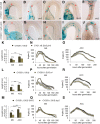
Auxin Accumulation in Epidermal Cells at the Concave Side of the Apical Hook. (A) Computational model predicting the establishment of the auxin maxima in the epidermal cells at the concave side of an apical hook. PIN1 is expressed in the vascular tissue (s) marked by a green asterisk (auxin source site), PIN3 in the endodermis (en), cortex (co), and partially in the epidermis (ep), PIN4 in the cortex and epidermis (ep), and PIN7 in the epidermis. The auxin content of the cells is color-coded in green; the cumulative PIN levels (PIN3, PIN4, and PIN7) are presented in red/yellow (heat map). Vector (Vc) points toward the center of the cell mass, while vector (Vg) is reference vector associated with the concave side of the hook. Angle between these two vectors is positively correlated with the PIN expression level in the cell. (B) Transverse section of the apical hook expressing the DR5rev:GFP reporter. The auxin response is detected in the epidermal cells at the concave side of the apical hook. Red arrows indicate zone of DR5rev:GFP-expressing epidermal cells. (C) Color coded map for PIN expression and auxin levels. (D) to (I) Expression of PIN:PIN-GFP reporters in the epidermis of apical hooks grown on either Murashige and Skoog medium (MS) ([D], [F], and [H]) or ethylene-supplemented medium ([E], [G], and [I]). Membrane PIN-GFP signal detected either at the transverse or longitudinal sections of the apical hook, respectively. Line-scan confocal microscopy and maximal projection of z-stack images used to acquire images. Insets: close-ups of epidermal cells at the convex and concave sides of the apical hook in which membrane PIN-GFP signal was quantified. (J) to (L) PIN-GFP signal quantified at the concave and convex sides of the apical hook epidermal cells in transverse and longitudinal sections of the apical hook, respectively. Significant differences determined by Student’s t test are indicated as *P < 0.05, **P < 0.001, and ***P < 0.0001; n = 10 seedlings, two and five cells analyzed on each side in transverse and longitudinal sections of the apical hook, respectively, at the early maintenance phase 26 h after germination. Error bars represent standard errors.
Figure 2.
Figure 2.
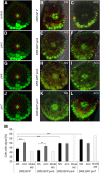
PIN-Controlled Auxin Distribution in Epidermal Cells of the Apical Hook. (A), (D), (G), and (J) Computational model predictions of the auxin distribution in untreated apical hooks of the wild type (A), pin3 (D), pin4 (G), and pin7 (J). (B), (C), (E), (F), (H), (I), and (K) to (M) DR5rev:GFP expression monitored on transverse sections of untreated ([B], [E], [H], and [K]) and ethylene-treated ([C], [F], [I], and [L]) apical hooks in the wild-type ([B] and [C]), pin3 ([E] and [F]), pin4 ([H] and [I]), and pin7 ([K] and [L]). In vivo versus in silico quantifications of the proportion of the DR5rev-positive epidermal cells in untreated and ethylene-treated wild-type, pin3, pin4, and pin7 mutant plants (M). Yellow and blue dots indicate cells with and without DR5rev-reporter signal, respectively. Arrows show boundaries of DR5rev signal. Significant differences determined by Student’s t test are indicated as **P < 0.001 and ***P < 0.0001 (n = 10 seedlings at the early maintenance phase, 26 h after germination). Transverse sections acquired by sectioning of fixed samples using vibrating microtome. Error bars represent standard errors.
Figure 3.
Figure 3.
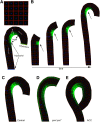
Dynamic Computer Model Suggests a Mechanism for Apical Hook Formation. (A) Computer-simulated formation of apical hooks started from the early developmental phase, represented by an initial block of cells (denoted as “seedling stage”). The longitudinal hook model was divided into three developmental zones corresponding to the hypocotyl, apical hook, and cotyledons. White arrows depict the preferential directionality of auxin flow from the source (green bar, cotyledons) to the sink (blue bar, basal end of hypocotyl) in the apical hook model. Cells associated with the apical hook zone display strong PIN expression on the convex (outer) side of the hook and weak PIN expression on the concave (inner) side of the hook as observed experimentally. (B) Time-lapse computer simulation of “wild-type-like” scenario shows consecutive stages of simulated apical hook formation. (C) to (E) Steady state auxin distribution in the simulated wild-type-like hooks (C), pin4 pin7 double mutant (D), and simulation integrating the extended zone of rapidly dividing cells (mimicking ethylene treatment, indicated as ACC precursor of ethylene) (E). Color coding for auxin and PIN levels are as in Figure 1C.
Figure 4.
Figure 4.
Reduced Cell Proliferation Interferes with Apical Hook Formation. (A) to (D) KN-GFP expression during apical hook formation in seedlings treated with MS (A), ACC (B) HU (C), and HU+ACC (D). Red arrows mark zone of KN-GFP expression. (E) Quantification of the length of the apical hook zone expressing KN-GFP. Significant differences determined by Student’s t test are indicated as ***P < 0.0001 (n = 10 seedlings at the early maintenance phase, 26 h after germination). (F) and (G) Apical hook development in wild-type seedlings treated with HU and ACC+HU (F) and cycA2;2 cycA2;3 cycA2;4 seedlings treated with MS and ACC (G) when compared with control (Col). Error bars represent standard errors.
Figure 5.
Figure 5.
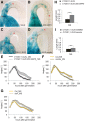
Promoted Cell Proliferation Leads to Apical Hook Exaggeration. (A) to (I) Size of the cell proliferation zones in the 35S:GRF5 line ([B], quantified in [H]) and its wild type (A) and the samba mutant ([D], quantified in [I]) and its wild type (C) as monitored with CYC1;1B:GUS. Significant differences determined by Student’s t test are indicated as ***P < 0.0001 (n = 10 seedlings at the early maintenance phase, 26 h after germination). Red arrows mark zone of CYC1;1B:GUS expression. (E) to (G) Kinetics of apical hook development shows exaggeration of the apical hook formation in 35S:GRF5 (E), samba (F), and dai1 (G) seedlings. Error bars represent standard errors.
Figure 6.
Figure 6.
Reduced Cell Proliferation in Auxin-Related Mutants. (A) to (M) Length of the cell proliferation zone in apical hooks of control ([A], [F], and [K]), pin3 ([B], [G], and [K]), slr ([C], [H], and [L]), SHY2-2 ([D], [I], and [M]), and shy2-2 ([E], [J], and [M]) monitored with CYC1;1B:GUS. Seedlings germinated on MS medium ([A] to [E]) and ACC-supplemented medium ([F] to [J]). Red arrows mark zone of CYC1;1B:GUS expression. Significant differences determined by Student’s t test are indicated as ***P < 0.0001 (n = 10 seedlings at the early maintenance phase, 26 h after germination). (N) to (S) Apical hook development in pin3 ([N] and [O]), slr ([P] and [R]), and shy2-2 ([Q] and [S]) on MS ([N], [P], and [Q]) and with ACC-supplemented ([O], [R], and [S]) medium. Error bars represent standard errors.
Figure 7.
Figure 7.
Asymmetric Cell Proliferation Pattern in the Apical Hook Correlates with Auxin Distribution. (A) to (C) Cell proliferation pattern in apical hooks grown on MS (A), ACC (B), and NPA (C) monitored with KN-GFP. (D) to (F) Auxin distribution pattern in apical hooks grown on MS (D), ACC (E), and NPA (F) monitored with DR5rev:GFP. Red arrows mark zone of GFP reporter expression. (G) The number of cells expressing KN-GFP at the concave versus the convex side of the apical hooks grown on MS, ACC, and NPA medium. Significant differences in the numbers of cells expressing KN-GFP at the concave when compared with convex side determined by Student’s t test (***P < 0.0001, n = 10 seedlings at the early maintenance phase 26 h after germination). (H) Length of the KN-GFP and DR5rev:GFP expression zone in apical hooks grown on MS, ACC, and NPA medium. Significant differences of the length of either the KN-GFP or DR5rev:GFP positive zone when compared with MS grown seedlings (n = 10 seedlings at the early maintenance phase 26 h after germination, Student’s t test ***P < 0.001). Yellow line represents the middle of the apical hook and divides the hook on the convex and concave side. Error bars represent standard errors.

References

    1. Abbas M., Alabadí D., Blázquez M.A. (2013). Differential growth at the apical hook: all roads lead to auxin. Front. Plant Sci. 4: 441. - PMC - PubMed
    1. Barbier de Reuille P., et al. (2015). MorphoGraphX: A platform for quantifying morphogenesis in 4D. eLife 4: 05864. - PMC - PubMed
    1. Blilou I., Xu J., Wildwater M., Willemsen V., Paponov I., Friml J., Heidstra R., Aida M., Palme K., Scheres B. (2005). The PIN auxin efflux facilitator network controls growth and patterning in Arabidopsis roots. Nature 433: 39–44. - PubMed
    1. Boerjan W., Cervera M.-T., Delarue M., Beeckman T., Dewitte W., Bellini C., Caboche M., Van Onckelen H., Van Montagu M., Inzé D. (1995). Superroot, a recessive mutation in Arabidopsis, confers auxin overproduction. Plant Cell 7: 1405–1419. - PMC - PubMed
    1. Boutté Y., Jonsson K., McFarlane H.E., Johnson E., Gendre D., Swarup R., Friml J., Samuels L., Robert S., Bhalerao R.P. (2013). ECHIDNA-mediated post-Golgi trafficking of auxin carriers for differential cell elongation. Proc. Natl. Acad. Sci. USA 110: 16259–16264. - PMC - PubMed

Publication types

MeSH terms

Substances

LinkOut - more resources