

Fast analytical approach of application specific dose efficient spectrum selection for diagnostic CT imaging and PET attenuation correction
- PMID: 27754977
- PMCID: PMC5266500
- DOI: 10.1088/0031-9155/61/21/7787
Fast analytical approach of application specific dose efficient spectrum selection for diagnostic CT imaging and PET attenuation correction
Abstract
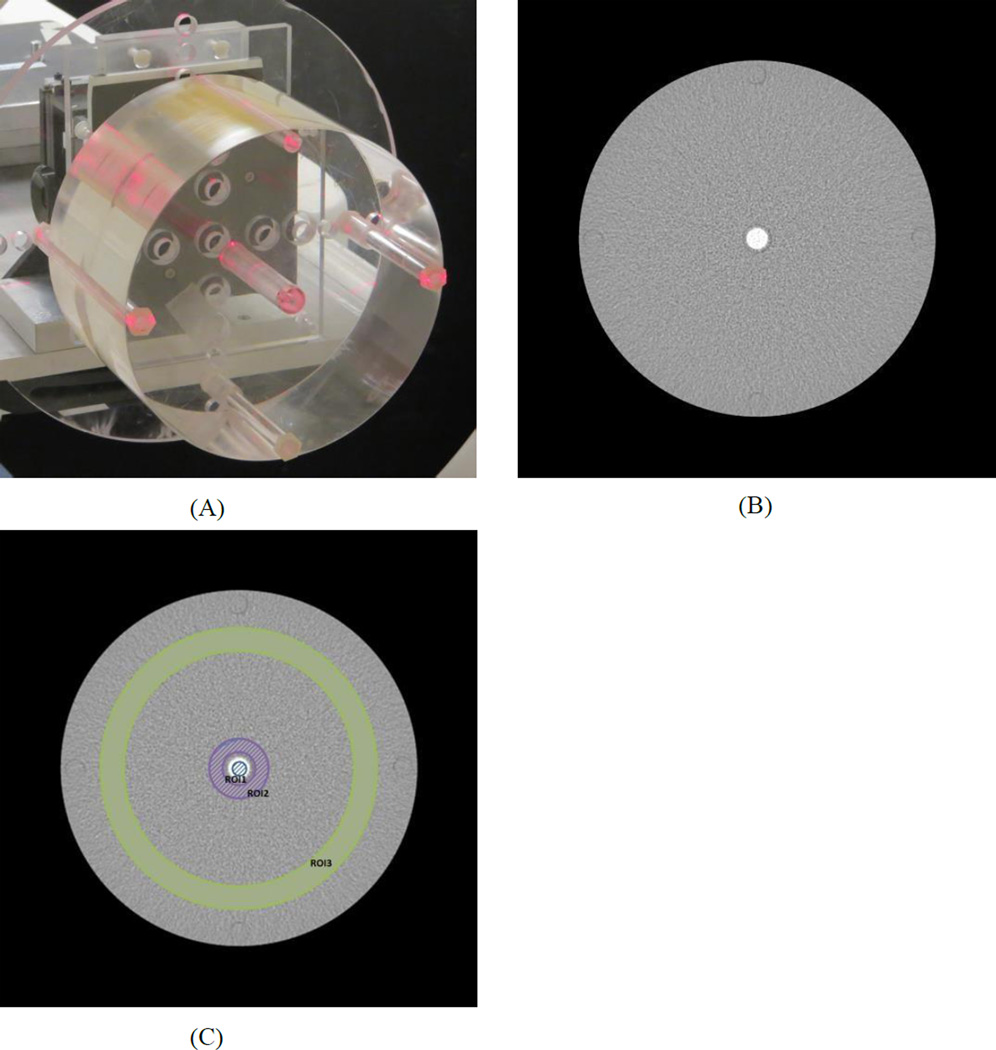
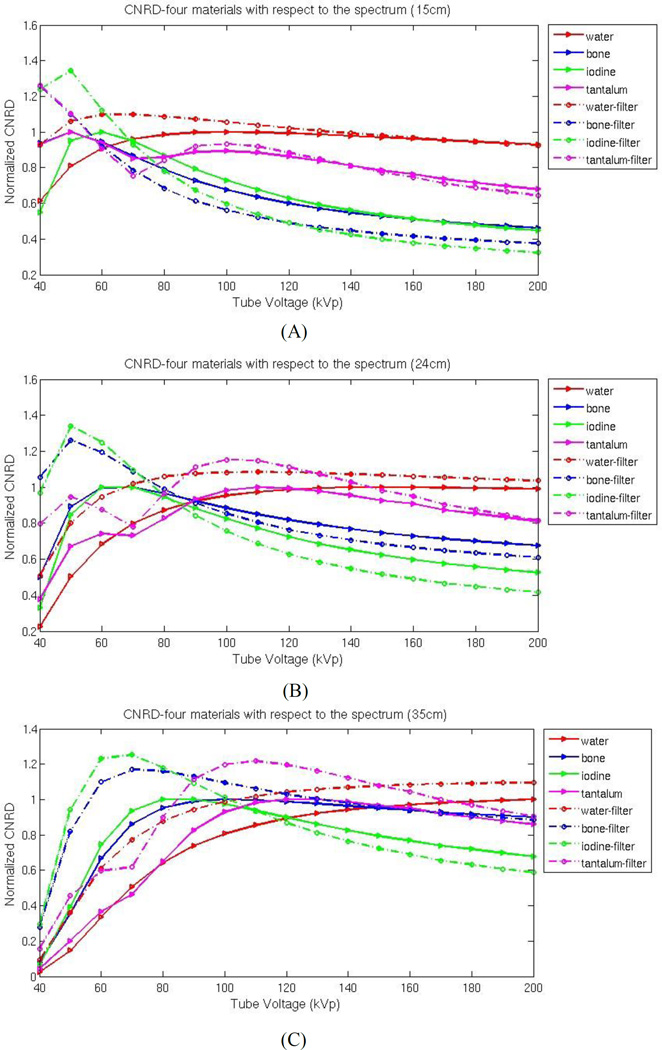
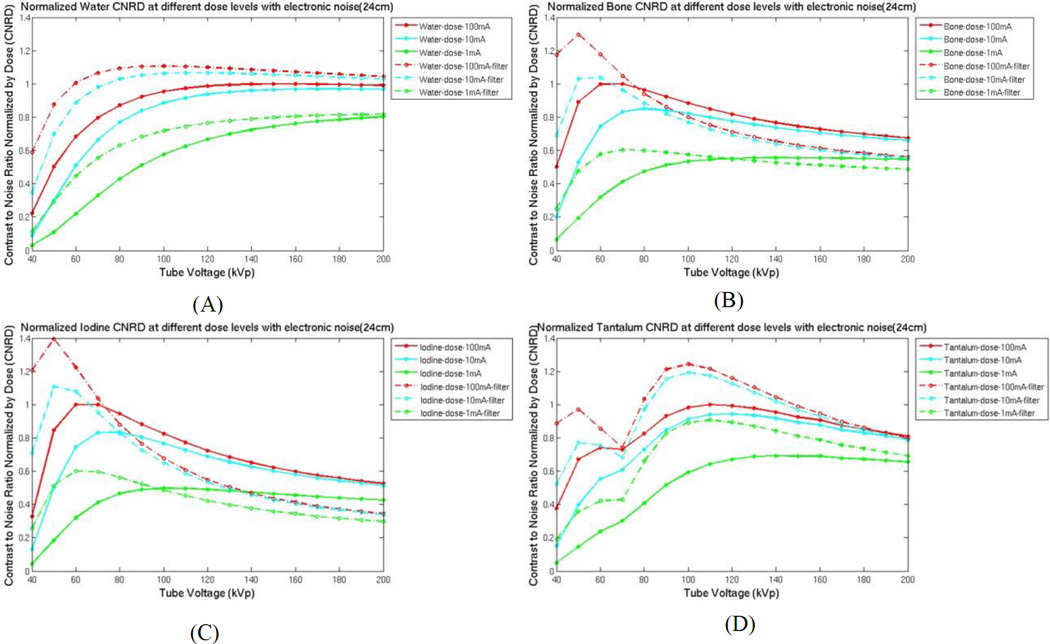
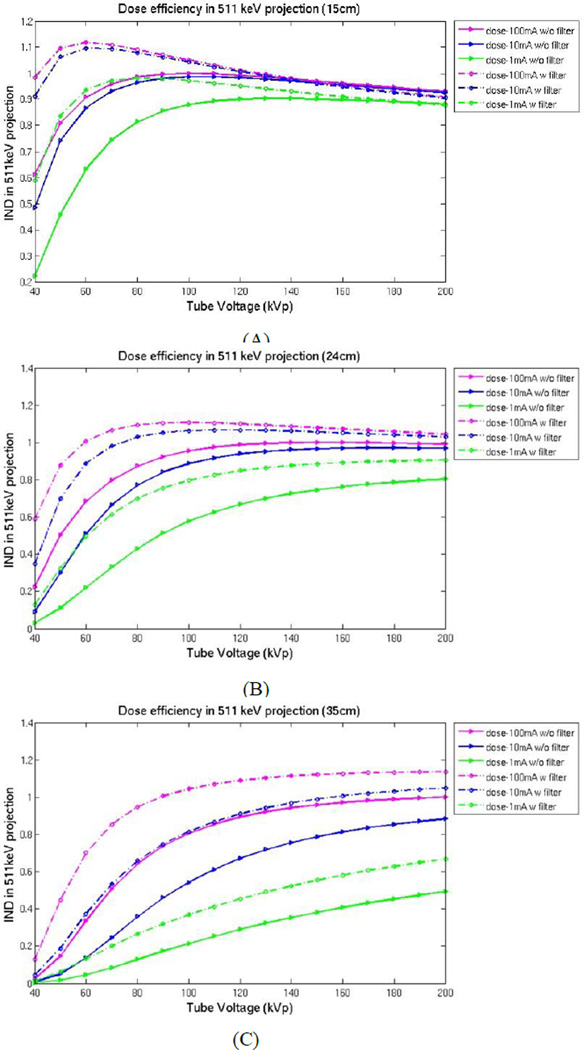
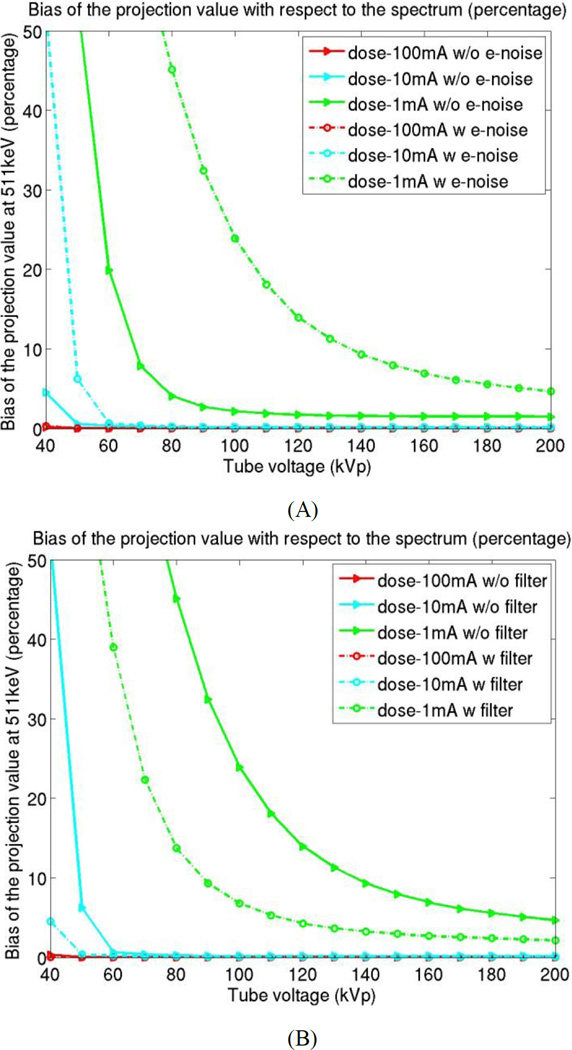
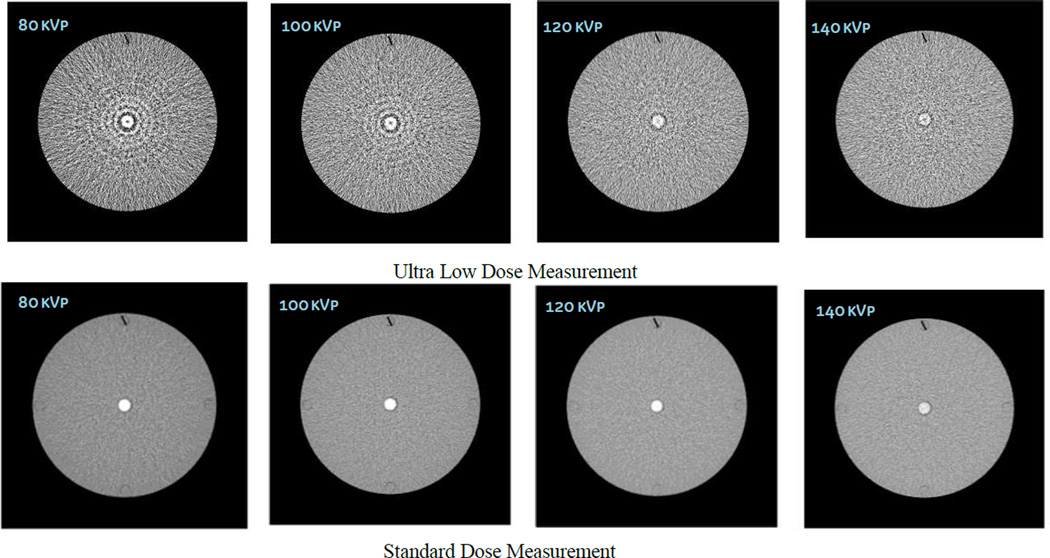
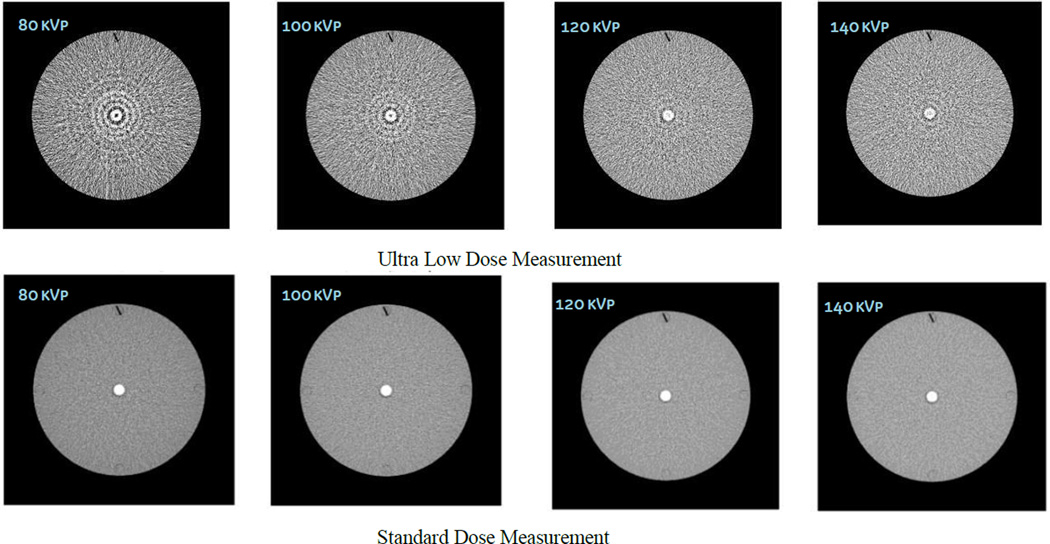
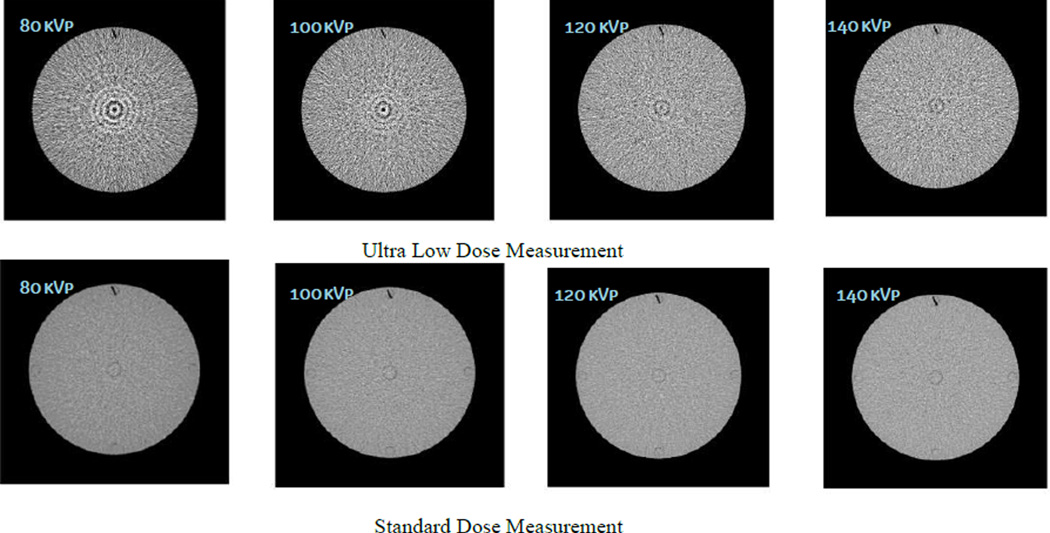
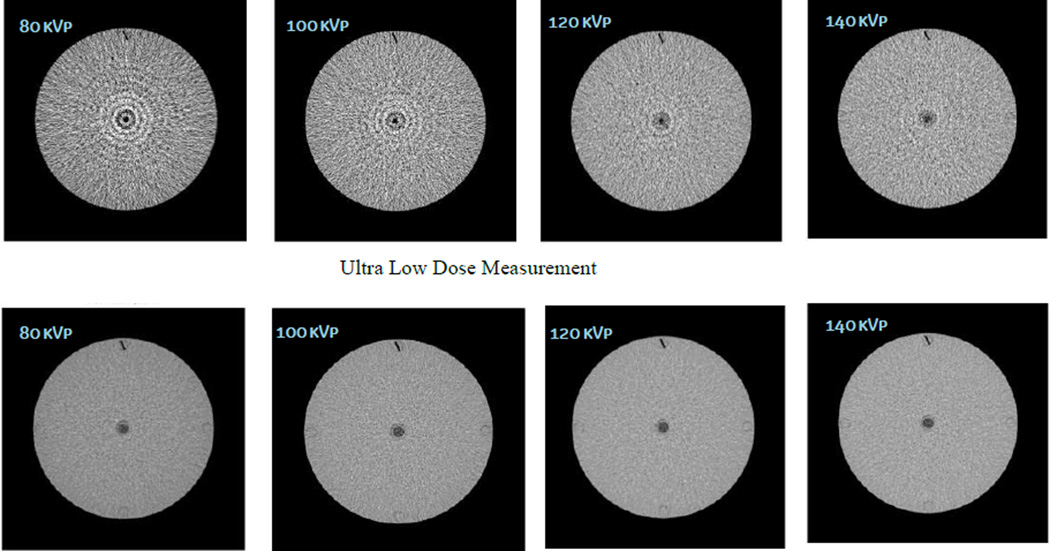
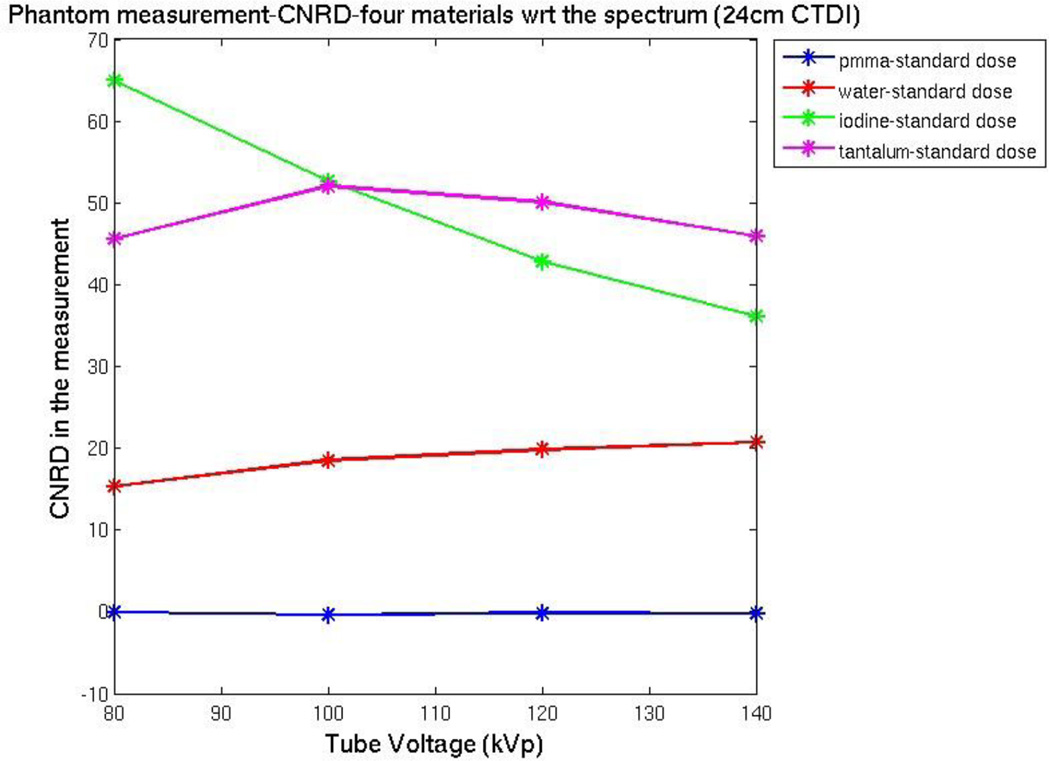
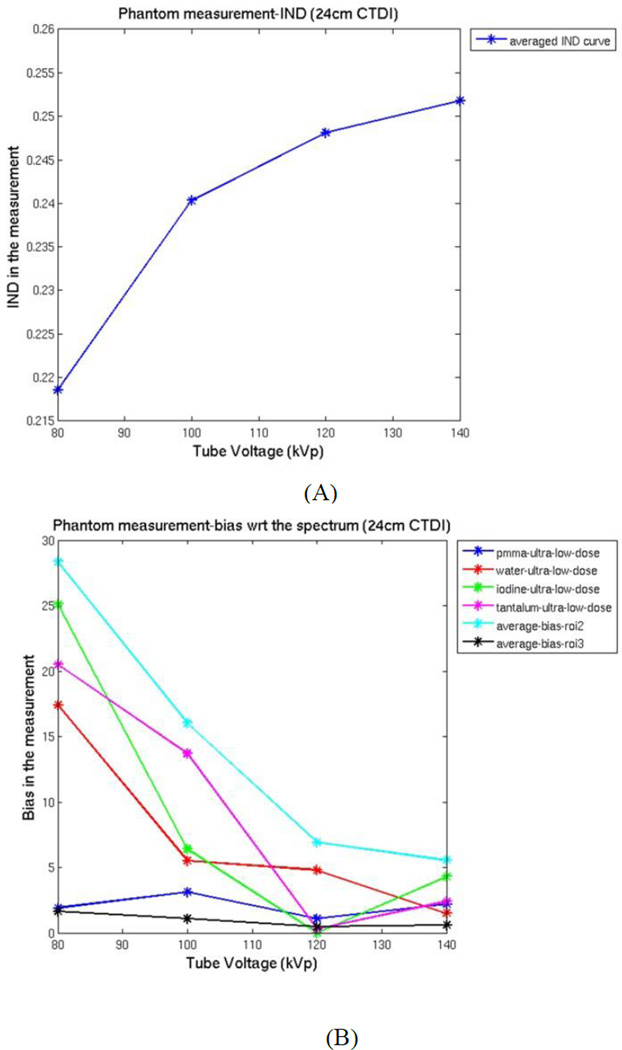
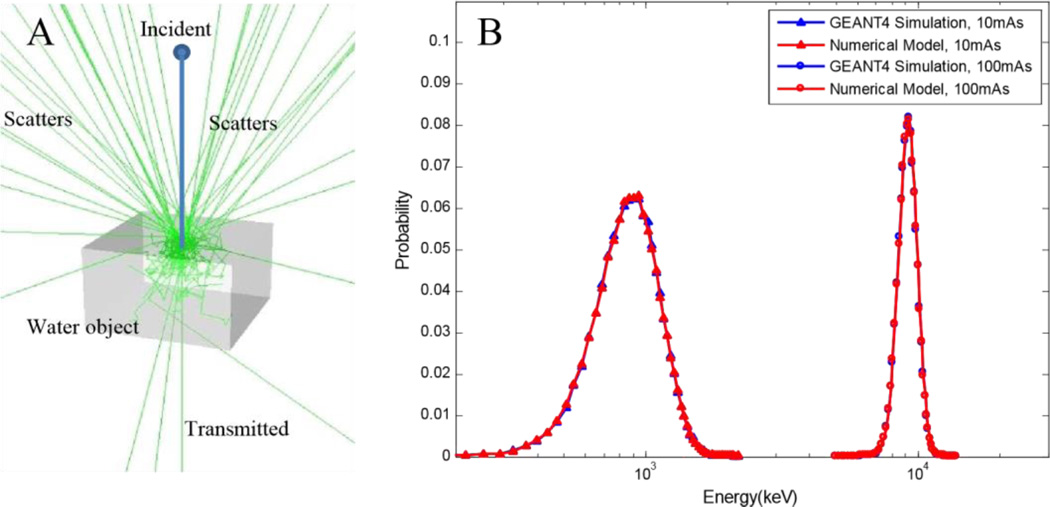
Computed tomography (CT) has been used for a variety of applications, two of which include diagnostic imaging and attenuation correction for PET or SPECT imaging. Ideally, the x-ray tube spectrum should be optimized for the specific application to minimize the patient radiation dose while still providing the necessary information. In this study, we proposed a projection-based analytic approach for the analysis of contrast, noise, and bias. Dose normalized contrast to noise ratio (CNRD), inverse noise normalized by dose (IND) and bias are used as evaluation metrics to determine the optimal x-ray spectrum. Our simulation investigated the dose efficiency of the x-ray spectrum ranging from 40 kVp to 200 kVp. Water cylinders with diameters of 15 cm, 24 cm, and 35 cm were used in the simulation to cover a variety of patient sizes. The effects of electronic noise and pre-patient copper filtration were also evaluated. A customized 24 cm CTDI-like phantom with 13 mm diameter inserts filled with iodine (10 mg ml-1), tantalum (10 mg ml-1), water, and PMMA was measured with both standard (1.5 mGy) and ultra-low (0.2 mGy) dose to verify the simulation results at tube voltages of 80, 100, 120, and 140 kVp. For contrast-enhanced diagnostic imaging, the simulation results indicated that for high dose without filtration, the optimal kVp for water contrast is approximately 100 kVp for a 15 cm water cylinder. However, the 60 kVp spectrum produces the highest CNRD for bone and iodine. The optimal kVp for tantalum has two selections: approximately 50 and 100 kVp. The kVp that maximizes CNRD increases when the object size increases. The trend in the CTDI phantom measurements agrees with the simulation results, which also agrees with previous studies. Copper filtration improved the dose efficiency for water and tantalum, but reduced the iodine and bone dose efficiency in a clinically-relevant range (70-140 kVp). Our study also shows that for CT-based attenuation correction applications for PET or SPECT, a higher-kVp spectrum with copper filtration is preferable. This method is developed based on filter back projection and does not require image reconstruction or Monte Carlo dose estimates; thus, it could potentially be used for patient-specific and task-based on-the-fly protocol optimization.
Figures
Similar articles
-
Dual energy CT for attenuation correction with PET/CT.Med Phys. 2014 Jan;41(1):012501. doi: 10.1118/1.4828838. Med Phys. 2014. PMID: 24387525 Free PMC article.
-
Dose optimization in pediatric cardiac x-ray imaging.Med Phys. 2010 Oct;37(10):5258-69. doi: 10.1118/1.3488911. Med Phys. 2010. PMID: 21089760
-
Spectral optimization for micro-CT.Med Phys. 2012 Jun;39(6):3229-39. doi: 10.1118/1.4718575. Med Phys. 2012. PMID: 22755706
-
Radiation Dose Modulation of Computed Tomography Component in Positron Emission Tomography/Computed Tomography.Semin Nucl Med. 2022 Mar;52(2):157-166. doi: 10.1053/j.semnuclmed.2021.11.009. Epub 2021 Dec 7. Semin Nucl Med. 2022. PMID: 34887083 Review.
-
[A Review of Current Knowledge for X-ray Energy in CT: Practical Guide for CT Technologist].Nihon Hoshasen Gijutsu Gakkai Zasshi. 2022 May 20;78(5):449-463. doi: 10.6009/jjrt.2022-1238. Epub 2022 Apr 11. Nihon Hoshasen Gijutsu Gakkai Zasshi. 2022. PMID: 35400711 Review. Japanese.
Cited by
-
Ultra-low-dose CT for attenuation correction: dose savings and effect on PET quantification for protocols with and without tin filter.EJNMMI Phys. 2023 Oct 20;10(1):66. doi: 10.1186/s40658-023-00585-0. EJNMMI Phys. 2023. PMID: 37861887 Free PMC article.
References
-
- Agostinelli S, Allison J, Amako KA, Apostolakis J, Araujo H, Arce P, Asai M, Axen D, Banerjee S, Barrand G, Behner F. Geant4—a simulation toolkit. Nuclear instruments and methods in physics research section. A. Accelerators, Spectrometers, Detectors and Associated Equipment. 2003;506(3):250–303.
-
- Ay MR, Mehranian A, Maleki A, Ghadiri H, Ghafarian P, Zaidi H. Experimental assessment of the influence of beam hardening filters on image quality and patient dose in volumetric 64-slice X-ray CT scanners. Physica Medica. 2013;29(3):249–260. - PubMed
-
- Bonitatibus PJ, Torres AS, Goddard GD, FitzGerald PF, Kulkarni AM. Synthesis, characterization, and computed tomography imaging of a tantalum oxide nanoparticle imaging agent. Chem. Commun. 2010;46:8956–8958. Online: http://www.ncbi.nlm.nih.gov/pubmed/20976321. - PubMed
-
- Bonitatibus PJ, Torres AS, Kandapallil B, Lee BD, Goddard GD, Colborn RE, Marino ME. Preclinical assessment of a zwitterionic tantalum oxide nanoparticle X-ray contrast agent. ACS Nano. 2012;6:6650–6658. - PubMed
-
- Boone JM, Geraghty EM, Seibert JA, Wootton-Gorges SL. Dose reduction in pediatric CT a rational approach. Radiology. 2003;228:352–360. - PubMed
MeSH terms
Grants and funding
LinkOut - more resources
Full Text Sources
Other Literature Sources
Medical