. 2016 Oct 18;11(10):e0163308.
doi: 10.1371/journal.pone.0163308. eCollection 2016.

Single Channel Recordings Reveal Differential β2 Subunit Modulations Between Mammalian and Drosophila BKCa(β2) Channels

Affiliations

Single Channel Recordings Reveal Differential β2 Subunit Modulations Between Mammalian and Drosophila BKCa(β2) Channels

Zhenzhen Yan et al. PLoS One. .

Abstract

Large-conductance Ca2+- and voltage-activated potassium (BK) channels are widely expressed in tissues. As a voltage and calcium sensor, BK channels play significant roles in regulating the action potential frequency, neurotransmitter release, and smooth muscle contraction. After associating with the auxiliary β2 subunit, mammalian BK(β2) channels (mouse or human Slo1/β2) exhibit enhanced activation and complete inactivation. However, how the β2 subunit modulates the Drosophila Slo1 channel remains elusive. In this study, by comparing the different functional effects on heterogeneous BK(β2) channel, we found that Drosophila Slo1/β2 channel exhibits "paralyzed"-like and incomplete inactivation as well as slow activation. Further, we determined three different modulations between mammalian and Drosophila BK(β2) channels: 1) dSlo1/β2 doesn't have complete inactivation. 2) β2(K33,R34,K35) delays the dSlo1/Δ3-β2 channel activation. 3) dSlo1/β2 channel has enhanced pre-inactivation than mSlo1/β2 channel. The results in our study provide insights into the different modulations of β2 subunit between mammalian and Drosophila Slo1/β2 channels and structural basis underlie the activation and pre-inactivation of other BK(β) complexes.


Conflict of interest statement

The authors have declared that no competing interests exist.

Figures
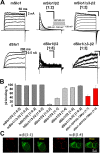
Fig 1
Fig 1. dSlo1/β2 channel doesn’t have complete inactivation.
(A) Macroscopic currents of mSlo1, mSlo1/β2, mSlo1/Δ3-β2, dSlo1, dSlo1/β2, and dSlo1/Δ3-β2 obtained from inside-out patches in the presence of 10 μM Ca2+ according to the protocol indicated. Scale bars represent 50 ms and 2 nA for mSlo1/x channels, and 200 ms and 0.5 nA for dSlo1/x channels. The α:β transfection ratio was 1:8 for dSlo1/ β2, and 1:0.2 for other combinations. The voltage ranges of the test potential were from -160 mV to +160 mV for mSlo1, mSlo1/β2, and mSlo1/Δ3-β2, and from -160 mV to 140 mV for dSlo1, dSlo1/β2 and dSlo1/Δ3-β2. (B) β2 binding percentages of a series of α/β2 channels at different α:β transfection ratios. Gray bars were obtained from patch clamp recordings and the red bars from immunofluorescence imaging. The mSlo1/β2 channel currents were analyzed based on patches with entire inactivation, mSlo1/Δ3-β2 based on the G-V relationship left shift, dSlo1/β2 based on inactivation or briefly opening recordings, and dSlo1/Δ3-β2 based on slow activation. dSlo1-GFP/β2-72Myc at [1:1] (N = 60) and at [1:4] (N = 61) were analyzed based on surface immunofluorescence images of β2-72Myc and then normalized against the dSlo1/β2 [1:4] results obtained from patch clamp recordings. The error bars represent the standard error of the mean (SEM). (C) Immunofluorescence imaging of dSlo1-GFP/β2-72Myc at different α:β transfection ratios of 1:1 (left) and 1:4 (right). Scale bar represents 10 μm.
Fig 2
Fig 2. Single channel recordings of mSlo1 and dSlo1 combinations with β2 subunit.
(A) Representative single channel recordings of mSlo1, mSlo1/β2, and dSlo1 channels from inside-out patches in the presence of 10 μM Ca2+ using a depolarizing voltage of 100 mV, as indicated in (B). The scale bars were 100 ms and 25 pA, respectively. (B) Representative single channel recordings of the dSlo1/β2 channel before (top) and after (bottom) applying 0.2 mg/ml trypsin. The bottom black traces are ensemble averages from 100 consecutive sweeps and its enlarged trace. Red traces are single exponential fits to the black traces. The inactivation τi and activation time τa constants were 166.2 ms and 120.8 ms, respectively. The α:β transfection ratio was 1:8. The scale bars were shown as indicated. (C) Representative single channel recordings of the dSlo1/Δ3-β2 channel before (top) and after (bottom) applying 0.2 mg/ml trypsin. The bottom black traces are ensemble averages from 100 consecutive sweeps. Red traces are single exponential fits to the black traces. The activation time constants τa were 1446.3 ms and 168.1 ms, respectively. The α:β transfection ratio was 1:8. The scale bars were 100 ms and 25 pA as shown in (B).
Fig 3
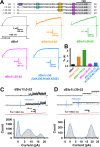
Fig 3. β2(K33,R34,K35) caused slow activation in dSlo1/Δ3-β2 channel.
(A) Top panel was the construct for β2 subunit truncations Δ3-β2, Δ30-β2, and Δ35-β2. Bottom panel showed the traces recorded at 100 mV in 10 μM Ca2+ solution for dSlo1 (black), dSlo1/Δ3-β2 (orange), dSlo1/Δ30-β2 (dark green), dSlo1/Δ35-β2 (pink), and dSlo1/Δ30-β2(K33,R34,K35) (light blue). (B) Average activation time constants (τa) for dSlo1 (68.55 ± 6.65 ms), dSlo1/Δ3-β2 (288.05 ± 74.01 ms), dSlo1/Δ30-β2 (623.37 ± 74.18 ms), dSlo1/Δ35-β2 (92.48 ± 25.88 ms), and dSlo1/Δ30-β2(K33,R34,K35) (127.92 ± 26.22 ms). Traces were fitted with a single exponential equation. (C–D) Single channel recordings and current histograms for the dSlo1/Δ3-β2 and dSlo1/Δ30-β2 channels. The currents between the blue lines were the raw data used for histogram analysis and the histogram were fitted with triple or double Gaussian equations.
Fig 4
Fig 4. Single channel recordings revealed the enhanced pre-inactivation in dSlo1/β2 channel.
(A) Representative single channel recordings of mSlo1/β2 from inside-out patches in the presence of 10 μM Ca2+ using a depolarizing voltage of 100 mV as indicated. The scale bars were 100 ms and 25 pA, respectively. (B-C) Three representative single-channel traces of mSlo1/β2(W4E) and mSlo1/β2(W4E,D16R,E17K) recorded from inside-out patches at +100 mV in 10 μM Ca2+. Bottom traces showed ensemble averages of 100 consecutive sweeps. Initial capacitive currents within the first 0.5 ms of voltage steps were deleted. Right, histogram of open-time durations from the two single-channel recordings. (D-E) Three representative single-channel traces of dSlo1/β2 and dSlo1/β2(D16R,E17K) recorded from inside-out patches at +100 mV in 10 μM Ca2+. Bottom traces showed ensemble averages of 100 consecutive sweeps. Right, histogram of open-time durations from the two single-channel recordings. (F) Immunofluorescence imaging of dSlo1-GFP/β2(D16R,E17K)-72Myc at different α:β transfection ratios of 1:4.
Fig 5
Fig 5. Cartoon schematic to clarify the different modulations of β2 subunit between mammalian and Drosophila BKCa(β2) channels.
Gray and orange bars indicated dSlo1 or mSlo1 and β2 subunit, respectively. Blue, orange, and pink circles indicated the α and β2 binding or interactions, β2(K33,R34,K35), and β2(D16,E17) or pre-inactivation, respectively. The black circle indicated the enhanced pre-inactivation in dSlo1/β2 channel. Firstly, in dSlo1/β2 channel, the inactivation ball FIW is not enough for the complete inactivation, and may suppress the α and β2 binding or interactions. Secondly, β2(K33,R34,K35) delays the pore opening (or voltage sensor movement). Thirdly, dSlo1/β2 channel has enhanced pre-inactivation than mSlo1/β2 channel.

Similar articles

Cited by

References

    1. McManus OB, Magleby KL. Accounting for the Ca(2+)-dependent kinetics of single large-conductance Ca(2+)-activated K+ channels in rat skeletal muscle. The Journal of physiology 1991, 443: 739–777 - PMC - PubMed
    1. Schreiber M, Salkoff L. A novel calcium-sensing domain in the BK channel. Biophysical journal 1997, 73: 1355–1363 10.1016/S0006-3495(97)78168-2 - DOI - PMC - PubMed
    1. Brayden JE, Nelson MT. Regulation of arterial tone by activation of calcium-dependent potassium channels. Science 1992, 256: 532–535 - PubMed
    1. Fuchs PA, Murrow BW. Cholinergic inhibition of short (outer) hair cells of the chick's cochlea. The Journal of neuroscience: the official journal of the Society for Neuroscience 1992, 12: 800–809 - PMC - PubMed
    1. Petersen OH, Maruyama Y. Calcium-activated potassium channels and their role in secretion. Nature 1984, 307: 693–696 - PubMed

MeSH terms

Substances

LinkOut - more resources