. 2016 Oct 18;11(10):e0164579.
doi: 10.1371/journal.pone.0164579. eCollection 2016.

Bmi1 Loss in the Organ of Corti Results in p16ink4a Upregulation and Reduced Cell Proliferation of Otic Progenitors In Vitro

Affiliations

Bmi1 Loss in the Organ of Corti Results in p16ink4a Upregulation and Reduced Cell Proliferation of Otic Progenitors In Vitro

Mohamed Bassiouni et al. PLoS One. .

Abstract

The mature mammalian organ of Corti does not regenerate spontaneously after injury, mainly due to the absence of cell proliferation and the depletion of otic progenitors with age. The polycomb gene B lymphoma Mo-MLV insertion region 1 homolog (Bmi1) promotes proliferation and cell cycle progression in several stem cell populations. The cell cycle inhibitor p16ink4a has been previously identified as a downstream target of Bmi1. In this study, we show that Bmi1 is expressed in the developing inner ear. In the organ of Corti, Bmi1 expression is temporally regulated during embryonic and postnatal development. In contrast, p16ink4a expression is not detectable during the same period. Bmi1-deficient mice were used to investigate the role of Bmi1 in cochlear development and otosphere generation. In the absence of Bmi1, the postnatal organ of Corti displayed normal morphology at least until the end of the first postnatal week, suggesting that Bmi1 is not required for the embryonic or early postnatal development of the organ of Corti. However, Bmi1 loss resulted in the reduced sphere-forming capacity of the organ of Corti, accompanied by the decreased cell proliferation of otic progenitors in otosphere cultures. This reduced proliferative capacity was associated with the upregulation of p16ink4a in vitro. Viral vector-mediated overexpression of p16ink4a in wildtype otosphere cultures significantly reduced the number of generated otospheres in vitro. The findings strongly suggest a role for Bmi1 as a promoter of cell proliferation in otic progenitor cells, potentially through the repression of p16ink4a.


Conflict of interest statement

The authors have declared that no competing interests exist.

Figures
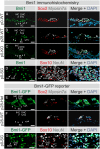
Fig 1
Fig 1. Bmi1 expression in the cochlear sensory epithelium.
(A, B, and D) Immunohistochemical staining was performed using an anti-Bmi1 antibody on wildtype mice (Bmi1WT/WT, referred to as WT). (E and G) Alternatively, immunolabeling was performed using an anti-GFP antibody on Bmi1-GFP heterozygous mice (Bmi1GFP/WT, referred to as Het). OC sections (A-C, E and F) were co-stained for Sox2 (red) and Myosin7a (white) as markers of supporting cells and hair cells, respectively. Hair cells are marked by hollow white arrows, and supporting cells are indicated by solid white arrows. Spiral ganglion sections (D and G) were co-labeled with Sox10 (red) and NeuN (white) to serve as markers of glial and neuronal cells, respectively. Spiral ganglion neurons are labeled with hollow white arrowheads, and glial cells are marked with solid white arrowheads. (A) Bmi1 is expressed in the immature OC at p0. Both hair cells and supporting cells were labeled for Bmi1. (B) Bmi1 expression was detected in hair and supporting cells of the functionally mature OC at p28. (C) Cochleae of homozygous Bmi1-GFP mice (Bmi1GFP/GFP, referred to as KO) served as a negative control for Bmi1 immunohistochemistry. (D and G) Bmi1 expression co-localized with the neuronal marker NeuN in spiral ganglion neurons. Sox10-positive glial cells did not show Bmi1 expression. (E) Bmi1-GFP signal was observed in hair and supporting cells of the OC at p28. (F) Cochleae of WT mice served as a negative control for the Bmi1-GFP signal. Nuclei were labeled with DAPI in all sections. Solid white arrows indicate supporting cells, while hollow arrows point to inner and outer hair cells. IHC: inner hair cells, OHC: outer hair cells, SC: supporting cells, SG: spiral ganglion, SGN: spiral ganglion neurons. WT: wildtype, Het: heterozygous, KO: knockout. Scale: 20 μm.
Fig 2
Fig 2. Quantitative analysis of the temporal Bmi1 expression pattern in the cochlear sensory epithelium during development.
Bmi1 mRNA levels in the cochlear sensory epithelium at seven developmental stages: E13.5, p0, p4, p7, p14, p21 and p28. Bmi1 transcripts were detected in the sensory epithelium at all stages. All values were normalized to the p0 level. Bmi1 mRNA levels significantly increased between E13.5 and p0. Subsequently, Bmi1 mRNA was significantly downregulated between p0 and p7, which was followed by a statistically significant upregulation at p21 and p28. n.s.: not significant. *p<0.05, ***p<0.001.
Fig 3
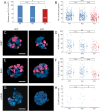
Fig 3. Sphere-forming capacity of the neonatal Bmi1 knockout organ of Corti.
(A) Average number of spheres per OC, expressed as a percentage of the WT control (mean ± standard deviation). The data represent the results from a total of 9 WT, 19 Het and 6 KO p0 mice pooled from 4 independent experiments. Cultures from the KO mice generated significantly fewer spheres compared to their WT littermates (one-way ANOVA followed by Tukey‘s post-hoc test, p<0.05). The difference between the WT and Het mice is not significant. (B, D, F and H) Quantification of DAPI, Ki67, EdU and pHH3. Each data point represents one sphere. Mean and standard deviation values are shown in the dot plots. (B) Number of DAPI-labeled cells per sphere. The number of cells per sphere is significantly reduced for the Bmi1 KO spheres compared to the WT spheres (p<0.001, Dwass-Steel test; n = 300 spheres per group). The difference between WT and Het mice is not statistically significant. (C, E and G) Representative images of the WT and KO spheres, labeled for Ki67 (C), EdU (E) and pHH3 (G). (D) Percentage of Ki67-positive cells in the spheres: the KO spheres harbor a significantly lower percentage of Ki67-positive cells compared with the WT spheres (p<0.01, Dwass-Steel; n = 100 spheres per group). There was no significant difference between the WT and Het mice, or between Het and KO mice. (F) Percentage of EdU-incorporating cells in the spheres: the KO spheres contain a significantly lower percentage of EdU-positive cells compared with the WT spheres and Het spheres (p<0.001, Dwass-Steel test; n = 100 spheres per group). The difference between the WT and Het mice is not significant. (H) Percentage of pHH3-positive cells in the spheres: the percentage of pHH3-expressing cells is significantly lower in the KO spheres compared with the WT spheres (p<0.05, Dwass-Steel test; n = 100 spheres per group). There was no statistically significant difference between the WT and Het spheres. WT: wildtype, Het: heterozygous, KO: knockout. *p<0.05, **p<0.01, ***p<0.001.
Fig 4
Fig 4. Phenotype of the early postnatal Bmi1 knockout organ of Corti.
(A and B) Sections of the cochleae of WT (A) and KO (B) mice at p0, immunolabeled with Myosin7a (green) and Sox2 (red) and counterstained with DAPI (blue). Hollow white arrows mark inner and outer hair cells. Solid white arrows label supporting cells. Immunohistochemical analysis shows normal development of the Bmi1 KO OC, as determined by the expression of the hair cell marker Myosin7a and the supporting cell marker Sox2. (C and D) Surface views of the OC of WT (C) and KO (D) mice at p7, stained with phalloidin, which labels stereocilia, and Myosin7a, a hair cell marker. Nuclei were labeled with DAPI. Immunohistochemical analysis shows normal development of the Bmi1 KO OC. Both WT and KO mice possess three rows of outer hair cells (O1, O2 and O3) and one row of inner hair cells. Neither WT nor KO OC show disorganized structure or stereocilia abnormalities at p7. WT: wildtype, KO: knockout, IHC: inner hair cells, OHC: outer hair cells, SC: supporting cells. Scale: 20 μm.
Fig 5
Fig 5. Gene expression changes in the Bmi1 knockout organ of Corti and otospheres.
(A) Representative high-magnification images of Bmi1 WT and KO spheres after 5DIV, stained for Bmi1 (green) and counterstained with DAPI (blue). Nuclear Bmi1 signal was detected in the WT, but not the KO, spheres. (B) Quantitative analysis of Bmi1 mRNA levels in the WT, Het and KO spheres by qRT-PCR. The Het spheres showed Bmi1 mRNA levels that are 0.59-fold relative to the WT spheres. Limited amounts of mRNA were detected in the KO spheres, representing 0.07-fold compared with the WT control. (C) Quantitative analysis of Bmi1 transcript levels in the neonatal WT, Het and KO OC by qRT-PCR. When normalized to the WT control, the Bmi1 mRNA levels in the Het OC were 0.67-fold of the WT level. In the KO OC, the level of mRNA detected was 0.06-fold of the WT expression level. (D) Quantitative analysis of p16ink4a transcript levels in the WT, Het and KO spheres by qRT-PCR. In the Het spheres, p16ink4a is upregulated 1.82-fold relative to the WT spheres. The KO spheres show an 18.38-fold upregulation of p16ink4a compared to the WT spheres. In the neonatal KO OC, only scarce amounts of p16ink4a mRNA were detected, representing 0.05-fold compared to the WT spheres. WT: wildtype, Het: heterozygous, KO: knockout. n.s.: not significant. ***p<0.001.
Fig 6
Fig 6. Effect of viral vector-mediated p16ink4a overexpression on the sphere-forming capacity of the organ of Corti.
(A) Quantitative analysis of p16ink4a mRNA levels in otospheres, derived from wildtype organ of Corti specimens after 5 days in vitro. The organ of Corti-derived cells were incubated with either of two viral vectors: i) Ad-GFP to induce the expression of GFP, or Ad-p16-GFP to induce the expression of both GFP and p16ink4a. The spheres incubated with Ad-p16-GFP showed a 765-fold increase in p16ink4a mRNA levels compared to the spheres incubated with Ad-GFP (n = 2 independent samples, measured in triplicate, for both groups). The difference in p16ink4a mRNA levels between the Ad-GFP and Ad-p16-GFP groups was highly statistically significant (Student’s t-test, p<0.001). (B) Average number of spheres generated after 5 days in vitro per 50000 cells plated (mean ± standard deviation). Cells incubated with Ad-p16-GFP generated significantly fewer spheres, after 5 days in vitro, compared to the cells incubated with Ad-GFP (N = 3 independent experiments, n = 5 replicates per experiment, Student’s t-test, p<0.001). ***p<0.001.
Fig 7
Fig 7. The mechanism of cell cycle regulation via the Bmi1/p16ink4a pathway.
Bmi1 represses p16ink4a, which in turn inhibits cyclin-dependent kinases 4/6 (CDK4/6) from binding to cyclin D. CDK4/6-cyclin D complexes are required for the phosphorylation of the retinoblastoma (Rb) family of proteins. In the absence of CDK4/6-cyclin D complexes, Rb remain in their inactive hypophosphorylated form. After phosphorylation, Rb release the elongation factor 2 (E2F) group of transcription factors. E2F activate the transcription of various genes that are required for progression from the G1-phase of the cell cycle, through the restriction point and into the S-phase. After passing the restriction point, the cell becomes committed to the cell cycle even in the absence of external proliferation stimuli. Figure adapted from [48].

Similar articles

Cited by

References

    1. Warchol ME. Sensory regeneration in the vertebrate inner ear: differences at the levels of cells and species. Hear Res. 2011;273(1–2):72–9. 10.1016/j.heares.2010.05.004 . - DOI - PubMed
    1. Roberson DW, Rubel EW. Cell division in the gerbil cochlea after acoustic trauma. Am J Otol. 1994;15(1):28–34. . - PubMed
    1. Yamasoba T, Kondo K, Miyajima C, Suzuki M. Changes in cell proliferation in rat and guinea pig cochlea after aminoglycoside-induced damage. Neurosci Lett. 2003;347(3):171–4. . - PubMed
    1. Oshima K, Grimm CM, Corrales CE, Senn P, Martinez Monedero R, Geleoc GS, et al. Differential distribution of stem cells in the auditory and vestibular organs of the inner ear. J Assoc Res Otolaryngol. 2007;8(1):18–31. 10.1007/s10162-006-0058-3 - DOI - PMC - PubMed
    1. Ruben RJ. Development of the inner ear of the mouse: a radioautographic study of terminal mitoses. Acta Otolaryngol. 1967:Suppl 220:1–44. . - PubMed

MeSH terms

Substances