

Triangular Monometallic Cyanide Cluster Entrapped in Carbon Cage with Geometry-Dependent Molecular Magnetism
- PMID: 27755875
- PMCID: PMC5149421
- DOI: 10.1021/jacs.6b09329
Triangular Monometallic Cyanide Cluster Entrapped in Carbon Cage with Geometry-Dependent Molecular Magnetism
Abstract
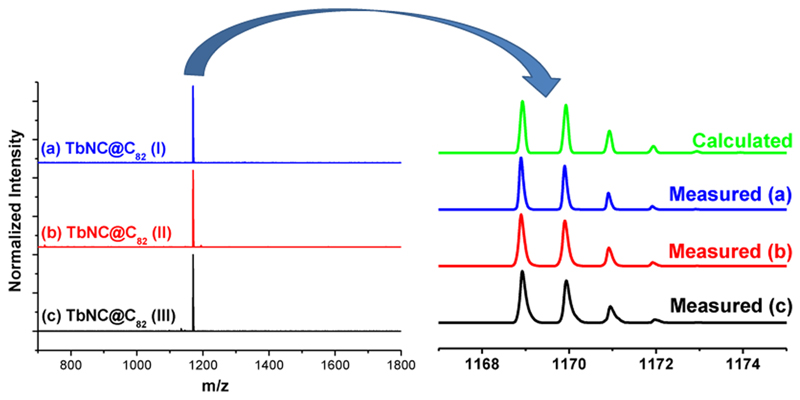
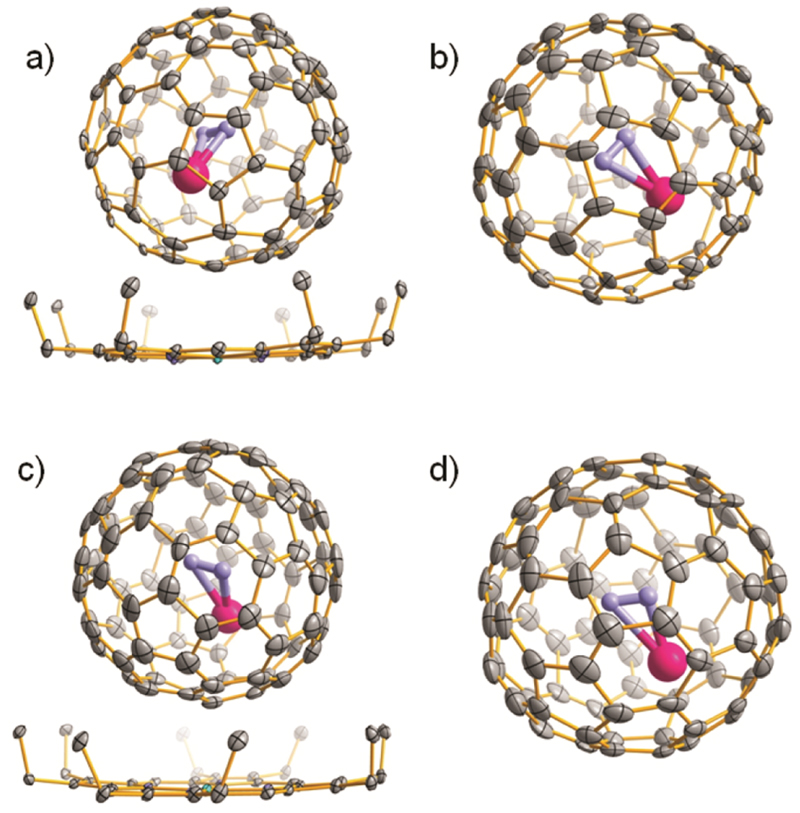
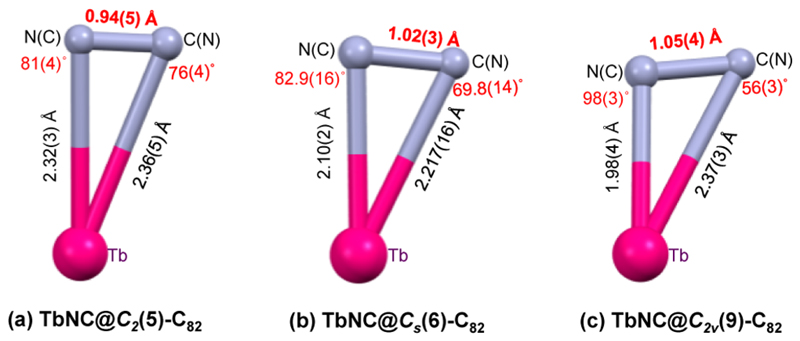
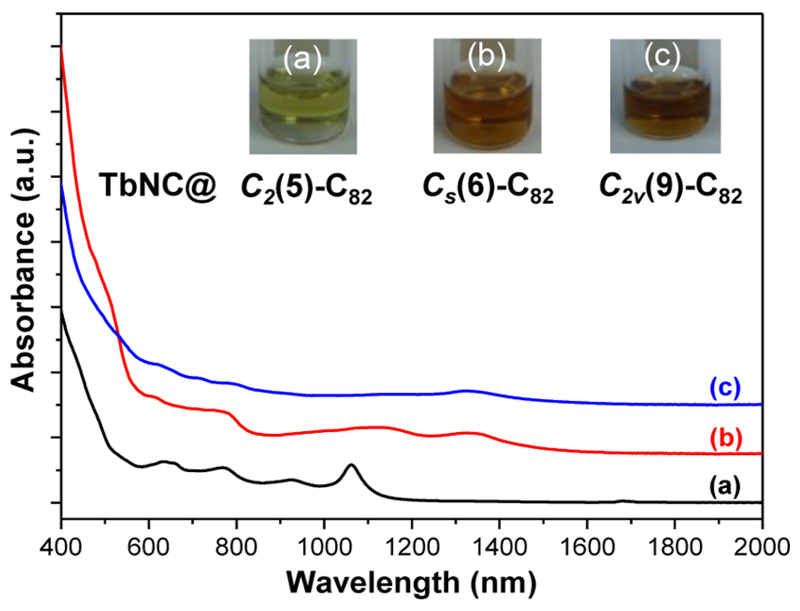
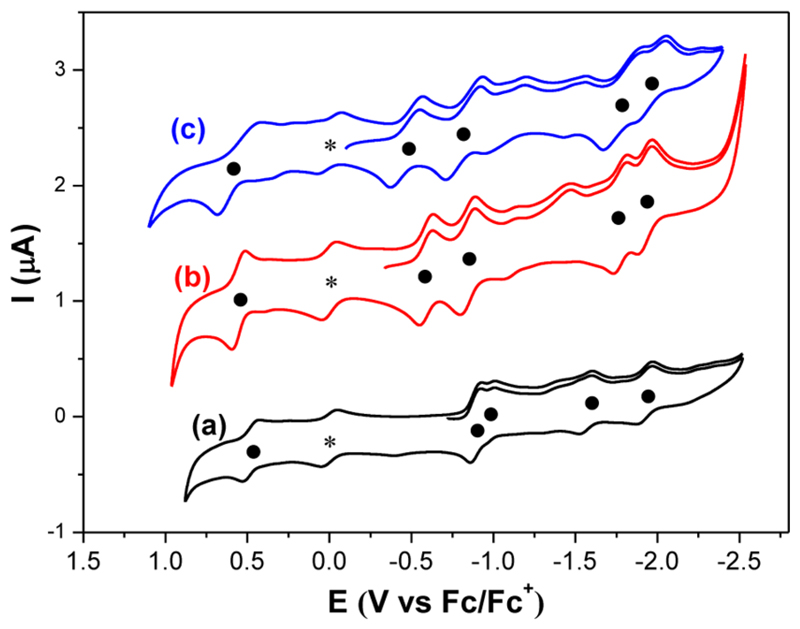
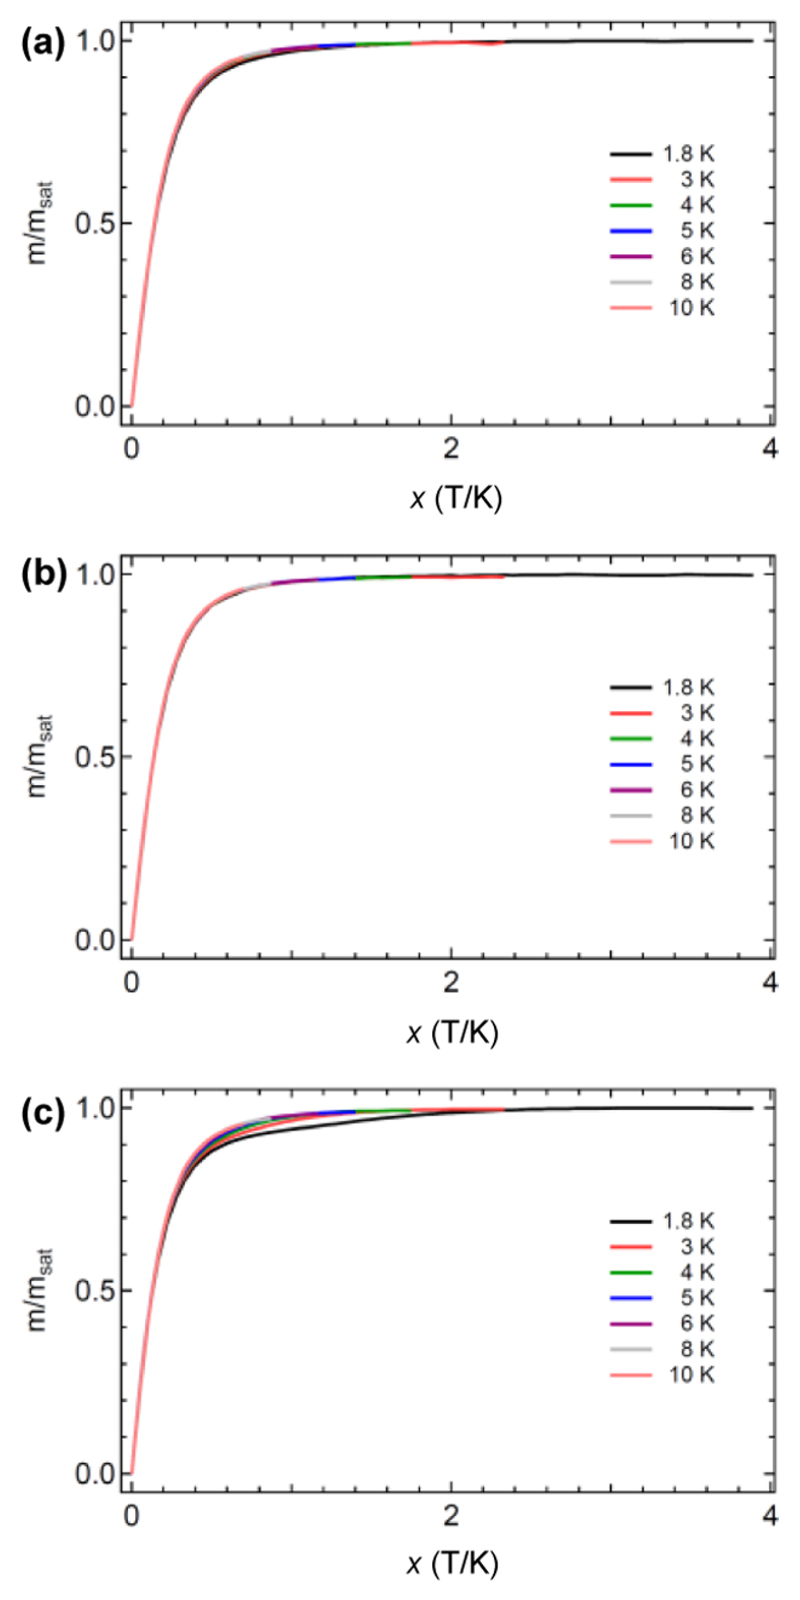
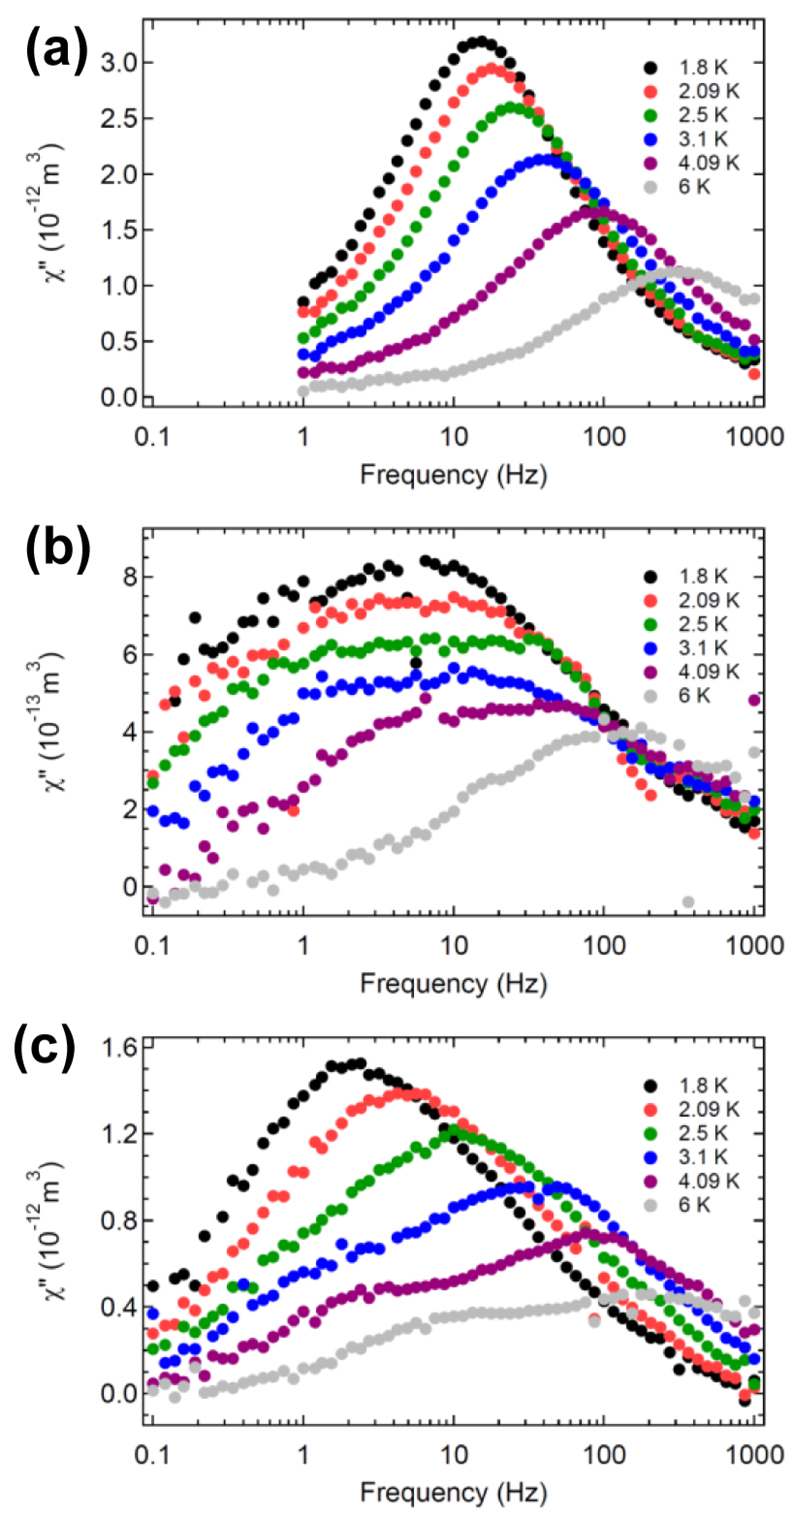
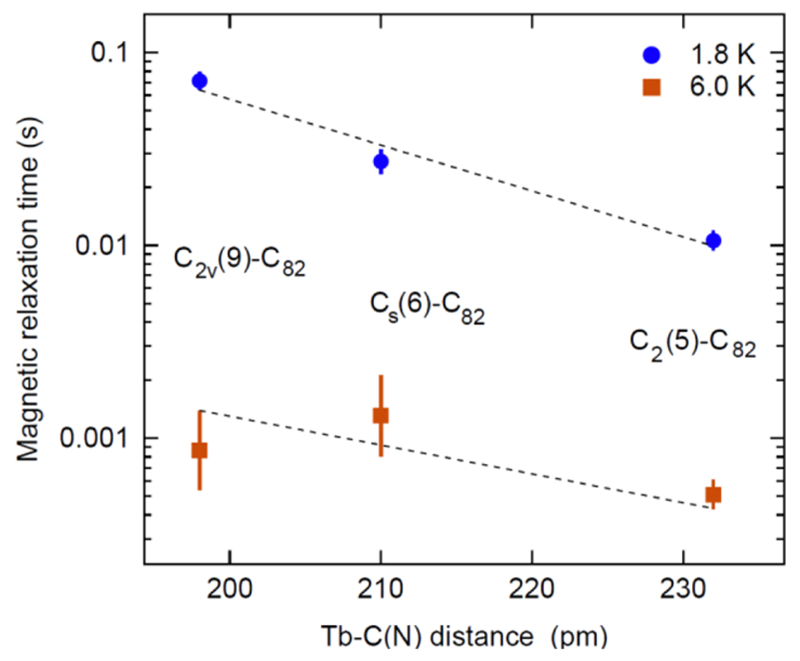
Clusterfullerenes are capable of entrapping a variety of metal clusters within carbon cage, for which the entrapped metal cluster generally keeps its geometric structure (e.g., bond distance and angle) upon changing the isomeric structure of fullerene cage, and whether the properties of the entrapped metal cluster is geometry-dependent remains unclear. Herein we report an unusual triangular monometallic cluster entrapped in fullerene cage by isolating several novel terbium cyanide clusterfullerenes (TbNC@C82) with different cage isomeric structures. Upon varying the isomeric structure of C82 cage from C2(5) to Cs(6) and to C2v(9), the entrapped triangular TbNC cluster exhibits significant distortions as evidenced by the changes of Tb-C(N) and C-N bond distances and variation of the Tb-C(N)-N(C) angle by up to 20°, revealing that the geometric structure of the entrapped triangular TbNC cluster is variable. All three TbNC@C82 molecules are found to be single-ion magnets, and the change of the geometric structure of TbNC cluster directly leads to the alternation of the magnetic relaxation time of the corresponding TbNC@C82 clusterfullerene.
Conflict of interest statement
Notes The authors declare no competing financial interest.
Figures
Similar articles
-
An improbable monometallic cluster entrapped in a popular fullerene cage: YCN@C(s)(6)-C82.Sci Rep. 2013;3:1487. doi: 10.1038/srep01487. Sci Rep. 2013. PMID: 23512079 Free PMC article.
-
Putting a terbium-monometallic cyanide cluster into the C82 fullerene cage: TbCN@C2(5)-C82.Inorg Chem. 2014 May 19;53(10):5201-5. doi: 10.1021/ic500353k. Epub 2014 May 1. Inorg Chem. 2014. PMID: 24786191
-
Mononuclear Clusterfullerene Single-Molecule Magnet Containing Strained Fused-Pentagons Stabilized by a Nearly Linear Metal Cyanide Cluster.Angew Chem Int Ed Engl. 2017 Feb 6;56(7):1830-1834. doi: 10.1002/anie.201611345. Epub 2017 Jan 12. Angew Chem Int Ed Engl. 2017. PMID: 28079303 Free PMC article.
-
When metal clusters meet carbon cages: endohedral clusterfullerenes.Chem Soc Rev. 2017 Aug 14;46(16):5005-5058. doi: 10.1039/c6cs00498a. Chem Soc Rev. 2017. PMID: 28681052 Review.
-
Endohedral clusterfullerenes--playing with cluster and cage sizes.Phys Chem Chem Phys. 2007 Jun 28;9(24):3067-81. doi: 10.1039/b704143h. Epub 2007 May 15. Phys Chem Chem Phys. 2007. PMID: 17612731 Review.
Cited by
-
Structural Studies of Giant Empty and Endohedral Fullerenes.Front Chem. 2020 Dec 3;8:607712. doi: 10.3389/fchem.2020.607712. eCollection 2020. Front Chem. 2020. PMID: 33344423 Free PMC article. Review.
-
Covalency versus magnetic axiality in Nd molecular magnets: Nd-photoluminescence, strong ligand-field, and unprecedented nephelauxetic effect in fullerenes NdM2N@C80 (M = Sc, Lu, Y).Chem Sci. 2023 Dec 21;15(6):2141-2157. doi: 10.1039/d3sc05146c. eCollection 2024 Feb 7. Chem Sci. 2023. PMID: 38332818 Free PMC article.
-
Record-high thermal barrier of the relaxation of magnetization in the nitride clusterfullerene Dy2ScN@C80-Ih.Chem Commun (Camb). 2017 Jul 11;53(56):7901-7904. doi: 10.1039/c7cc03580b. Chem Commun (Camb). 2017. PMID: 28656179 Free PMC article.
-
Single Molecule Magnetism with Strong Magnetic Anisotropy and Enhanced Dy∙∙∙Dy Coupling in Three Isomers of Dy-Oxide Clusterfullerene Dy2O@C82.Adv Sci (Weinh). 2019 Aug 15;6(20):1901352. doi: 10.1002/advs.201901352. eCollection 2019 Oct 16. Adv Sci (Weinh). 2019. PMID: 31637168 Free PMC article.
-
A charged diatomic triple-bonded U≡N species trapped in C82 fullerene cages.Nat Commun. 2022 Nov 23;13(1):7192. doi: 10.1038/s41467-022-34651-5. Nat Commun. 2022. PMID: 36418311 Free PMC article.
References
-
- Stevenson S, Rice G, Glass T, Harich K, Cromer F, Jordan MR, Craft J, Hadju E, Bible R, Olmstead MM, Maitra K, et al. Nature. 1999;401:55–57.
-
- Tan YZ, Xie SY, Huang RB, Zheng LS. Nat Chem. 2009;1:450–460. - PubMed
-
- Popov AA, Yang S, Dunsch L. Chem Rev. 2013;113:5989–6113. - PubMed
-
- Yang S, Wang C. Endohedral Fullerenes: From Fundamentals to Applications. World Scientific Publishing Co. Pte. Ltd; Singapore: 2014.
-
- Wang T, Wang C. Acc Chem Res. 2014;47:450–458. - PubMed
Publication types
Grants and funding
LinkOut - more resources
Full Text Sources
Other Literature Sources
