. 2016 Nov 1;126(11):4346-4360.
doi: 10.1172/JCI87545. Epub 2016 Oct 17.

The pseudokinase MLKL mediates programmed hepatocellular necrosis independently of RIPK3 during hepatitis

The pseudokinase MLKL mediates programmed hepatocellular necrosis independently of RIPK3 during hepatitis

Claudia Günther et al. J Clin Invest. .

Abstract

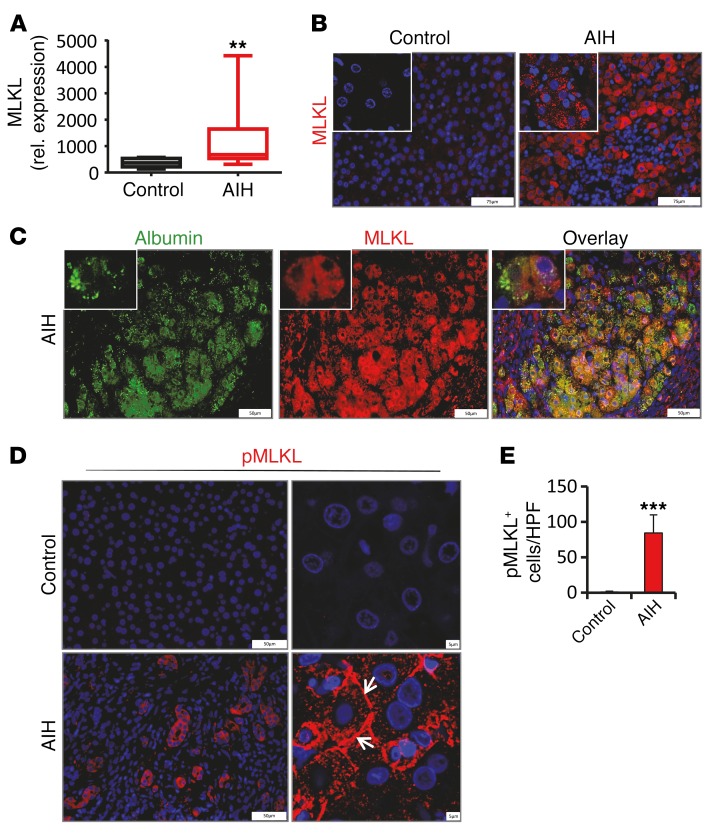
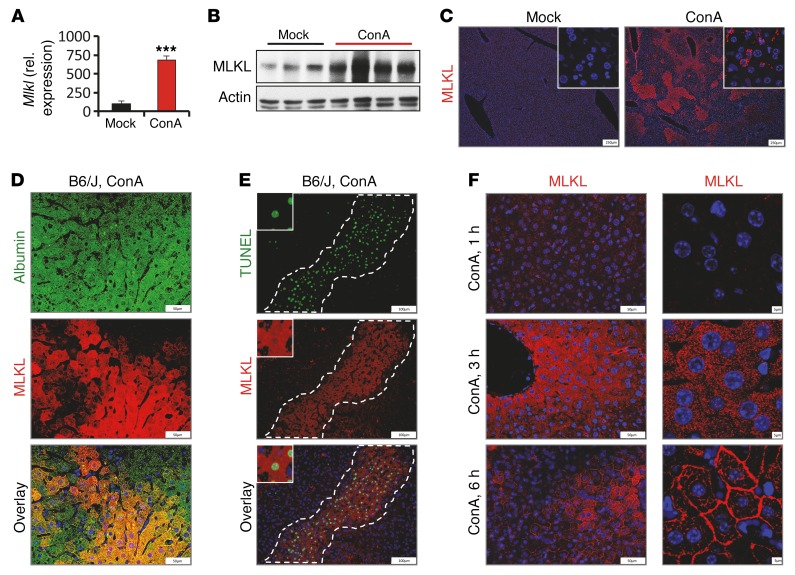
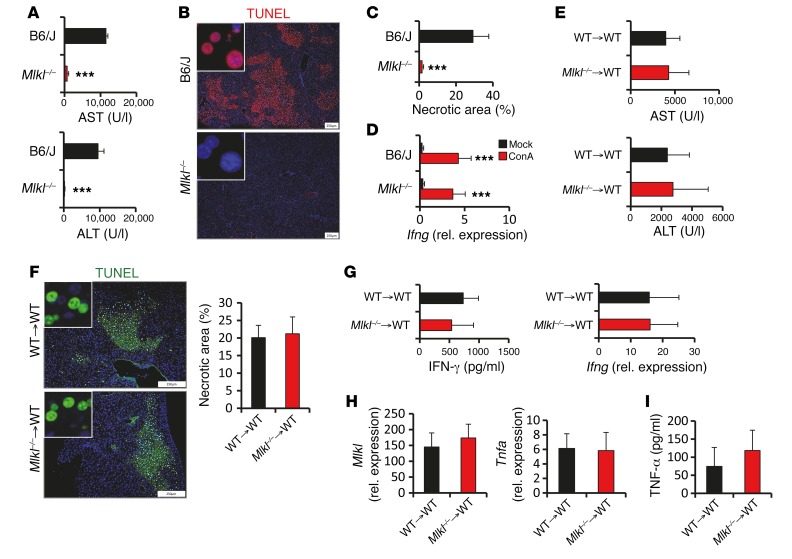
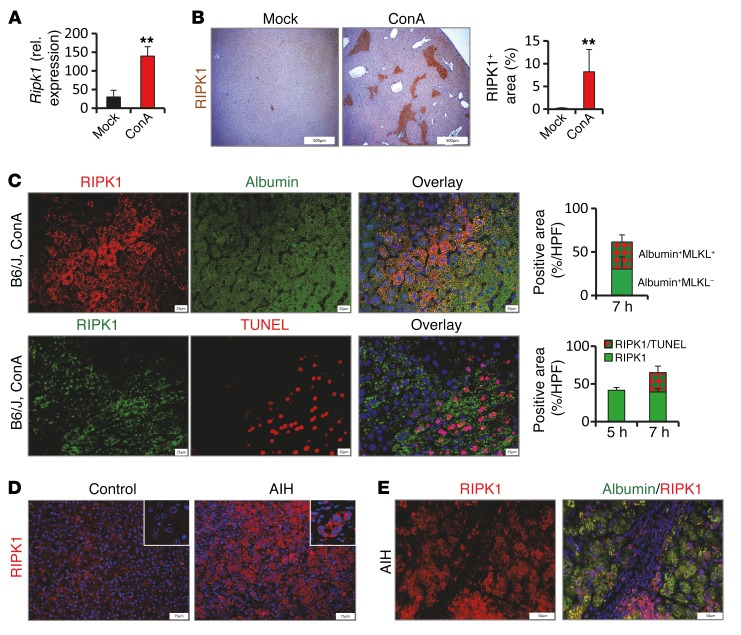
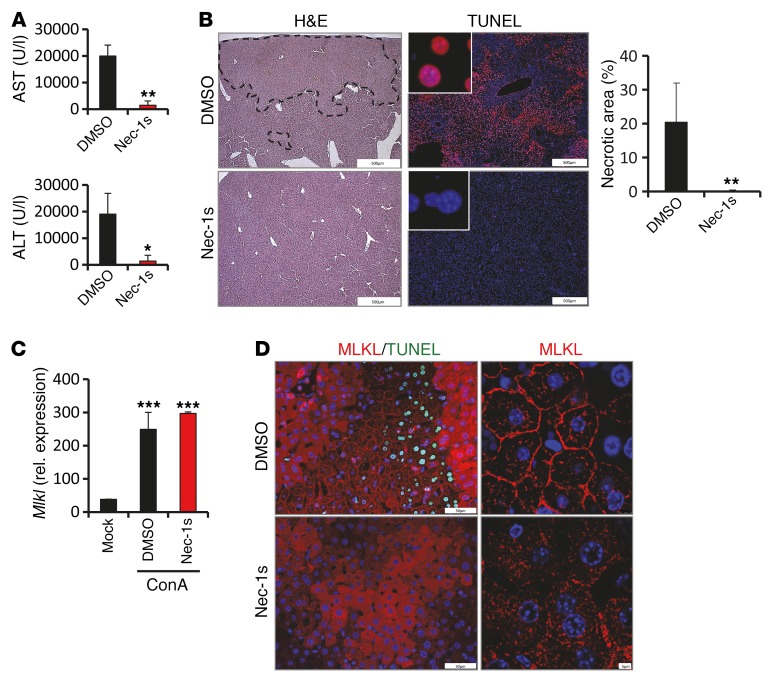
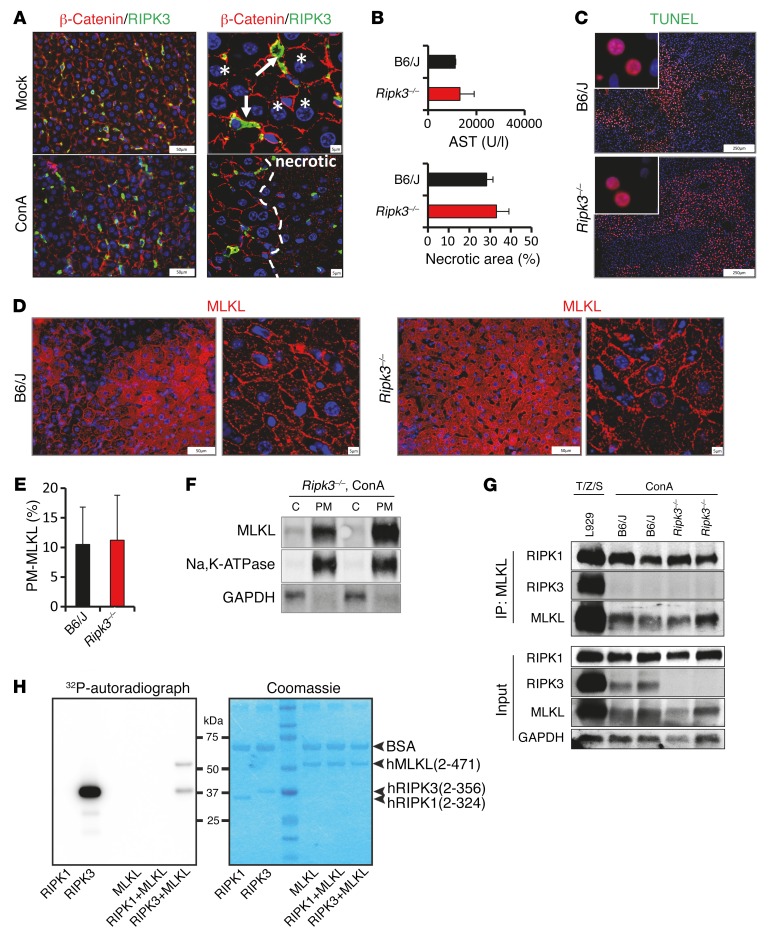
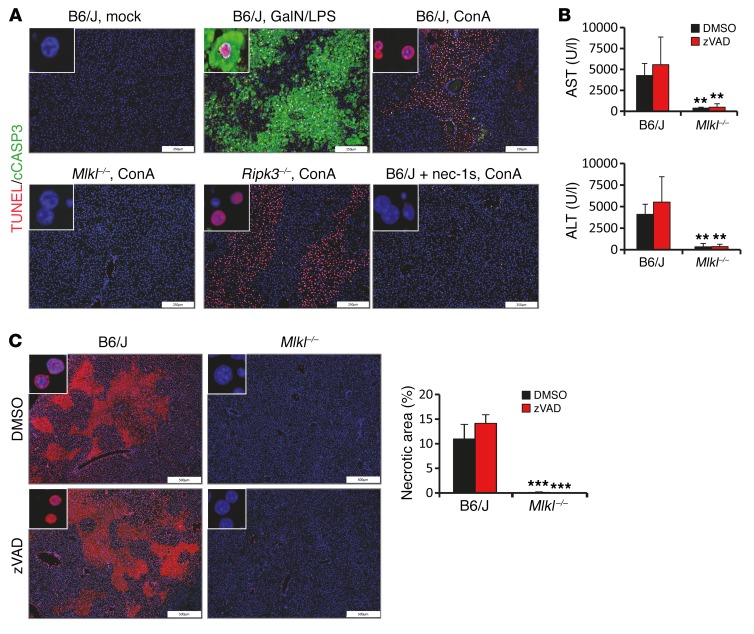
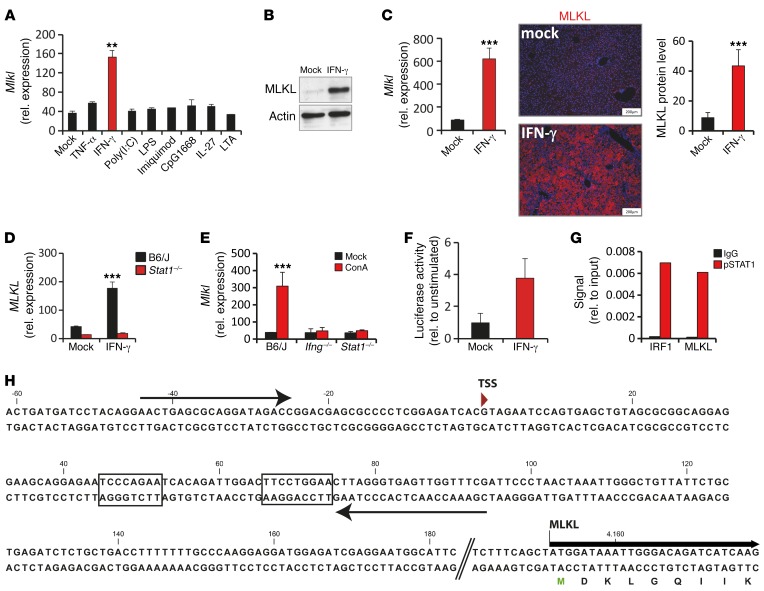
Although necrosis and necroinflammation are central features of many liver diseases, the role of programmed necrosis in the context of inflammation-dependent hepatocellular death remains to be fully determined. Here, we have demonstrated that the pseudokinase mixed lineage kinase domain-like protein (MLKL), which plays a key role in the execution of receptor-interacting protein (RIP) kinase-dependent necroptosis, is upregulated and activated in human autoimmune hepatitis and in a murine model of inflammation-dependent hepatitis. Using genetic and pharmacologic approaches, we determined that hepatocellular necrosis in experimental hepatitis is driven by an MLKL-dependent pathway that occurs independently of RIPK3. Moreover, we have provided evidence that the cytotoxic activity of the proinflammatory cytokine IFN-γ in hepatic inflammation is strongly connected to induction of MLKL expression via activation of the transcription factor STAT1. In summary, our results reveal a pathway for MLKL-dependent programmed necrosis that is executed in the absence of RIPK3 and potentially drives the pathogenesis of severe liver diseases.


Figures

Figure 1
Figure 1. MLKL is upregulated in areas of severe inflammation and cell death during AIH.
(A) Quantification of hepatic MLKL mRNA in liver biopsies obtained from control (n = 10) or AIH patients (n = 10). **P < 0.01 by paired Student’s t test. (B) Representative images of liver tissue paraffin sections analyzed for the presence of MLKL by immunofluorescence staining. (C) Representative images showing double immunofluorescence staining of MLKL and albumin in tissue paraffin sections of AIH liver. Inset magnification: ×3.38 (D) Representative images of pMLKL-stained sections of control or AIH liver (arrows demonstrate subcellular MLKL localization to plasma membranes; images on the right are confocal images) and (E) quantification of pMLKL-positive hepatocytes (n = 10 per group). ***P < 0.001 by paired Student’s t test. Error bars indicate ± SD, gene expression levels are shown relative to HPRT. Scale bar: 5 μm (D, right); 50 μm (C and D, left); 75 μm (B); 2.77 μm (B, inset).
Figure 2
Figure 2. MLKL is strongly upregulated in hepatocytes in experimentally induced hepatitis.
C57BL/6 mice were subjected to ConA or saline treatment (mock) as described in the Methods and (AE) analyzed 7 hours later or (F) at different time points after administration. Experiments were repeated 3 times with similar results. (A) Quantification of hepatic Mlkl mRNA by qPCR (n > 3 per group). ***P < 0.001 by paired Student’s t test. (B) Detection of MLKL protein in tissue lysates by Western blot. Actin was used as loading control. (C) Representative images of liver tissue paraffin sections analyzed for the presence of MLKL by immunofluorescence staining. Insets show confocal images. (D and E) Representative images showing double staining for (D) MLKL and albumin or (E) MLKL and TUNEL in liver tissue sections (the dashed lines separate necrotic areas from nonnecrotic areas). (F) Representative MLKL staining in liver tissue of wild-type mice challenged at the indicated time points with ConA. Images on the right are confocal images. Error bars indicate +SD, gene expression levels are shown relative to Hprt. Scale bar: 5 μm (F, right); 50 μm (D and F, left); 100 μm (E); 250 μm (C); 1.25 μm (C, inset). Magnification in (E): ×3.38.
Figure 3
Figure 3. MLKL expression in hepatocytes drives ConA-induced necrotic cell death.
(AD) C57BL/6 and Mlkl–/– mice were i.v. injected with ConA and analyzed 7 hours later. Experiments were repeated 3 times with similar results. (A) Plasma AST/ALT concentrations (n = 4 per group). ***P < 0.001 by paired Student’s t test. (B) Representative images of liver sections stained by TUNEL assay. (C) Quantification of necrotic areas in TUNEL assay–stained livers of ConA-challenged mice (n = 4 per group). ***P < 0.001 by paired Student’s t test. (D) Quantification of Ifng transcripts in liver lysates of mock- or ConA-challenged control and Mlkl–/– mice by qPCR (n > 3 per group). ***P < 0.001 by paired Student’s t test. (EI) 1 × 10⁷ bone marrow cells isolated from control or Mlkl–/– mice were i.v. injected into lethally irradiated C57BL/6 recipient mice. Eight weeks later, mice were injected with ConA (n = 5 per group). (E) Plasma AST/ALT concentrations (n = 5 per group). (F) Representative images and quantification (n > 4 per group) of TUNEL assay–stained tissue sections. (G) Quantification of serum IFN-γ concentrations and hepatic Ifng transcripts in ConA-treated animals (n = 5 per group). (H) Quantification of hepatic Mlkl and Tnfa transcripts (n = 5 per group). (I) Quantification of TNF-α in supernatants of splenocytes isolated from ConA-challenged mice and stimulated ex situ with PMA/ionomycin for 24 hours (n = 5 per group). Error bars indicate +SD, gene expression levels are shown relative to Hprt. Scale bar: 250 μm. Original magnification in (B and F): ×7.55.
Figure 4
Figure 4. RIPK1 is upregulated during experimentally induced hepatitis and in human AIH.
(AC) C57BL/6 mice were i.v. injected with ConA and analyzed 7 hours later. Experiments were repeated 3 times with similar results. (A) Hepatic Ripk1 transcripts were quantified by qPCR (n > 3 per group). **P < 0.01 by paired Student’s t test. (B) Representative images of liver tissue paraffin sections analyzed for the presence of RIPK1 by immunohistochemistry and quantification of RIPK1-positive areas in immunohistochemistry (n > 4 per group). **P < 0.01 by paired Student’s t test. (C) Representative images and quantification of double staining of livers sections for RIPK1 and albumin and TUNEL assay. (D and E) Representative images of liver samples of AIH patients stained for (D) RIPK1 alone or for (E) RIPK1 and albumin. Error bars indicate +SD, gene expression levels are shown relative to Hprt. Scale bar: 25 μm (C); 50 μm (E); 75 μm (D); 1.54 μm (D, inset); 500 μm (B).
Figure 5
Figure 5. ConA-induced necrotic cell death depends on the kinase activity of RIPK1.
C57BL/6 mice were treated with vehicle (DMSO) or nec-1s 30 minutes prior to ConA administration. Experiments were repeated 3 times with similar results. (A) Plasma concentrations of ALT and AST (n = 4 per group). *P < 0.05, **P < 0.01 by paired Student’s t test. (B) Representative images of H&E- (dashed lines represent necrotic areas) and TUNEL assay–stained liver tissue sections and quantification of necrotic area (n = 4 per group). **P < 0.01 by paired Student’s t test. (C) Mlkl transcripts in unchallenged mice (mock) and mice treated with ConA alone (DMSO) or pretreated with nec-1s (nec-1s) were quantified by qPCR (n > 3 per group). ***P < 0.001 by paired Student’s t test. (D) Representative images of liver tissue sections from ConA-treated mice stained for MLKL in combination with TUNEL assay. Images on the right are confocal images (MLKL staining alone). Error bars indicate +SD, gene expression levels are shown relative to Hprt. Scale bar: 5 μm (D, right); 50 μm (D, left); 500 μm (B); ×7.55 (B, insets).
Figure 6
Figure 6. RIPK3 is dispensable for ConA-induced hepatic injury.
C57BL/6 and Ripk3–/– mice were i.v. injected with ConA and analyzed 7 hours later. Experiments were repeated 3 times with similar results. (A) Representative images of liver tissue sections double stained for RIPK3 and β-catenin (confocal images are on the right; the dashed line separates necrotic areas from nonnecrotic areas; arrows demonstrate RIPK3-positive immune cells; asterisks mark representative hepatocytes). (B) Plasma AST concentrations of ConA-challenged control and Ripk3–/– mice (n > 3 per group) and evaluation of necrotic areas in TUNEL assay–stained liver sections of control and Ripk3–/– mice (from C, n > 3 per group). (C) Representative images of immunohistochemical (TUNEL assay) staining analysis of hepatic tissue sections. (D) Representative images of MLKL-stained liver tissue sections. (E) Quantification of plasma membrane localized MLKL (from D, n > 4 per group). (F) Western Blot analysis demonstrating that endogenous MLKL locates at the plasma membrane (PM) in Ripk3–/– mice following ConA treatment. C; cytoplasm. (G) Endogenous MLKL was immunoprecipitated with anti-MLKL antibody in lysates of L929 cells (treated for 3 hours with TNF-α/zVAD/SMAC mimetic) or in liver lysates of ConA-challenged wild-type or Ripk3–/– mice. (H) Recombinant hRIPK3, but not hRIPK1, kinase domain undergoes autophosphorylation and can mediate hMLKL phosphorylation in vitro. Phosphoryl transfer of 32P by 25 ng/μl hRIPK1 or hRIPK3 kinase domain in the absence of hMLKL, or 75 ng/μl hMLKL in the absence of kinase, or 2.5 ng/μl hRIPK1 or hRIPK3 in the presence of 75 ng/μl hMLKL was detected by autoradiography. A Coomassie-stained image of the autoradiograph is shown. The images are representative of triplicate experiments. Error bars indicate +SD, gene expression levels are shown relative to HPRT/Hprt. Scale bar: 5 μm (A, right, and D, right); 50 μm (A, left, and D, left); 250 μm (C); magnification in (C); ×11.
Figure 7
Figure 7. Caspases are not required for ConA-induced hepatocellular death.
(A) Representative images showing double immunofluorescence staining of cleaved caspase-3 and TUNEL assay in liver paraffin sections of unchallenged (mock), LPS/-GalN, or ConA-treated mice. (B and C) C57BL/6 or Mlkl–/– mice were treated with vehicle (DMSO) or zVAD 15 minutes prior to ConA administration. (B) Plasma AST/ALT concentrations (n > 3 per group). **P < 0.01 by paired Student’s t test. (C) Representative images of TUNEL assay–stained liver sections and quantification of necrotic area in liver cross sections of ConA-challenged mice (n > 3 per group). ***P < 0.001 by paired Student’s t test. Error bars indicate +SD. Scale bar: 250 μm, magnification ×8.25 (A); 500 μm, magnification ×8.65 (C).
Figure 8
Figure 8. IFN-γ–dependent STAT1 activation regulates MLKL expression in experimental hepatitis.
(A) Mlkl transcripts and (B) MLKL protein were quantified in PMHs stimulated ex situ with indicated factors (n = 3 per group). (C) IFN-γ expression constructs or empty control vectors (mock) were injected into C57BL/6 mice. Four days later, hepatic Mlkl mRNA or MLKL protein (n = 3 per group) was quantified by qPCR or Western blot. The presence of MLKL protein in livers was determined by specific immunofluorescent staining. (D) Relative Mlkl mRNA abundance in primary hepatocytes of wild-type or Stat1–/– mice stimulated with IFN-γ for 6 hours (n = 3 per group). (E) Quantification of hepatic Mlkl mRNA in vehicle- (mock) or ConA-challenged control C57BL/6 mice, Ifng–/– mice, and Stat1–/– mice (n > 3 per group). (F) PMHs were transfected with a Mlkl luciferase promoter construct. Twenty-four hours later, cells were stimulated with IFN-γ for 16 hours and firefly luciferase activity was determined (relative to mock group, n = 3 per group). (G) PMHs were stimulated with IFN-γ for 45 minutes. Subsequently ChIP was performed using a control antibody (IgG) or anti STAT1pTyr701 mAbs, as detailed in the Methods. Precipitated DNA fragments were quantified by qPCR using the primer sequences indicated in the sector of Mlkl genomic region in H. Primers covering a previously described STAT1-binding site in the mouse Irf1 gene promoter served as a positive control. All experiments were performed at least 2 times with similar results. (H) Partial sequence of the mouse genomic Mlkl region upstream of the start codon. Two areas predicted by Matinspector (60) and MAPPER (61) as putative STAT1-binding sites were highlighted. TSS, predicted transcriptional start site. Error bars indicate +SD, gene expression levels are shown relative to Hprt. Scale bar: 200 μm (C). **P < 0.01, ***P < 0.001 by paired Student’s t test.

Comment in

Similar articles

Cited by

References

    1. Vandenabeele P, Galluzzi L, Vanden Berghe T, Kroemer G. Molecular mechanisms of necroptosis: an ordered cellular explosion. Nat Rev Mol Cell Biol. 2010;11(10):700–714. doi: 10.1038/nrm2970. - DOI - PubMed
    1. Degterev A, et al. Chemical inhibitor of nonapoptotic cell death with therapeutic potential for ischemic brain injury. Nat Chem Biol. 2005;1(2):112–119. doi: 10.1038/nchembio711. - DOI - PubMed
    1. Vercammen D, et al. Dual signaling of the Fas receptor: initiation of both apoptotic and necrotic cell death pathways. J Exp Med. 1998;188(5):919–930. doi: 10.1084/jem.188.5.919. - DOI - PMC - PubMed
    1. Zhang H, Zhou X, McQuade T, Li J, Chan FK, Zhang J. Functional complementation between FADD and RIP1 in embryos and lymphocytes. Nature. 2011;471(7338):373–376. doi: 10.1038/nature09878. - DOI - PMC - PubMed
    1. Kaiser WJ, et al. RIP3 mediates the embryonic lethality of caspase-8-deficient mice. Nature. 2011;471(7338):368–372. doi: 10.1038/nature09857. - DOI - PMC - PubMed

Publication types

MeSH terms