

Adaptation of a RAS pathway activation signature from FF to FFPE tissues in colorectal cancer
- PMID: 27756306
- PMCID: PMC5069826
- DOI: 10.1186/s12920-016-0225-2
Adaptation of a RAS pathway activation signature from FF to FFPE tissues in colorectal cancer
Abstract
Background: The KRAS gene is mutated in about 40 % of colorectal cancer (CRC) cases, which has been clinically validated as a predictive mutational marker of intrinsic resistance to anti-EGFR inhibitor (EGFRi) therapy. Since nearly 60 % of patients with a wild type KRAS fail to respond to EGFRi combination therapies, there is a need to develop more reliable molecular signatures to better predict response. Here we address the challenge of adapting a gene expression signature predictive of RAS pathway activation, created using fresh frozen (FF) tissues, for use with more widely available formalin fixed paraffin-embedded (FFPE) tissues.
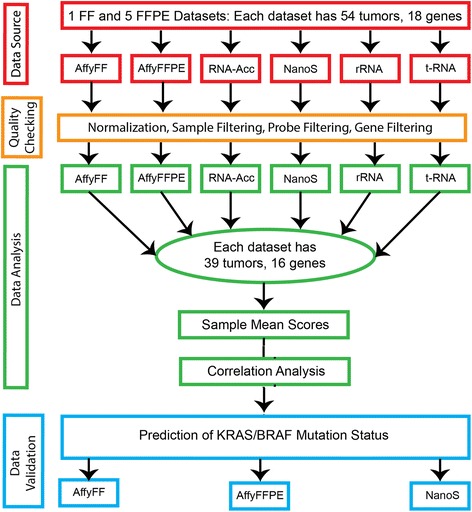
Methods: In this study, we evaluated the translation of an 18-gene RAS pathway signature score from FF to FFPE in 54 CRC cases, using a head-to-head comparison of five technology platforms. FFPE-based technologies included the Affymetrix GeneChip (Affy), NanoString nCounter™ (NanoS), Illumina whole genome RNASeq (RNA-Acc), Illumina targeted RNASeq (t-RNA), and Illumina stranded Total RNA-rRNA-depletion (rRNA).
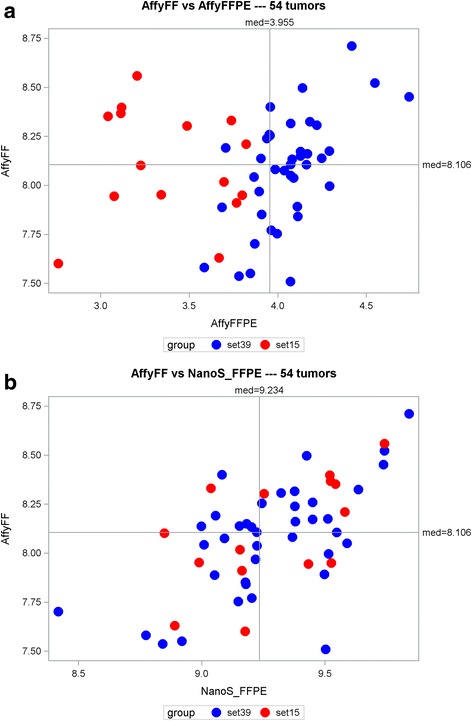
Results: Using Affy_FF as the "gold" standard, initial analysis of the 18-gene RAS scores on all 54 samples shows varying pairwise Spearman correlations, with (1) Affy_FFPE (r = 0.233, p = 0.090); (2) NanoS_FFPE (r = 0.608, p < 0.0001); (3) RNA-Acc_FFPE (r = 0.175, p = 0.21); (4) t-RNA_FFPE (r = -0.237, p = 0.085); (5) and t-RNA (r = -0.012, p = 0.93). These results suggest that only NanoString has successful FF to FFPE translation. The subsequent removal of identified "problematic" samples (n = 15) and genes (n = 2) further improves the correlations of Affy_FF with three of the five technologies: Affy_FFPE (r = 0.672, p < 0.0001); NanoS_FFPE (r = 0.738, p < 0.0001); and RNA-Acc_FFPE (r = 0.483, p = 0.002).
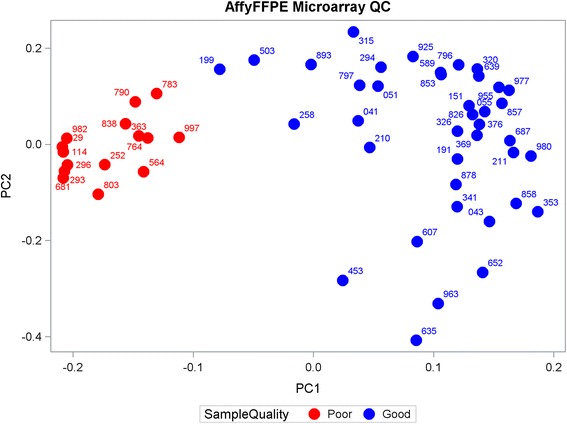
Conclusions: Of the five technology platforms tested, NanoString technology provides a more faithful translation of the RAS pathway gene expression signature from FF to FFPE than the Affymetrix GeneChip and multiple RNASeq technologies. Moreover, NanoString was the most forgiving technology in the analysis of samples with presumably poor RNA quality. Using this approach, the RAS signature score may now be reasonably applied to FFPE clinical samples.
Keywords: Colorectal cancer; FF (fresh-frozen); FFPE (formalin-fixed; Microarray; NanoString; Paraffin embedded); RAS pathway signature; RNASeq.
Figures
Similar articles
-
Next-generation sequencing of RNA and DNA isolated from paired fresh-frozen and formalin-fixed paraffin-embedded samples of human cancer and normal tissue.PLoS One. 2014 May 30;9(5):e98187. doi: 10.1371/journal.pone.0098187. eCollection 2014. PLoS One. 2014. PMID: 24878701 Free PMC article.
-
Robust transcriptional tumor signatures applicable to both formalin-fixed paraffin-embedded and fresh-frozen samples.Oncotarget. 2017 Jan 24;8(4):6652-6662. doi: 10.18632/oncotarget.14257. Oncotarget. 2017. PMID: 28036264 Free PMC article.
-
Hsa-miR-31-3p expression is linked to progression-free survival in patients with KRAS wild-type metastatic colorectal cancer treated with anti-EGFR therapy.Clin Cancer Res. 2014 Jun 15;20(12):3338-47. doi: 10.1158/1078-0432.CCR-13-2750. Epub 2014 Apr 25. Clin Cancer Res. 2014. PMID: 24771647
-
NanoString, a novel digital color-coded barcode technology: current and future applications in molecular diagnostics.Expert Rev Mol Diagn. 2017 Jan;17(1):95-103. doi: 10.1080/14737159.2017.1268533. Epub 2016 Dec 12. Expert Rev Mol Diagn. 2017. PMID: 27917695 Review.
-
Standardising RNA profiling based biomarker application in cancer-The need for robust control of technical variables.Biochim Biophys Acta Rev Cancer. 2017 Aug;1868(1):258-272. doi: 10.1016/j.bbcan.2017.05.005. Epub 2017 May 23. Biochim Biophys Acta Rev Cancer. 2017. PMID: 28549623 Review.
Cited by
-
A germinal center-associated microenvironmental signature reflects malignant phenotype and outcome of DLBCL.Blood Adv. 2022 Apr 12;6(7):2388-2402. doi: 10.1182/bloodadvances.2021004618. Blood Adv. 2022. PMID: 34638128 Free PMC article.
-
PTPRS Regulates Colorectal Cancer RAS Pathway Activity by Inactivating Erk and Preventing Its Nuclear Translocation.Sci Rep. 2018 Jun 18;8(1):9296. doi: 10.1038/s41598-018-27584-x. Sci Rep. 2018. PMID: 29915291 Free PMC article.
-
Gene Expression Patterns Associated with Survival in Glioblastoma.Int J Mol Sci. 2024 Mar 25;25(7):3668. doi: 10.3390/ijms25073668. Int J Mol Sci. 2024. PMID: 38612480 Free PMC article.
-
PTPRS drives adaptive resistance to MEK/ERK inhibitors through SRC.Oncotarget. 2019 Nov 26;10(63):6768-6780. doi: 10.18632/oncotarget.27335. eCollection 2019 Nov 26. Oncotarget. 2019. PMID: 31827720 Free PMC article.
-
Comparison of triple-negative breast cancer molecular subtyping using RNA from matched fresh-frozen versus formalin-fixed paraffin-embedded tissue.BMC Cancer. 2017 Apr 4;17(1):241. doi: 10.1186/s12885-017-3237-1. BMC Cancer. 2017. PMID: 28376728 Free PMC article.
References
-
- Siegel RL, Miller KD, Jemal A. Cancer statistics, 2016. CA Cancer J Clin. 2016;66(1):7-30. - PubMed
-
- Loboda A, Nebozhyn M, Klinghoffer R, Frazier J, Chastain M, Arthur W, et al. A gene expression signature of RAS pathway dependence predicts response to PI3K and RAS pathway inhibitors and expands the population of RAS pathway activated tumors. BMC Med Genomics. 2010;3:26. doi: 10.1186/1755-8794-3-26. - DOI - PMC - PubMed
Publication types
MeSH terms
Substances
Grants and funding
LinkOut - more resources
Full Text Sources
Other Literature Sources
Medical
Molecular Biology Databases
Research Materials
Miscellaneous
