. 2016 Oct 19;15(1):66.
doi: 10.1186/s12943-016-0548-9.

Prediction of chemo-response in serous ovarian cancer

Affiliations

Prediction of chemo-response in serous ovarian cancer

Jesus Gonzalez Bosquet et al. Mol Cancer. .

Abstract

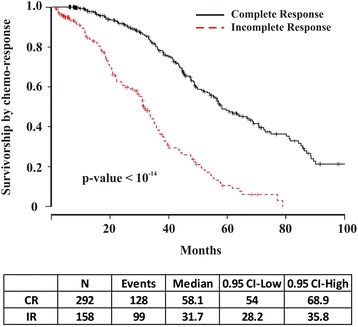
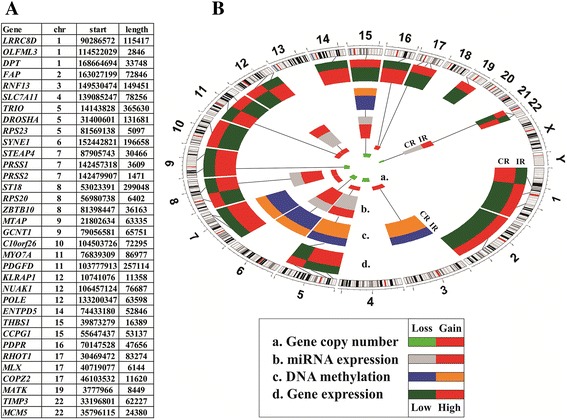
Background: Nearly one-third of serous ovarian cancer (OVCA) patients will not respond to initial treatment with surgery and chemotherapy and die within one year of diagnosis. If patients who are unlikely to respond to current standard therapy can be identified up front, enhanced tumor analyses and treatment regimens could potentially be offered. Using the Cancer Genome Atlas (TCGA) serous OVCA database, we previously identified a robust molecular signature of 422-genes associated with chemo-response. Our objective was to test whether this signature is an accurate and sensitive predictor of chemo-response in serous OVCA.

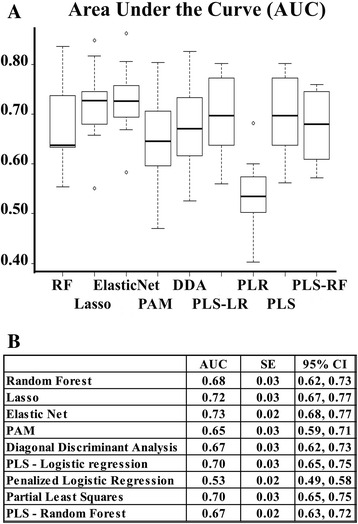
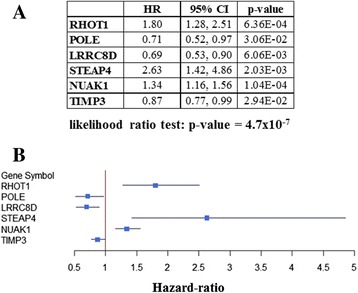
Methods: We first constructed prediction models to predict chemo-response using our previously described 422-gene signature that was associated with response to treatment in serous OVCA. Performance of all prediction models were measured with area under the curves (AUCs, a measure of the model's accuracy) and their respective confidence intervals (CIs). To optimize the prediction process, we determined which elements of the signature most contributed to chemo-response prediction. All prediction models were replicated and validated using six publicly available independent gene expression datasets.

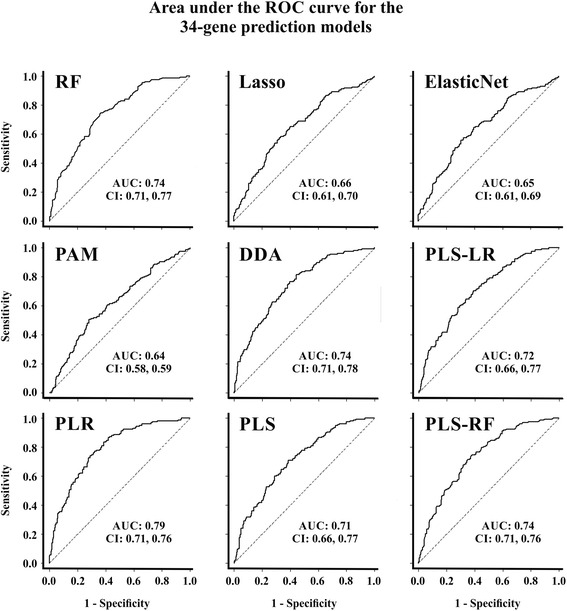
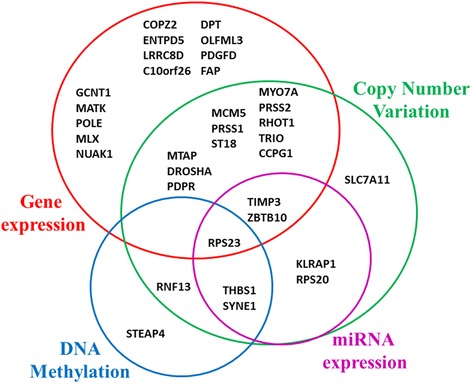
Results: The 422-gene signature prediction models predicted chemo-response with AUCs of ~70 %. Optimization of prediction models identified the 34 most important genes in chemo-response prediction. These 34-gene models had improved performance, with AUCs approaching 80 %. Both 422-gene and 34-gene prediction models were replicated and validated in six independent datasets.

Conclusions: These prediction models serve as the foundation for the future development and implementation of a diagnostic tool to predict response to chemotherapy for serous OVCA patients.

Keywords: Chemo-response; Data integration; Individualized treatment; Ovarian cancer; Prediction model.


Figures

Fig. 1
Fig. 1
Survivorship by chemo-response in serous OVCA TCGA data. Chemo-response was the most significant factor in the multivariable analysis for survival. Complete responders (CR) have a median survival 2 years greater than IR
Fig. 2
Fig. 2
Area under the ROC curve (AUC) for the 422-gene prediction models. a Box plot representations of the AUC for the complete model by different methods. RF: Random forest; Lasso (least absolute shrinkage and selection operator); Elastic Net; PAM: Prediction analysis for microarrays; DDA: Diagonal discriminant analysis; PLS-LR: Partial least squares - Logistic regression; PLR: Penalized logistic regression; PLS: Partial least squares; PLS-RF: Partial least squares - Random forest. b Prediction performance measured in AUC, with their respective standard error, and confidence intervals (CI) by different methods using all 422 genes. PAM: Prediction analysis for microarrays; PLS: Partial least squares; Lasso: least absolute shrinkage and selection operator
Fig. 3
Fig. 3
AUC for 34-gene predictions models. AUCs and CIs for the predicting methods using the most relevant genes in the prediction model/classifier: RF: Random forest; Lasso (least absolute shrinkage and selection operator); Elastic Net; PAM: Prediction analysis for microarrays; DDA: Diagonal discriminant analysis; PLS-LR: Partial least squares - Logistic regression; PLR: Penalized logistic regression; PLS: Partial least squares; PLS-RF: Partial least squares - Random forest
Fig. 4
Fig. 4
Origin of 34 genes selected in the optimized prediction model. Initially, genes were included in the 422-gene signature because of their differential gene expression (red), miRNA expression (pink), DNA methylation (blue), or copy number variation (green) between CR and IR. Some genes had more than one biological difference
Fig. 5
Fig. 5
Genomic position of 34 genes selected for the optimized prediction model. a The 34 most informative genes from the prediction model and their chromosomal location: chr: number of the chromosome were the gene is located; start: of the gene position; length: of the gene in base-pairs (bp). The human genome version was hg19. b Circular layout with matrix depiction of different biological variables. From external to internal: Chromosome bands: circular representation of all chromosomes (centromere is in red); d Differential gene expression between incomplete and complete responders (CR/IR; red is over-expressed, green is under-expressed); c Differential DNA methylation between CR and IR (CR/IR; blue is hypomethylated, orange is hyper methylated); b Differential miRNA expression between CR and IR (CR/IR; red is over-expressed, grey is under-expressed); a Gene copy number variation between CR and IR (copy gain is red, green is copy loss). The order of genes in a is the same as in b. Lines represent correlations between different biological variables (for more details see Table 4)
Fig. 6
Fig. 6
Multivariate survival analysis of the 34 selected genes. a Table with hazard-ratio (HR) or risk of death, with 95 % CIs and p-values for each of the genes independently associated with survival. b Forest plot of independently significant genes for survival. Blue boxes represent hazard-ratios (HR), and lines are their CIs. HR = 1 is non-significant. HR < 1 has decreased risk of death; HR > 1 has increased risk of death. Overall p-value of the survival model: p = 5.7×10⁻⁷

References

    1. American Cancer Society . Cancer Facts & Figures 2014. Atlanta: American Cancer Society; 2014.
    1. Gilks CB, Prat J. Ovarian carcinoma pathology and genetics: recent advances. Hum Pathol. 2009;40:1213–23. doi: 10.1016/j.humpath.2009.04.017. - DOI - PubMed
    1. Cannistra SA. Cancer of the ovary. N Engl J Med. 2004;351:2519–9. - PubMed
    1. Friedlander ML, Stockler MR, Butow P, King MT, McAlpine J, Tinker A, Ledermann JA. Clinical trials of palliative chemotherapy in platinum-resistant or -refractory ovarian cancer: time to think differently? J Clin Oncol. 2013;31:2362. doi: 10.1200/JCO.2012.47.7927. - DOI - PubMed
    1. Johnson SW, Laub PB, Beesley JS, Ozols RF, Hamilton TC. Increased platinum-DNA damage tolerance is associated with cisplatin resistance and cross-resistance to various chemotherapeutic agents in unrelated human ovarian cancer cell lines. Cancer Res. 1997;57:850–6. - PubMed

Publication types

MeSH terms

Substances