. 2017 Jan:235:88-94.
doi: 10.1016/j.resp.2016.10.006. Epub 2016 Oct 15.

C57BL/6J mouse apolipoprotein A2 gene is deterministic for apnea

Affiliations

C57BL/6J mouse apolipoprotein A2 gene is deterministic for apnea

Carl B Gillombardo et al. Respir Physiol Neurobiol. 2017 Jan.

Abstract

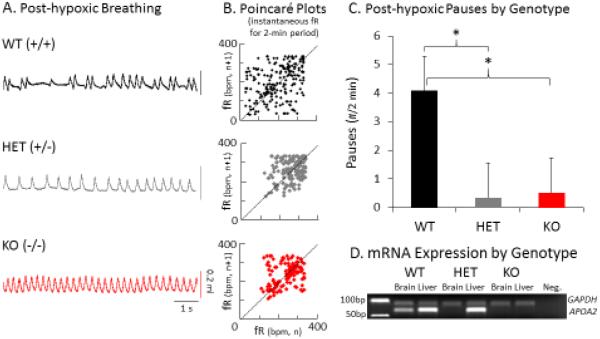
Rationale: Brainstem apolipoprotein AII (apoa2) mRNA expression correlates with apnea in breathing present in the adult C57Bl/6J (B6) sleep apnea model.

Objectives: To test the hypothesis that the B6 apoa2 gene contributes to the trait, we performed plethysmographic testing in apoa2 knock out (KO: -/-) mice, an in situ brainstem-spinal cord preparation comparing KO to WT (+/+) mice, and B6xDBA recombinant inbred strains (RISs).

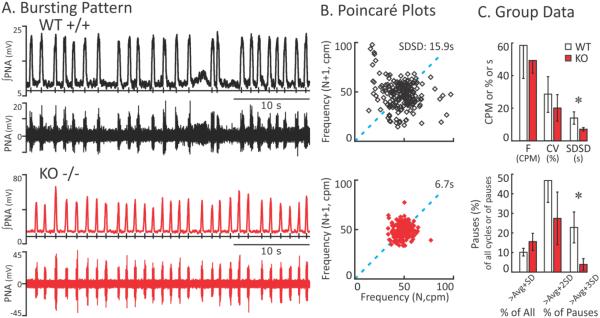
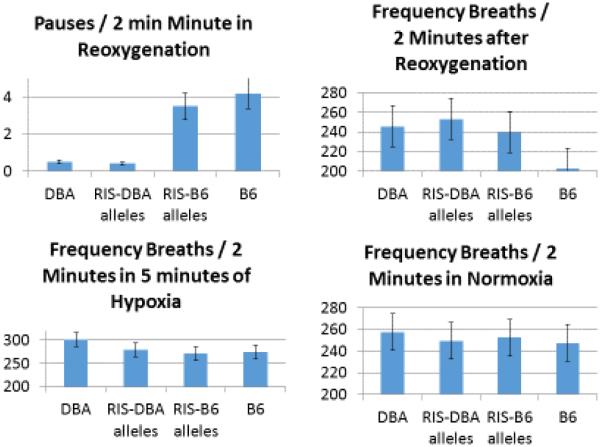
Measurements and main results: Apoa2 WT do, but KO and heterozygote (+/-) mice do not exhibit apnea during post-hypoxic breathing, measured in vivo. In the in situ model, pauses and instability in fictive phrenic bursting are substantially reduced in KO vs. WT preparations. In 24 RISs, apnea number in vivo was higher in strains with B6 apoa2 than with DBA apoa2 alleles.

Conclusions: The B6 apoa2 polymorphism is directly involved in breath production, and its identification suggests a novel pathway influencing risk for adult sleep apnea.


Figures

Figure 1
Figure 1. Respiratory stability correlates with Apoa2 mRNA expression
A. Three representative traces (8-s) of breathing patterns are presented from individual wild type (WT, HET- heterozygote, and KO mice. Vertical scale bar represents 0.2 ml. B. Poincaré plots display the instantaneous frequency of one breath (fR n on X-axis) against the frequency of the next breath (fR n+1 on the Y axis) for the 2-min in reoxygenation following hypoxia, and illustrate greatest dispersion in the WT mouse. C. The bar represents the mean and SD of values for the number (#) of apnea in the 2 min following reoxygenation, from WT (n=14), HET (n=27), and KO (n=17) mice in an intercross study of inheritance. D. D. Gel electrophoresis showing mRNA levels of Apoa2 gene vs. a housekeeping gene (GAPDH) in representative WT, HET, and KO mice showing 1) WT: relative reduction of Apoa2 mRNA in the brainstem vs. the liver, 2) HET: Apoa2 mRNA present in the liver but not in the brainstem, 3) KO: Apoa2 mRNA absent in both liver and brainstem. The results from HET mice indicate the necessity for both B6 alleles to express the trait of apnea. ANOVA differences: p<0.001 and * indicates differences in unpaired t-tests: p<0.01)
Figure 2
Figure 2. The fictive respiration pattern in the in situ preparation of KO less variable than that of WT mice
A. Bursting Patterns. Representative traces of integrated and raw phrenic nerve activity (∫PNA and PNA respectively) showing the ‘fictive’ breathing pattern from WT (top) and KO (bottom) in situ preparations. B. Poincaré plots. Representative Poincaré plots, showing the distribution of instantaneous respiratory frequency (cycles per minute) for a WT (top) and KO (bottom) mice, with points representing a successive cycle (N+1) plotted against the current cycle (N) for 200 cycles. The dotted line is the line of identity. C. Group Data. The top graph shows the mean and standard deviation for frequency (F), its coefficient of variation (CV), and the standard deviation of successive differences (SDSD) in TTOT (s) for WT (open box) and KO (solid box) mice. The mean frequencies and its CV were not significantly different in KO and WT mice. Successive differences (SD) in TTOT is the average of absolute differences in duration between cycle (N) and cycle (N+1) and the SDSD is simply the standard deviation of that average. The greater the standard deviation the greater the distribution of point in the Poincaré plot. The bottom graph shows pauses in the pattern. The first pair of bars reflects the percentage of cycles that were greater than the average plus one standard deviation of cycle length. The percentages of long cycles were not significantly different in WT and KO rats. The next two pairs of bars represent the percentage of long cycles that are pauses; in that the cycles were greater than the average plus 2 and 3 standard deviations respectively. In WT rats, approximately 50% and 25% of the long cycles were pauses (avg +2SD or +3SD respectively) whereas KO expressed few cycles that were as long the avg+3SD.
Figure 3
Figure 3. Pause Generation and Frequency in Recombinant Inbred Strains
The four graphs illustrate responses in DBAxB6 recombinant inbred strains (RISs) according to the apoa2 polymorphism (n=56 with DBA apoa2 SNPs; 78 with B6 apoa2 SNPs), and the parental strains (DBA/6J, n=6; B6, n =100). Top left: Pause number in the first 2 minutes of reoxygenation show significant differences among strains (P<0.001), being lower in the DBA and RIS strains with a DBA apoa2 polymorphisms. Top Right: The respiratory frequency during the same 2 min period shows significant differences (P<0.001). Bottom Left: Frequency is presented during the last 2 minutes of hypoxia (P<0.001). Bottom Right: Frequency at rest in the strains (P<0.06).

References

    1. Abdala AP, Rybak IA, Smith JC, Zoccal DB, Machado BH, St-John WM, Paton JF. Multiple pontomedullary mechanisms of respiratory rhythmogenesis. Respiratory physiology & neurobiology. 2009;168:19–25. - PMC - PubMed
    1. Abdala AP, Toward MA, Dutschmann M, Bissonnette JM, Paton JF. Deficiency of GABAergic synaptic inhibition in the Kolliker-Fuse area underlies respiratory dysrhythmia in a mouse model of Rett syndrome. The Journal of physiology. 2016;594:223–237. - PMC - PubMed
    1. Ballester M, Revilla M, Puig-Oliveras A, Marchesi JA, Castello A, Corominas J, Fernandez AI, Folch JM. Analysis of the porcine APOA2 gene expression in liver, polymorphism identification and association with fatty acid composition traits. Animal genetics. 2016;47:552–559. - PubMed
    1. Corella D, Tai ES, Sorli JV, Chew SK, Coltell O, Sotos-Prieto M, Garcia-Rios A, Estruch R, Ordovas JM. Association between the APOA2 promoter polymorphism and body weight in Mediterranean and Asian populations: replication of a gene-saturated fat interaction. Int J Obes (Lond) 2011;35:666–675. - PMC - PubMed
    1. Crabbe JC. Rodent models of genetic contributions to motivation to abuse alcohol. Nebr Symp Motiv. 2014;61:5–29. - PMC - PubMed

Publication types