. 2016 Dec;172(4):2219-2234.
doi: 10.1104/pp.16.01582. Epub 2016 Oct 17.

Control of Autophagy in Chlamydomonas Is Mediated through Redox-Dependent Inactivation of the ATG4 Protease

Affiliations

Control of Autophagy in Chlamydomonas Is Mediated through Redox-Dependent Inactivation of the ATG4 Protease

María Esther Pérez-Pérez et al. Plant Physiol. 2016 Dec.

Abstract

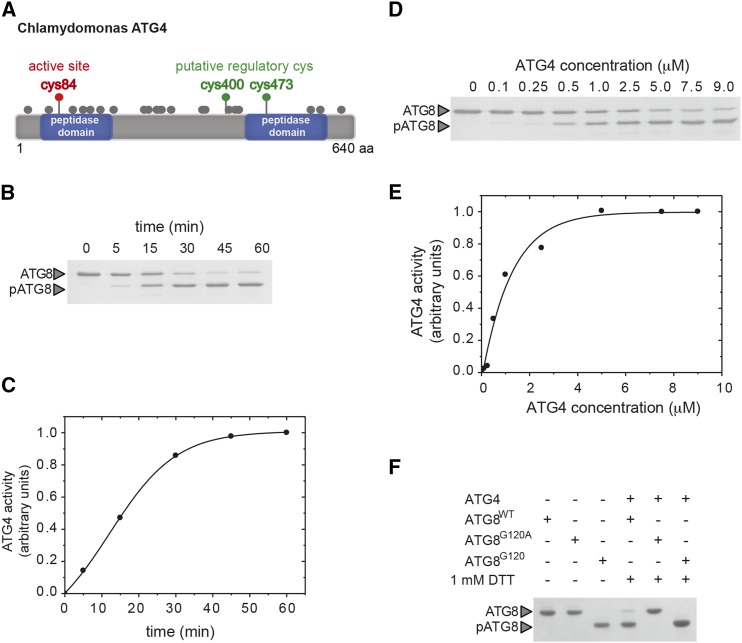
Autophagy is a major catabolic pathway by which eukaryotic cells deliver unnecessary or damaged cytoplasmic material to the vacuole for its degradation and recycling in order to maintain cellular homeostasis. Control of autophagy has been associated with the production of reactive oxygen species in several organisms, including plants and algae, but the precise regulatory molecular mechanisms remain unclear. Here, we show that the ATG4 protease, an essential protein for autophagosome biogenesis, plays a central role for the redox regulation of autophagy in the model green alga Chlamydomonas reinhardtii Our results indicate that the activity of C. reinhardtii ATG4 is regulated by the formation of a single disulfide bond with a low redox potential that can be efficiently reduced by the NADPH/thioredoxin system. Moreover, we found that treatment of C. reinhardtii cells with norflurazon, an inhibitor of carotenoid biosynthesis that generates reactive oxygen species and triggers autophagy in this alga, promotes the oxidation and aggregation of ATG4. We propose that the activity of the ATG4 protease is finely regulated by the intracellular redox state, and it is inhibited under stress conditions to ensure lipidation of ATG8 and thus autophagy progression in C. reinhardtii.


Figures

Figure 1.
Figure 1.
C. reinhardtii ATG4 cleaves ATG8 at the conserved Gly Gly-120. A, Domain structure of the ATG4 protease from C. reinhardtii. Two peptidase domains comprising residues from positions 49-182 and 437-590, respectively, were identified using the Conserved Domains search tool at the NCBI (http://www.ncbi.nlm.nih.gov/Structure/cdd/wrpsb.cgi). All cysteines present in C. reinhardtii ATG4 are indicated as gray balls, including the catalytic (red) and two putative regulatory (green) cysteines. B, C. reinhardtii ATG4 (1 µm) activity was monitored by following the cleavage of recombinant C. reinhardtii ATG8 (5 µm) from the unprocessed (ATG8) to the processed (pATG8) form (indicated by arrowheads) along time and subsequent SDS-PAGE and Coomassie Brilliant Blue staining. C, Quantification of ATG4 activity from B. The reference sample for quantification was the one at 60 min and it was considered as activity = 1 (in arbitrary units). D, Different concentrations of ATG4 were used to analyze C-terminal processing of ATG8 (5 µm) to pATG8 after 30 min. E, Quantification of ATG4 activity from D. The reference sample for quantification was the one with the maximum ATG4 concentration (9 µm was considered as activity = 1, in arbitrary units). F, C. reinhardtii wild-type ATG8 (ATG8WT) and the mutant forms ATG8G120A (Gly-120 is replaced by Ala) and ATG8G120 (a truncated protein at Gly-120 corresponding to a processed-like form and used as a control) were incubated in an assay mixture in the absence or presence of the ATG4 protease for 1 h.
Figure 2.
Figure 2.
The protease activity of C. reinhardtii ATG4 is redox regulated. A, Effect of DTT on ATG4 activity. ATG4 was incubated with ATG8 for 1 h in the presence of DTT concentrations ranging from 25 µm to 1 mm. Control (lanes 1 and 2): incubation with no addition. Lane 1 does not contain ATG4. B, Quantification of ATG4 activity from A. The highest DTT concentration sample was used as reference sample for quantification (activity = 1, in arbitrary units). C, Effect of H2O2 on the activity of prereduced ATG4. After pretreatment with 100 µM DTT for 30 min, ATG4 was treated with increasing H2O2 concentrations for 20 min and then incubated with ATG8 for 1 h. Control (lanes 1 and 2): incubation with no addition. Lane 1 does not contain ATG4. D, Quantification of ATG4 activity from C. The prereduced but not treated with H2O2 sample was used as reference for quantification (activity = 1, in arbitrary units). E, Inhibition of ATG4 activity by H2O2 is reversed by DTT. ATG4 protein was pretreated with 100 µm DTT for 30 min (lane 2); then, ATG4 was incubated with 500 µm H2O2 for 20 min (lane 3); finally, ATG4 was newly treated with 1 mm DTT for 30 min (lane 4). Control (lane 1): incubation with no addition. For all lanes, ATG8 was added to the reaction mixture for 1 h after each specific treatment to assess ATG4 activity. F, ATG4 is irreversibly inactivated by the alkylating agent IAM. ATG4 was pretreated with 100 µM DTT for 30 min (lane 2), then incubated with 20 mm IAM for 30 min (lane 3); next, ATG4 was again incubated with 50 mm DTT for 30 min (lane 4). Control (lane 1): incubation with no addition. For all lanes, ATG8 was added to the reaction mixture for 1 h after each specific treatment to study ATG4 activity. G, ATG4 activity is dependent on the DTTred/DTTox ratio. ATG4 processing activity was monitored after incubation during 2 h in the presence of various DTTred/DTTox ratios (1/1, 1/10, 1/100, 10/1, 100/1 in mm). H, ATG4 is not activated by GSH. ATG4 activity was determined after incubation for 1 h in the presence of 0.5, 1, or 5 mm GSH (lanes 2, 3, and 4, respectively), 1 mm DTT (lane 5), or in the absence of reducing agent (lane 1). I, Redox titration of ATG4 activity. ATG4 activity was analyzed after incubation for 2 h at indicated Eh poised by 20 mm DTT in various dithiol/disulfide ratios. ATG8 was added to the reaction mixture for 15 min after DTT treatment in all samples. The -∞ sample was used as reference for quantification. J, ATG4 activities monitored as in I were interpolated by nonlinear regression of the data using a Nernst equation for 2 electrons exchanged (n = 2) and one redox component. The average midpoint redox potential (Em,7) of three independent experiments is reported in the figure as mean ± sd.
Figure 3.
Figure 3.
C. reinhardtii ATG4 is activated by the NADPH/NTR/TRX system. A, ATG4 activity was measured after incubation for 30 min in the presence (+) or absence (−) of 10 µm DTT, 5 µm TRXh1, and 5 µm TRXh1C39S as indicated. Proteins were visualized by Coomassie Brilliant Blue staining. pATG8, processed ATG8. B, Kinetics of ATG8 processing by ATG4 in the presence of 10 µm DTT, 5 µm TRXh1, or 5 µm TRXh1C39S. ATG4 activity was assayed as described in A. C, ATG4 activity was determined as described in (A) but using NADPH and NTR as the physiological electron donor for TRX. ATG4 activity was analyzed after incubation for 30 min in the presence (+) or absence () of 2 mm NADPH, 1 µm Arabidopsis NTRB, 5 µm TRXh1, and 5 µm TRXh1C39S as indicated. The ATG8 and pATG8 forms NTRB and TRXh1 are marked with arrowheads. D, Schematic representation of the proposed mechanism of activation of C. reinhardtii ATG4 through reduction by the NADPH/NTR/Trx system.
Figure 4.
Figure 4.
The Cys-to-Ser mutant protein ATG4C400S is not redox-regulated. ATG4 activity was monitored as described in Figure 3. A, The activity of ATG4WT, ATG4C84S, ATG4C400S, or ATG4C473S was determined after incubation for 30 min in the presence (+) or absence (−) of 10 µm DTT and 5 µm TRXh1 as indicated. B, Quantification of ATG4 activity from A. The reference sample for quantification was ATG4WT incubated with DTT and TRXh1 (activity = 1, in arbitrary units). The data are represented as mean ± sd (n = 3). **, Differences were significant at P < 0.01 according to the Student’s t test between the ATG4WT and the indicated mutant. The ATG8 and pATG8 forms and TRXh1 are marked with arrowheads.
Figure 5.
Figure 5.
Redox control of C. reinhardtii ATG4 oligomerization. A, C. reinhardtii recombinant ATG4 (5 µm) was subjected to 12% SDS-PAGE in the presence (+) or absence (−) of β-mercaptoethanol (βME) and stained with Coomassie Brilliant Blue. mATG4, monomeric ATG4; oATG4, oligomeric ATG4. B, ATG4 (5 µm) was incubated with different DTT concentrations ranging from 25 to 1,000 µm for 1 h and then resolved by SDS-PAGE. C, ATG4 (5 µm) was preincubated with 100 µm DTT for 1 h (lane 2); then, ATG4 was treated with 500 µm H2O2 for 20 min (lane 3); and finally, ATG4 was incubated with 1 mm DTT for 30 min (lane 4). Control (lane 1): incubation with no addition. D, Redox titration of ATG4 oligomerization/monomerization. ATG4 monomerization was analyzed after incubation for 2 h at indicated Eh poised by 20 mm DTT in various dithiol/disulfide ratios. The oligomeric (oATG4) and monomeric (mATG4) ATG4 forms are marked by arrowheads. βME-free buffer was used in B to D.
Figure 6.
Figure 6.
Autophagy-activating conditions lead to the oligomerization and inactivation of ATG4 in C. reinhardtii cells. A, C. reinhardtii recombinant ATG4 was subjected to 12% SDS-PAGE in the presence (+) or absence (−) of β-mercaptoethanol (βME) in the loading buffer and/or treated with 20 mm DTT for 1 h and then stained with Coomassie Brilliant Blue (5 µm ATG4) or subjected to western-blot analysis with anti-ATG4 antibodies (0.25 µm ATG4). B, Western-blot analysis of ATG4 and ATG8 during the growth phase in C. reinhardtii. Cells were grown in TAP from 1 × 10⁶ cells/mL to 8 × 10⁶ cells/mL, and the ATG4 and ATG8 protein profiles were analyzed. C, Effect of ER stress on ATG4 and ATG8 in C. reinhardtii. Wild-type C. reinhardtii cells growing at exponential phase were treated with 5 µg/mL tunicamycin (tun) as previously described (Pérez-Pérez et al., 2010), and samples were taken at different times for its analysis. Untreated cells were used as control. D, Inhibition of the carotenoid biosynthetic pathway leads to ATG8 lipidation and ATG4 oligomerization in C. reinhardtii. Wild-type C. reinhardtii cells in exponential growth phase were treated with 20 μm NF during 48 h as previously described (Pérez-Pérez et al., 2012). Samples of nontreated cells were taken at the same time and used as control. E, Western-blot analysis of ATG4 and ATG8 proteins on dark-to-light transition in the lts1-204 mutant. C. reinhardtii lts1-204 cells growing exponentially in TAP under dark conditions were transferred to standard light illumination (25 µE) for 6 h. Cells maintained in dark conditions were used as control. Then 15 μg of total extracts were resolved by 12% (for ATG4) or 15% (for ATG8 and FKBP12) SDS-PAGE followed by western blotting with anti-ATG4, anti-ATG8, and anti-FKBP12 antibodies. The oligomeric (oATG4) and monomeric (mATG4) ATG4 forms are marked on the right. Molecular mass markers (kD) are indicated on the left. β-Mercaptoethanol-free buffer was used in B to E.
Figure 7.
Figure 7.
ATG4 activity depends on ATG4 reduction and monomerization. A, The ROS scavenger NAC decreased ATG4 oxidation and aggregation in C. reinhardtii. Wild-type C. reinhardtii cells in exponential growth phase were treated with 20 μm NF in the presence (+) or absence (−) of 10 mm NAC during 48 h. Samples of nontreated cells were taken before the treatment(s) and used as control (first lane). B, ATG4 protease activity in cell-free extracts of C. reinhardtii. Ten nanograms of recombinant His-tagged ATG8 protein (6H-ATG8) were incubated with 50 µg of cell-free extracts (SE) of C. reinhardtii for 30 min at 25°C. When required, cell-free extracts were previously incubated with a reducing (25 mm DTT) or alkylating (20 mm IAM) agent for 1 h on ice. The reaction was stopped by the addition of loading buffer and boiling at 100°C. Aliquots of the reaction mixtures were resolved by 15% SDS-PAGE and analyzed by western blotting with the anti-ATG4 (top panel) and anti-ATG8 (bottom panel) antibodies. Exogenous, recombinant ATG8 protein containing the His-6 tag (6H-ATG8) could be distinguished from endogenous C. reinhardtii ATG8 by their different size (Pérez-Pérez et al., 2010). The oligomeric (oATG4) and monomeric (mATG4) ATG4 forms, the unprocessed (6H-ATG8) and processed His-tagged (p6H-ATG8) ATG8 forms, and the endogenous ATG8 protein (ATG8) are marked with arrowheads. C, Quantification of ATG4 activity from B. Three independent experiments were used for quantification and they are shown as mean ± sd. D, Effect of DTT on both ATG4 oligomerization and ATG4 activity. Purified ATG4 (2.5 μm) was incubated with ATG8 (5 μm) for 30 min in the presence of DTT concentrations ranging from 10 to 1 mm. Control (lane 1): incubation with no addition. The oligomeric (oATG4) and monomeric (mATG4) ATG4 forms, and the unprocessed (ATG8) and processed ATG8 (pATG8) forms are marked by arrowheads. Molecular mass markers (kD) are shown on the left. A β-mercaptoethanol-free buffer was used. E, Quantification of ATG4 oligomerization (black circles) and ATG4 activity (dark-gray circles) from D. The DTT-lacking sample and the highest DTT concentration-sample were used as reference sample for quantification of oligomerization (oligomerization = 1, in arbitrary units) and quantification of activity (activity = 1, in arbitrary units), respectively. Three independent experiments were used for quantification.
Figure 8.
Figure 8.
ATG4 localizes to punctate structures in C. reinhardtii cells in response to autophagy activation. A, Immunolocalization of ATG4 in wild-type C. reinhardtii cells treated with NF. C. reinhardtii cells growing exponentially were treated with 20 μm NF for 48 h. Nontreated cells at 0 and 48 h were used as control. Cells were collected and processed for immunofluorescence microscopy analysis with anti-ATG4 and antiacetylated tubulin antibodies. Scale bar = 8 μm. A zoom of some of the cells is also shown (right panels for the control cells and lower panels for NF-treated cells). B, Quantification of the immunofluorescence signal detected in individual cells from the experiment described in A. A minimum of 200 cells was analyzed for each condition using ImageJ software. ** Differences were significant at P < 0.0001 according to Student’s t test. AU, arbitrary units.
Figure 9.
Figure 9.
Localization of ATG4 in C. reinhardtii carotenoid mutant cells exposed to light. lts1-204 mutant cells growing exponentially in TAP medium in dark conditions were exposed to low light (20 µE m−2 s−1) for 6 h or maintained in dark conditions as control. Cells were collected and processed for immunofluorescence microscopy analysis with anti-ATG4 antibodies. Scale bar = 8 μm.
Figure 10.
Figure 10.
Putative model for the redox regulation of ATG4 in C. reinhardtii. C. reinhardtii ATG4 can be found in at least three conformational states: an active and monomeric form (state 1), an inactive and monomeric form (state 2), and an inactive and oligomeric form (state 3). Taken together, our data strongly suggest that the presence of ATG4 in these three states depends on the intracellular redox potential. We propose a model in which two different oxidation levels result in the inactivation of the protease. A first level of oxidation (disulfide bond formation, state 2) results in the inactivation of ATG4, which can be either further oxidized to an oligomeric and inactive form (state 3) or newly reduced to a monomeric and active form (state 1). The presence of oxidants, ROS, or a positive redox potential may induce a high rate of state 2 and state 3 forms of ATG4. In contrast, the presence of reducing agents, the action of reducing proteins such as the Trx system, or a negative redox potential may lead to the reduction and activation of ATG4 (state 1). Thus, the activity of the ATG4 protease may be finely modulated depending on the redox conditions and the intracellular redox state in C. reinhardtii cells.

Similar articles

Cited by

References

    1. Avila-Ospina L, Moison M, Yoshimoto K, Masclaux-Daubresse C (2014) Autophagy, plant senescence, and nutrient recycling. J Exp Bot 65: 3799–3811 - PubMed
    1. Avin-Wittenberg T, Honig A, Galili G (2012) Variations on a theme: plant autophagy in comparison to yeast and mammals. Protoplasma 249: 285–299 - PubMed
    1. Bassham DC, Laporte M, Marty F, Moriyasu Y, Ohsumi Y, Olsen LJ, Yoshimoto K (2006) Autophagy in development and stress responses of plants. Autophagy 2: 2–11 - PubMed
    1. Buchanan BB, Balmer Y (2005) Redox regulation: a broadening horizon. Annu Rev Plant Biol 56: 187–220 - PubMed
    1. Chung T, Suttangkakul A, Vierstra RD (2009) The ATG autophagic conjugation system in maize: ATG transcripts and abundance of the ATG8-lipid adduct are regulated by development and nutrient availability. Plant Physiol 149: 220–234 - PMC - PubMed

Publication types

MeSH terms