

Signatures of Archaic Adaptive Introgression in Present-Day Human Populations
- PMID: 27756828
- PMCID: PMC5400396
- DOI: 10.1093/molbev/msw216
Signatures of Archaic Adaptive Introgression in Present-Day Human Populations
Abstract
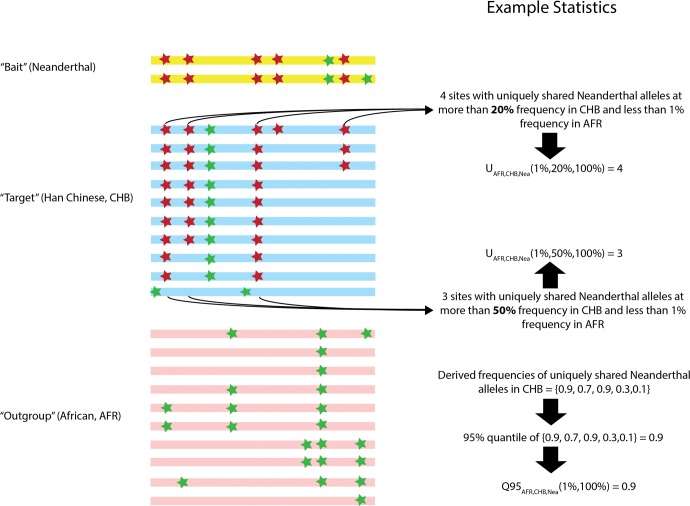
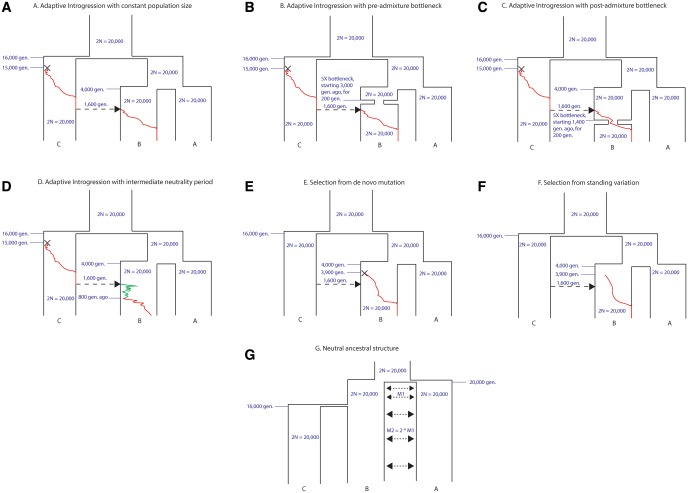
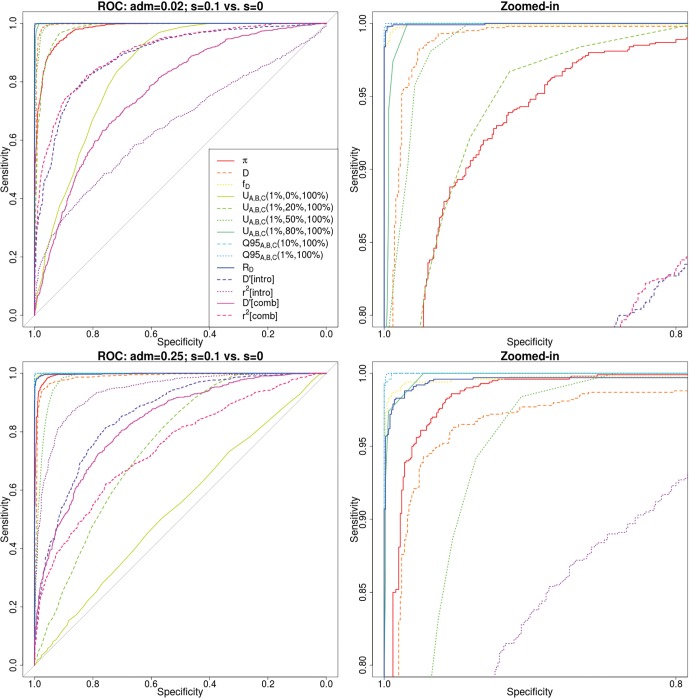
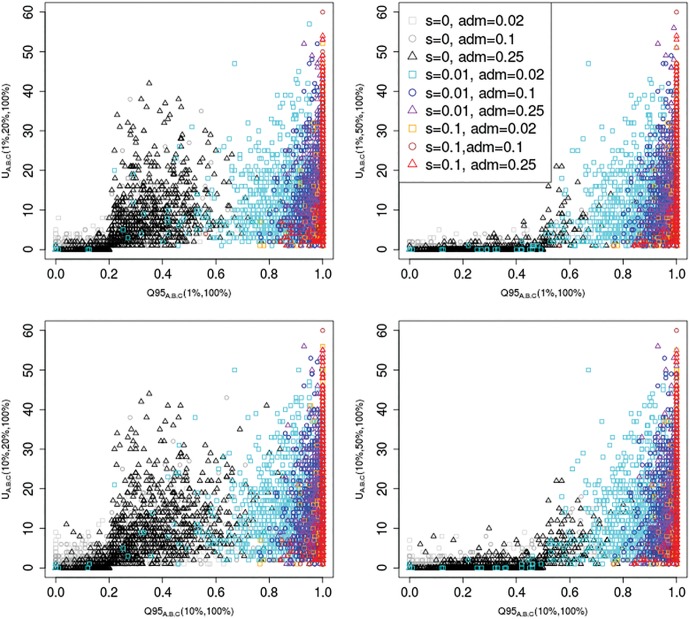
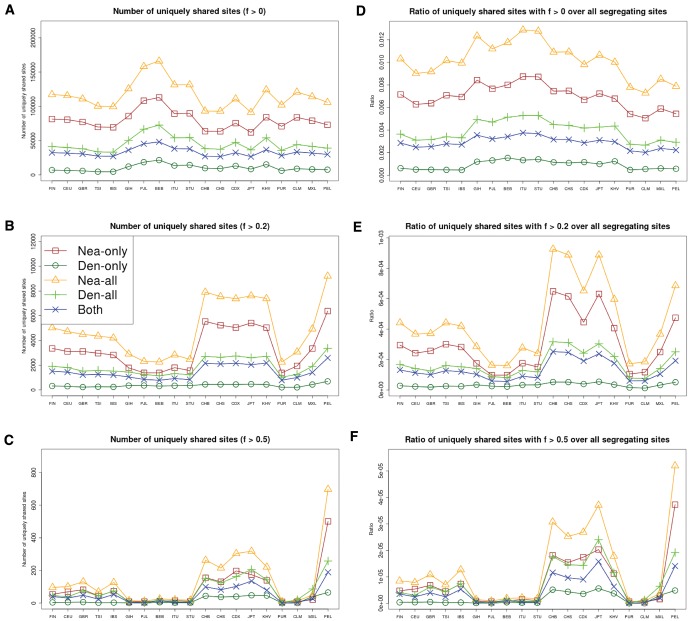
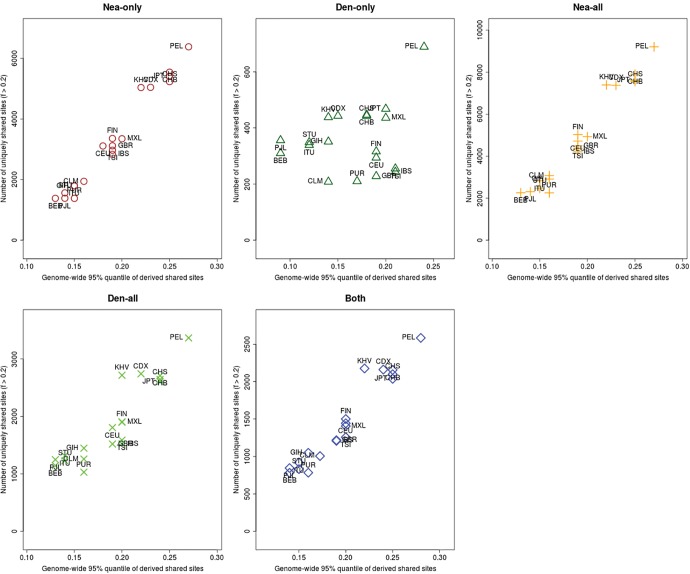
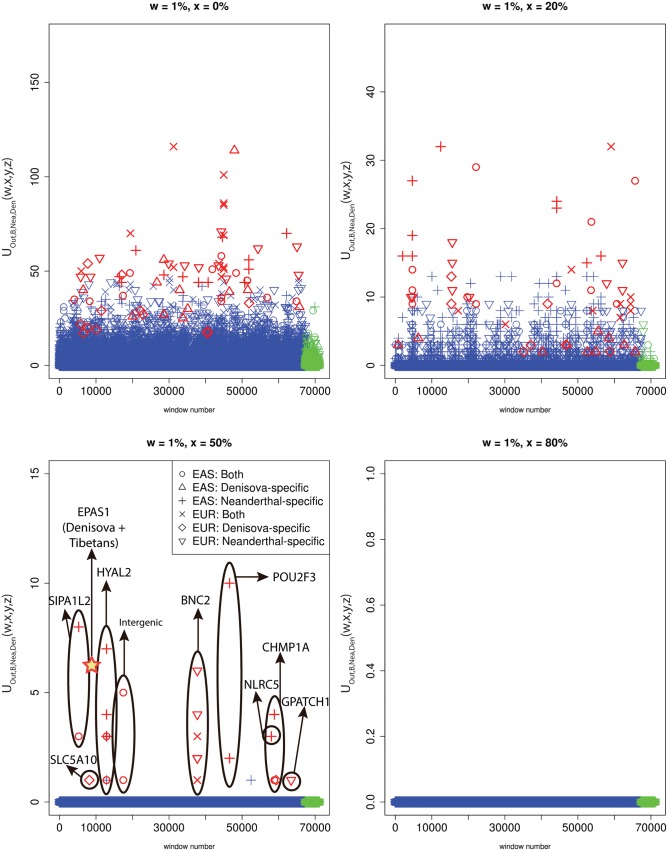
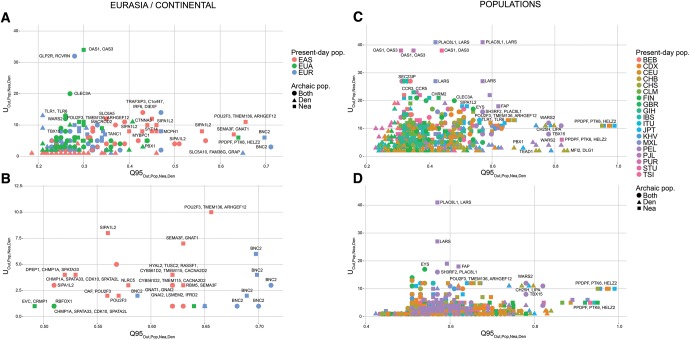
Comparisons of DNA from archaic and modern humans show that these groups interbred, and in some cases received an evolutionary advantage from doing so. This process-adaptive introgression-may lead to a faster rate of adaptation than is predicted from models with mutation and selection alone. Within the last couple of years, a series of studies have identified regions of the genome that are likely examples of adaptive introgression. In many cases, once a region was ascertained as being introgressed, commonly used statistics based on both haplotype as well as allele frequency information were employed to test for positive selection. Introgression by itself, however, changes both the haplotype structure and the distribution of allele frequencies, thus confounding traditional tests for detecting positive selection. Therefore, patterns generated by introgression alone may lead to false inferences of positive selection. Here we explore models involving both introgression and positive selection to investigate the behavior of various statistics under adaptive introgression. In particular, we find that the number and allelic frequencies of sites that are uniquely shared between archaic humans and specific present-day populations are particularly useful for detecting adaptive introgression. We then examine the 1000 Genomes dataset to characterize the landscape of uniquely shared archaic alleles in human populations. Finally, we identify regions that were likely subject to adaptive introgression and discuss some of the most promising candidate genes located in these regions.
Keywords: adaptive introgression; ancient DNA; denisova; neanderthal.
© The Author 2016. Published by Oxford University Press on behalf of the Society for Molecular Biology and Evolution.
Figures
Similar articles
-
The timing of human adaptation from Neanderthal introgression.Genetics. 2021 May 17;218(1):iyab052. doi: 10.1093/genetics/iyab052. Genetics. 2021. PMID: 33787889 Free PMC article.
-
Evidence for archaic adaptive introgression in humans.Nat Rev Genet. 2015 Jun;16(6):359-71. doi: 10.1038/nrg3936. Epub 2015 May 12. Nat Rev Genet. 2015. PMID: 25963373 Free PMC article. Review.
-
A haplotype at STAT2 Introgressed from neanderthals and serves as a candidate of positive selection in Papua New Guinea.Am J Hum Genet. 2012 Aug 10;91(2):265-74. doi: 10.1016/j.ajhg.2012.06.015. Am J Hum Genet. 2012. PMID: 22883142 Free PMC article.
-
Archaic Adaptive Introgression in TBX15/WARS2.Mol Biol Evol. 2017 Mar 1;34(3):509-524. doi: 10.1093/molbev/msw283. Mol Biol Evol. 2017. PMID: 28007980 Free PMC article.
-
Something old, something borrowed: admixture and adaptation in human evolution.Curr Opin Genet Dev. 2018 Dec;53:1-8. doi: 10.1016/j.gde.2018.05.009. Epub 2018 Jun 9. Curr Opin Genet Dev. 2018. PMID: 29894925 Review.
Cited by
-
Our Tangled Family Tree: New Genomic Methods Offer Insight into the Legacy of Archaic Admixture.Genome Biol Evol. 2021 Jul 6;13(7):evab115. doi: 10.1093/gbe/evab115. Genome Biol Evol. 2021. PMID: 34028527 Free PMC article. Review.
-
Intragenus (Homo) variation in a chemokine receptor gene (CCR5).PLoS One. 2018 Oct 2;13(10):e0204989. doi: 10.1371/journal.pone.0204989. eCollection 2018. PLoS One. 2018. PMID: 30278065 Free PMC article.
-
Detection of Neanderthal Adaptively Introgressed Genetic Variants That Modulate Reporter Gene Expression in Human Immune Cells.Mol Biol Evol. 2022 Jan 7;39(1):msab304. doi: 10.1093/molbev/msab304. Mol Biol Evol. 2022. PMID: 34662402 Free PMC article.
-
Introgressive Hybridization and Hypoxia Adaptation in High-Altitude Vertebrates.Front Genet. 2021 Jun 22;12:696484. doi: 10.3389/fgene.2021.696484. eCollection 2021. Front Genet. 2021. PMID: 34239546 Free PMC article. Review.
-
Population Genomics Reveals Speciation and Introgression between Brown Norway Rats and Their Sibling Species.Mol Biol Evol. 2017 Sep 1;34(9):2214-2228. doi: 10.1093/molbev/msx157. Mol Biol Evol. 2017. PMID: 28482038 Free PMC article.
References
-
- Akira S, Uematsu S, Takeuchi O. 2006. Pathogen recognition and innate immunity. Cell 124:783–801. - PubMed
-
- Aslanidis C, Ries S, Fehringer P, Büchler C, Klima H, Schmitz G. 1996. Genetic and biochemical evidence that CESD and wolman disease are distinguished by residual lysosomal acid lipase activity. Genomics 33:85–93. - PubMed
-
- Barton NH. 1998. The effect of hitch-hiking on neutral genealogies. Genet Res. 72:123–133.
Publication types
MeSH terms
Substances
Grants and funding
LinkOut - more resources
Full Text Sources
Other Literature Sources
