. 2016 Nov 25;291(48):25050-25065.
doi: 10.1074/jbc.M116.727404. Epub 2016 Oct 18.

Necroptosis-like Neuronal Cell Death Caused by Cellular Cholesterol Accumulation

Affiliations

Necroptosis-like Neuronal Cell Death Caused by Cellular Cholesterol Accumulation

Takeshi Funakoshi et al. J Biol Chem. .

Abstract

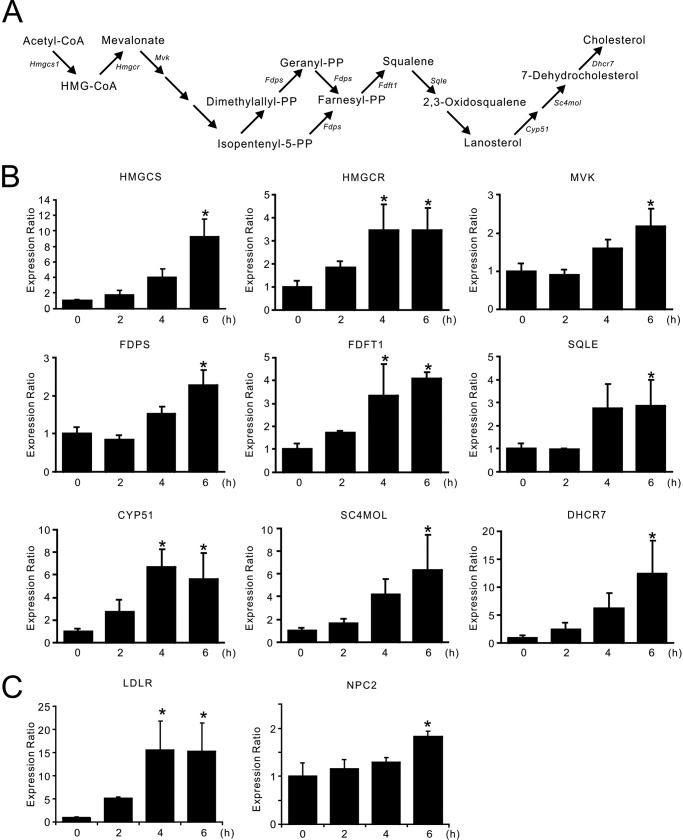
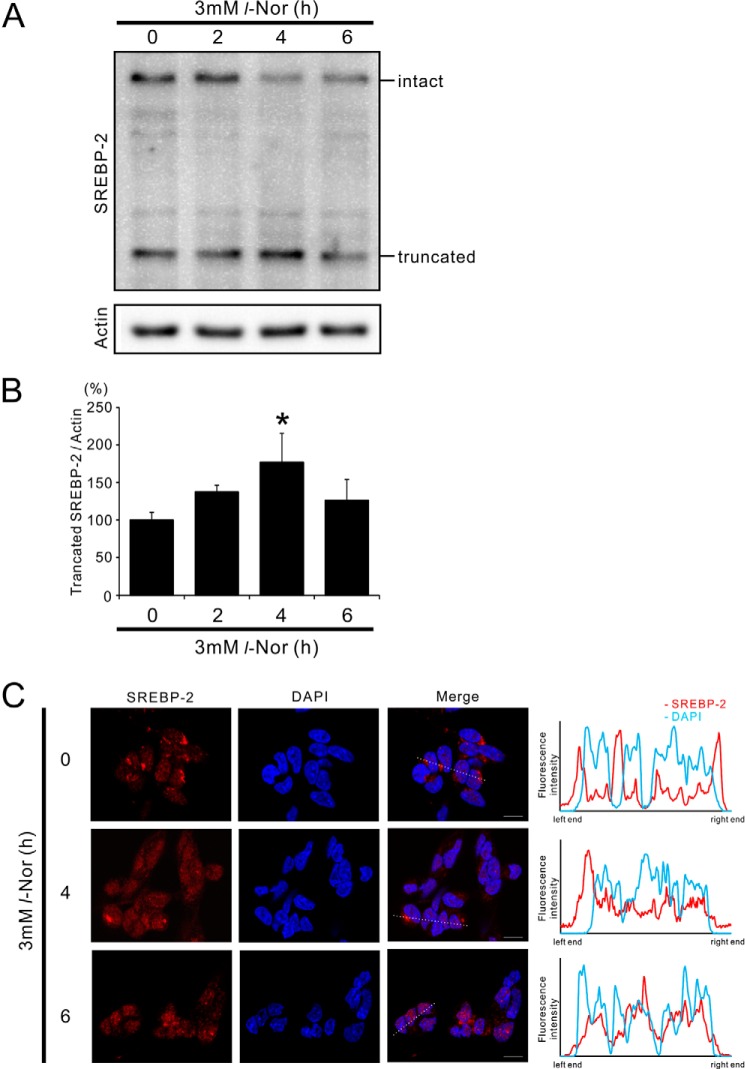
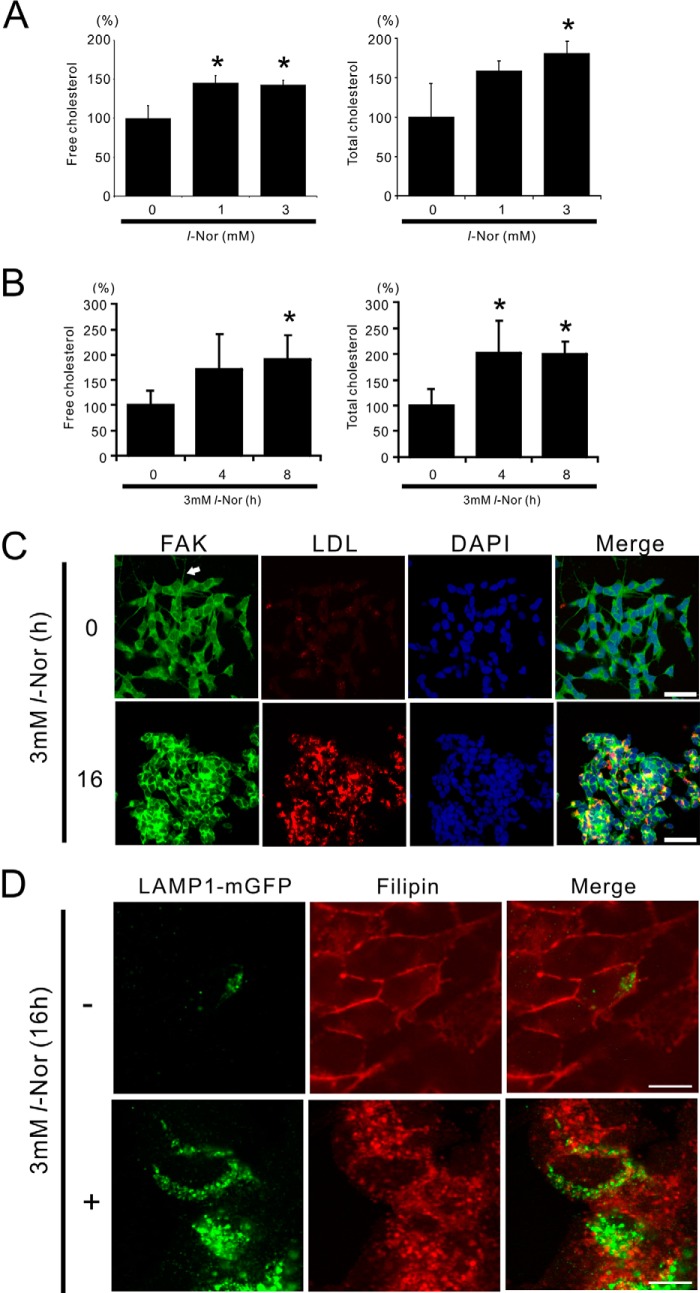
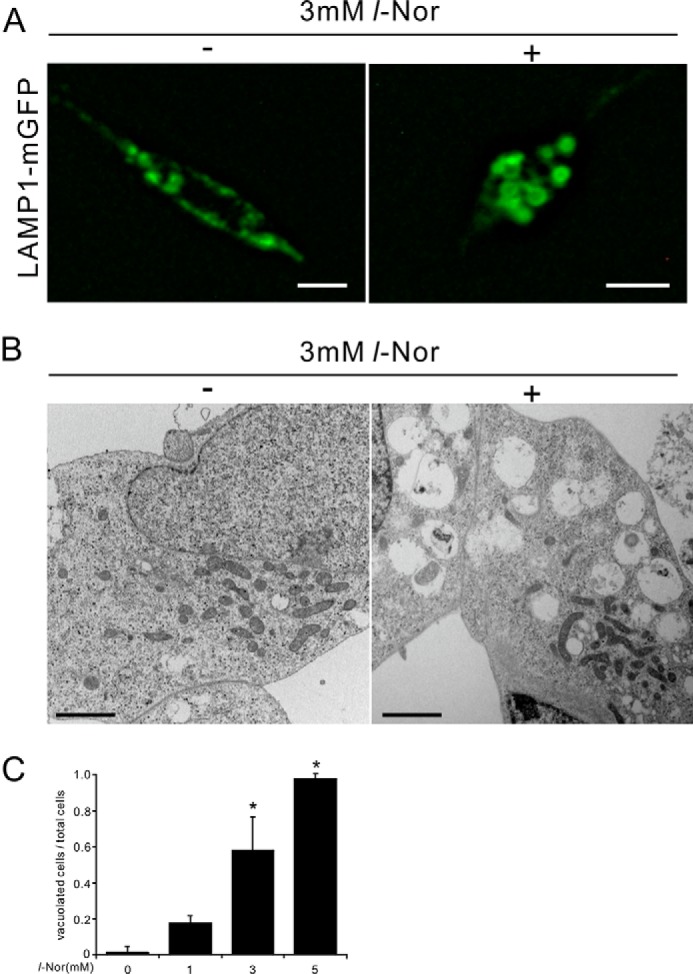
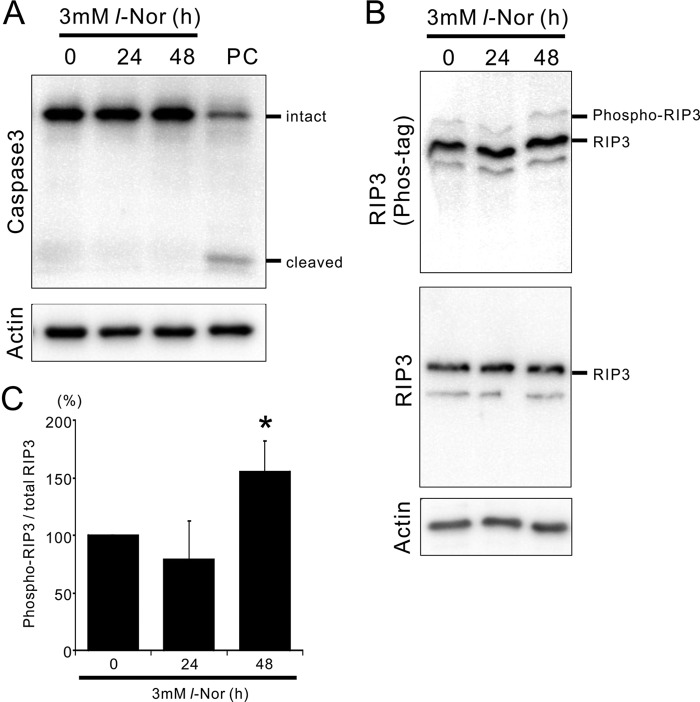
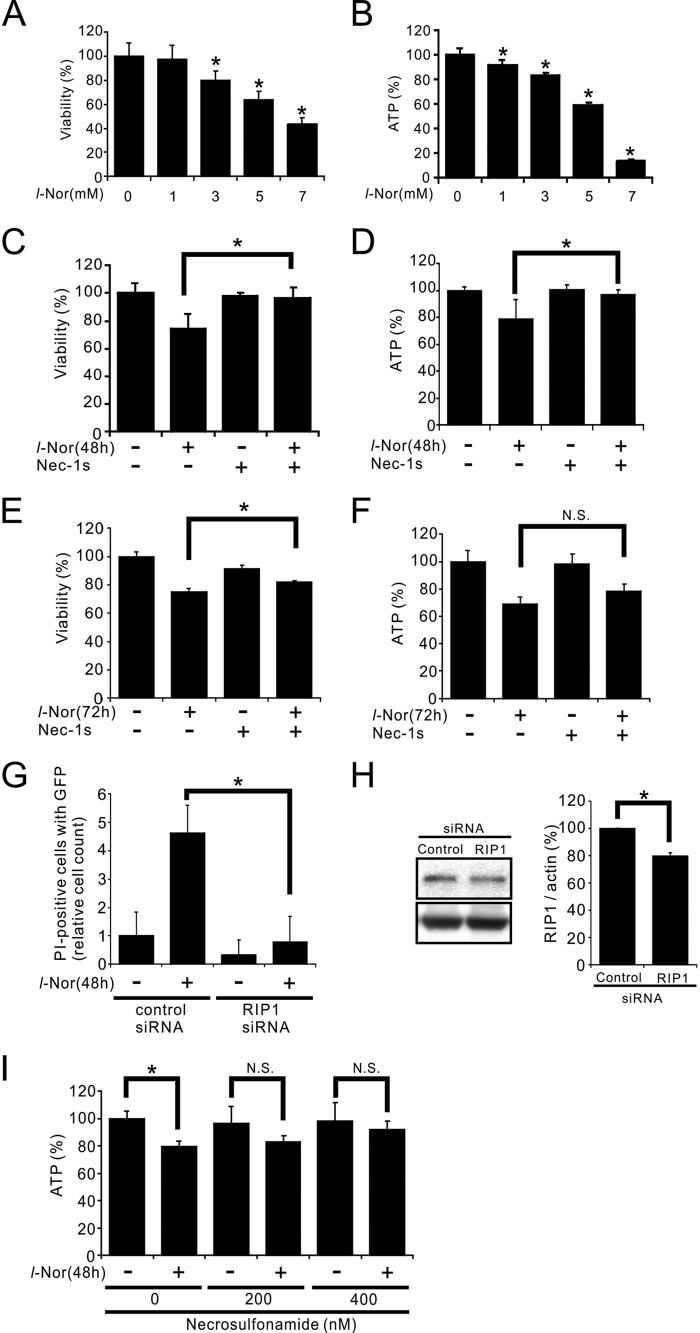
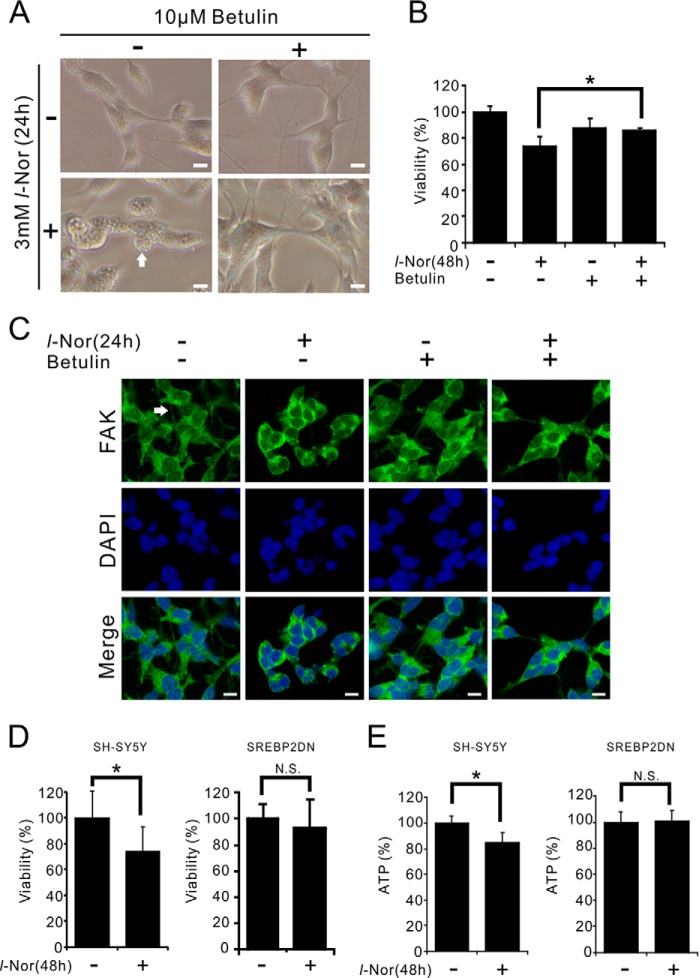
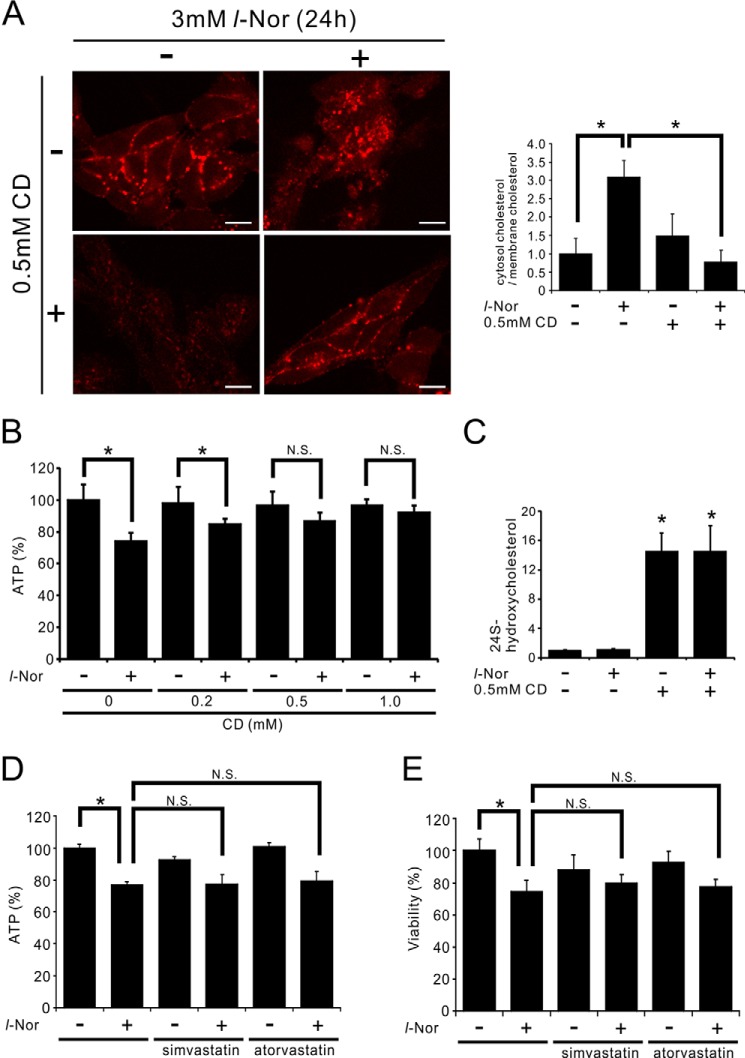
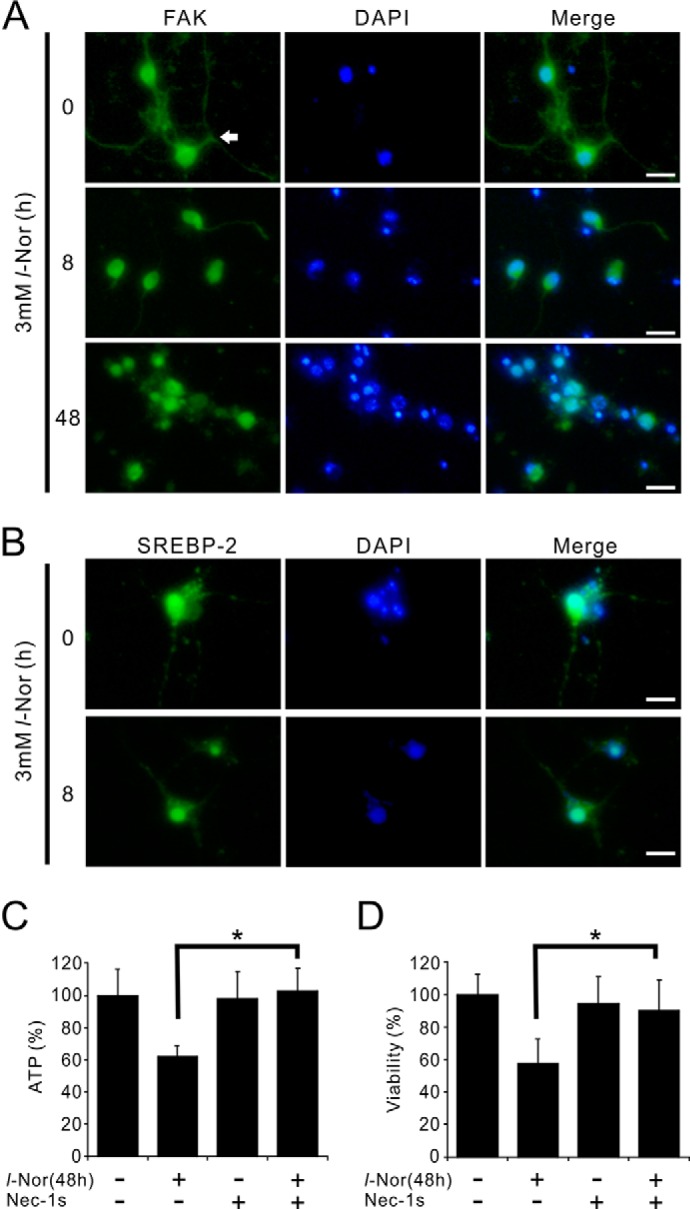
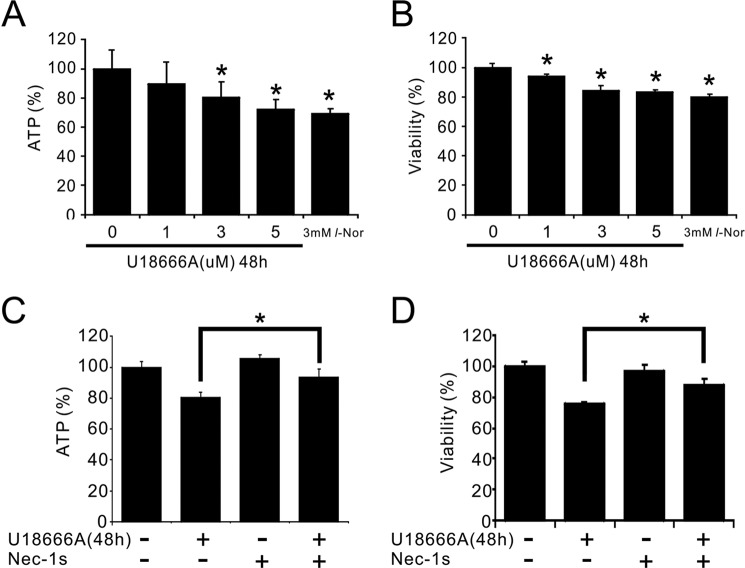
Aberrant cellular accumulation of cholesterol is associated with neuronal lysosomal storage disorders such as Niemann-Pick disease Type C (NPC). We have shown previously that l-norephedrine (l-Nor), a sympathomimetic amine, induces necrotic cell death associated with massive cytoplasmic vacuolation in SH-SY5Y human neuroblastoma cells. To reveal the molecular mechanism underling necrotic neuronal cell death caused by l-Nor, we examined alterations in the gene expression profile of cells during l-Nor exposure. DNA microarray analysis revealed that the gene levels for cholesterol transport (LDL receptor and NPC2) as well as cholesterol biosynthesis (mevalonate pathway enzymes) are increased after exposure to 3 mm l-Nor for ∼6 h. Concomitant with this observation, the master transcriptional regulator of cholesterol homeostasis, SREBP-2, is activated by l-Nor. The increase in cholesterol uptake as well as biosynthesis is not accompanied by an increase in cholesterol in the plasma membrane, but rather by aberrant accumulation in cytoplasmic compartments. We also found that cell death by l-Nor can be suppressed by nec-1s, an inhibitor of a regulated form of necrosis, necroptosis. Abrogation of SREBP-2 activation by the small molecule inhibitor betulin or by overexpression of dominant-negative SREBP-2 efficiently reduces cell death by l-Nor. The mobilization of cellular cholesterol in the presence of cyclodextrin also suppresses cell death. These results were also observed in primary culture of striatum neurons. Taken together, our results indicate that the excessive uptake as well as synthesis of cholesterol should underlie neuronal cell death by l-Nor exposure, and suggest a possible link between lysosomal cholesterol storage disorders and the regulated form of necrosis in neuronal cells.

Keywords: DNA microarray; SREBP-2; cell death; cholesterol; necroptosis; neuroblastoma; norephedrine; toxicology; transcription regulation.


Figures

FIGURE 1.
FIGURE 1.
Increased expression of the genes for cholesterol synthesis, uptake, and transport in SH-SY5Y cells exposed to l-Nor. A, pathway of cholesterol biosynthesis. B and C, increased expression of the genes for cholesterol biosynthesis (B) as well as uptake and transport (C). The cells were treated with 3 mm l-Nor for 2, 4, or 6 h, and the relative expression levels of the genes to that of β-actin were evaluated by qPCR. Data are shown as mean ± S.D. (n = 3). Essentially the same results were obtained in two independent experiments and a typical result is shown. *, p < 0.05 versus 0 h. NPC2, Niemann-Pick disease type C2.
FIGURE 2.
FIGURE 2.
Activation of SREBP-2 in SH-SY5Y cells exposed with l-Nor. A, processing of SREBP-2 into its active form in l-Nor-treated SH-SY5Y cells. The cells were treated with 3 mm l-Nor for the indicated time periods and the cell lysates were subjected to immunoblot analysis using anti-SREBP-2 antibody. Processing of SREBP-2 from its inactive precursor form (intact) to truncated active form (truncated) is shown. Actin served as a loading control. Typical result from four independent experiments is shown. B, increased levels of truncated active SREBP-2 relative to actin in l-Nor-treated SH-SY5Y cells. Data are shown as mean ± S.D. from four experiments (n = 4). *, p < 0.05 versus 0 h. C, nuclear translocation of SREBP-2 in response to l-Nor stimulation. The cells were treated with 3 mm l-Nor for 0–6 h and subjected to immunofluorescence analysis with anti-SREBP-2 antibody and Alexa 549-labeled secondary antibody (red). Nuclei were also counterstained with DAPI (blue). Typical result from two experiments is shown. Right panels show fluorescence intensity plots along the dotted lines shown in fluorescence images. Scale bar, 10 μm.
FIGURE 3.
FIGURE 3.
Increased cholesterol levels in SH-SY5Y cells exposed to l-Nor. A and B, l-Nor increases cellular free and total cholesterol levels in SH-SY5Y cells. The cells were treated with 0, 1, or 3 mm l-Nor for 24 h (A) or 3 mm l-Nor for 0, 4, and 8 h (B), and the levels of cellular free and total cholesterol were determined by GC-MS. Cellular protein levels were also determined. Levels of cellular free (left panels) and total (right panels) cholesterol relative to cellular proteins are shown. Data are shown as mean ± S.D. (n = 3). Essentially the same results were obtained in two independent experiments and a typical result is shown. *, p < 0.05 versus 0 mm. C, l-Nor facilitates LDL uptake. The cells were incubated with a fluorescence dye-labeled LDL (LDL-DyLight 549, red) for 4 h and treated with 3 mm l-Nor for a further 16 h. The cells were also incubated with anti-FAK antibody to visualize neuronal projections and DAPI to stain the nucleus just before observation under confocal fluorescence microscopy. A typical result from two independent experiments is shown. Arrow indicates neurite-like protrusion. Scale bar, 50 μm. D, l-Nor causes the intracellular accumulation of free cholesterol. The cells were transfected with LAMP1-mGFP, stimulated with l-Nor (3 mm, 16 h), and stained with filipin dye. To show the colocalization of cholesterol and LAMP1 (green), the fluorescence from filipin was converted digitally from blue to red. A typical result from three independent experiments is shown. Scale bar, 10 μm.
FIGURE 4.
FIGURE 4.
Lysosomal vacuolation in SH-SY5Y cells exposed to l-Nor. A, dilation of lysosomes in l-Nor-exposed SH-SY5Y cells. The cells were transfected with LAMP1-mGFP vector and treated with or without 3 mm l-Nor for 24 h. Fluorescence microscopy indicates LAMP1-positive membrane-closed vacuoles, suggesting lysosomal vacuolation. Scale bar, 10 μm. B, representative images of transmission electron micrographs of SH-SY5Y cells treated with or without l-Nor (3 mm, 24 h). Numerous vacuoles, often containing cytoplasmic contents in their structures, were observed in l-Nor-treated cells. Scale bar, 2 μm. C, l-Nor-exposed SH-SY5Y cells contain large vacuoles derived from lysosomes. SH-SY5Y cells stably expressing LAMP1-mGFP were treated with 0, 1, 3, or 5 mm l-Nor for 24 h and the ratios of the cells containing large vacuoles (>2 μm in diameter) to total cells were calculated. Data are shown as mean ± S.D. (n = 4). Essentially the same results were obtained in two independent experiments and a typical result is shown. *, p < 0.05 versus 0 mm.
FIGURE 5.
FIGURE 5.
Activation of the necroptosis mediator RIP3 in SH-SY5Y cells exposed to l-Nor. A, caspase-3 is not activated by l-Nor. The cells were treated with 3 mm l-Nor for 24 or 48 h and subjected to immunoblot analysis using caspase 3. PC, positive control of apoptotic cells. B, increased phosphorylation of RIP3 in l-Nor-treated cells. The cells were treated with 3 mm l-Nor for 24 or 48 h and subjected to immunoblot analysis. Phosphorylated and non-phosphorylated forms of RIP3 were resolved by Phos-tag SDS-PAGE (upper panel). Total (phospho- and nonphospho-) RIP3 levels were also examined by conventional SDS-PAGE (middle panel). Actin served as a loading control (lower panel). C, increased levels of phospho-RIP3 in l-Nor-treated cells. Levels of phosphorylated RIP3 relative to total RIP3 are shown. Data are shown as mean ± S.D. from three independent experiments (n = 5). *, p < 0.05 versus 0 h.
FIGURE 6.
FIGURE 6.
SH-SY5Y cell death by l-Nor is suppressed by necroptosis inhibitors. A-F, decreases in cell viabilities (A, C, and E) and intracellular ATP levels (B, D, and F) by l-Nor treatment, and their attenuation by a necroptosis inhibitor, nec-1s. The cells were treated with 0–7 mm l-Nor or nec-1s or both for 48 h (A–D) or 3 mm l-Nor and/or nec-1s for 72 h (E and F). Cell viabilities were determined by a modified MTT assay (A, C, and E). Intracellular ATP levels were determined by luciferase assay (B, D, and F). Data are shown as mean ± S.D. from one experiment (n = 8 for A-D; n = 6 for E and F). Experiments were repeated two (A and B) and three (C and D) times with the same results. *, p < 0.05. N.S., not significant. G, necrotic cell death by l-Nor was attenuated by the RNAi-mediated knockdown of RIP1. The cells were transfected with control or RIP1-targeted siRNA together with a GFP-expression vector to visualize cells successfully transfected. The cells were then incubated with l-Nor (3 mm, 48 h) and stained with propidium iodide (PI). The relative numbers of cells positive for both PI and GFP fluorescences are shown. H, immunoblot analysis of RIP1. Data are shown as mean ± S.D. (n = 3). Essentially the same results were obtained in two independent experiments and a typical result is shown. *, p < 0.05. I, decrease in intracellular ATP levels and its attenuation by an MLKL inhibitor, necrosulfonamide. The cells were treated with the indicated concentrations of necrosulfonamide, followed by exposure to 3 mm l-Nor for 48 h. Intracellular ATP levels were determined by luciferase assay. Data are shown as mean ± S.D. (n = 8). Essentially the same results were obtained in two independent experiments and a typical result is shown. *, p < 0.05. N.S., not significant.
FIGURE 7.
FIGURE 7.
SREBP-2 is involved in necroptosis of l-Nor-treated SH-SY5Y cells. A–C, the SREBP-2 inhibitor betulin suppressed l-Nor-induced vacuolation, neurite retraction, and cell death. The cells were treated with 10 μm betulin or 3 mm l-Nor or both for 24–48 h. Representative phase-contrast images of cells 24 h after treatment (A), and cell viabilities 48 h after treatment (B) are shown. Data are shown as mean ± S.D. from two experiments (n = 5). *, p < 0.05. N.S., not significant. Scale bar, 10 μm. Arrow indicates cytoplasmic vacuoles. C, betulin attenuates the retraction of neurite-like projections caused by l-Nor. The cells were incubated with anti-FAK antibody to visualize neuronal projections and DAPI to stain the nucleus and observed under confocal fluorescence microscopy. Scale bar, 10 μm. Arrow indicates neurite-like projection. D and E, dominant-negative SREBP-2 suppressed l-Nor-induced cell death. SH-SY5Y cells stably expressing dominant-negative SREBP-2 (SREBP2DN) were treated with 3 mm l-Nor for 48 h and examined for viability (D) and intracellular ATP levels (E). Parental SH-SY5Y cells were also used as a control. Data are shown as mean ± S.D. from two experiments (n = 16). *, p < 0.05. N.S., not significant.
FIGURE 8.
FIGURE 8.
Suppression of l-Nor-induced SH-SY5Y cell death by post-treatment with a cholesterol-mobilizing reagent. A–C, treatment of SH-SY5Y cells with CD (0.5 mm, 24 h) after l-Nor treatment (3 mm, 24 h) depletes intracellularly accumulated free cholesterol and improves cellular ATP levels. The cells were treated with or without l-Nor (3 mm) in serum-containing medium for 24 h, followed by treatment with or without CD in serum-free medium for an additional 24 h. Then, the cells were stained with filipin and observed under fluorescence microscopy (A). A typical result from two independent experiments is shown. Percentages of filipin fluorescences observed in cytosol and plasma membrane are also shown in right panel. Data are shown as mean ± S.D. from two experiments (n = 7). *, p < 0.05. Intracellular levels of ATP (B) and extracellular levels of 24(S)-hydroxycholesterol (C) were also determined (n = 7 for B, n = 5 for C). D and E, simvastatin and atorvastatin scarcely affect l-Nor-induced loss of ATP and viabilities. The cells were treated with 3 mm l-Nor and/or simvastatin or atorvastatin (10 μm) for 48 h. Data are shown as mean ± S.D. (n = 7). Essentially the same results were obtained in two independent experiments and a typical result is shown. *, p < 0.05. N.S., not significant.
FIGURE 9.
FIGURE 9.
Nec-1s suppresses death of primary mouse striatal neurons caused by l-Nor. A, retraction of neurites of striatal neurons by l-Nor. Primary culture of mouse striatal neurons was treated with l-Nor (3 mm, 8 or 48 h) and the cells were stained with anti-FAK antibody (green) and observed under fluorescence microscopy. Arrow indicates neurite. B, nuclear translocation of SREBP-2 in the striatal neurons by l-Nor. The cells were stained with anti-SREBP-2 antibody (green) and observed under fluorescence microscopy. Nuclei were also stained with DAPI (blue). C, l-Nor-induced loss of ATP and viabilities in striatal neurons and its suppression by nec-1s. The cells were treated with l-Nor (3 mm), nec-1s, or both for 48 h. Intracellular ATP levels (C) and viabilities (D) were determined by luciferase assay. Data are shown as mean ± S.D. (n = 6). Essentially the same results were obtained in two independent experiments and a typical result is shown. *, p < 0.05.
FIGURE 10.
FIGURE 10.
Suppression of U18666A-induced cell death by nec-1s. Concentration-dependent decreases in intracellular ATP levels (A) and cell viabilities (B) by U18666A treatment, and their attenuation by the necroptosis inhibitor, nec-1s (C and D). The cells were treated with 1–5 μm U18666A or nec-1s or both for 48 h. Intracellular ATP levels were determined by luciferase assay (A and C). Cell viabilities were determined by a modified MTT assay (B and D). Data are shown as mean ± S.D. from two experiments (n = 13 for A and B; n = 6 for C and D). *, p < 0.05.

Similar articles

Cited by

References

    1. Pentel P. (1984) Toxicity of over-the-counter stimulants. JAMA 252, 1898–1903 - PubMed
    1. Bravo E. L. (1988) Phenylpropanolamine and other over-the-counter vasoactive compounds. Hypertension 11, II7–10 - PubMed
    1. Kernan W. N., Viscoli C. M., Brass L. M., Broderick J. P., Brott T., Feldmann E., Morgenstern L. B., Wilterdink J. L., and Horwitz R. I. (2000) Phenylpropanolamine and the risk of hemorrhagic stroke. N. Engl. J. Med. 343, 1826–1832 - PubMed
    1. Yen M., and Ewald M. B. (2012) Toxicity of weight loss agents. J. Med. Toxicol. 8, 145–152 - PMC - PubMed
    1. Funakoshi T., Aki T., Unuma K., and Uemura K. (2013) Lysosome vacuolation disrupts the completion of autophagy during norephedrine exposure in SH-SY5Y human neuroblastoma cells. Brain Res. 1490, 9–22 - PubMed

MeSH terms