. 2016 Dec 2;291(49):25578-25590.
doi: 10.1074/jbc.M116.752501. Epub 2016 Oct 18.

An Intronic Enhancer Element Regulates Angiotensin II Type 2 Receptor Expression during Satellite Cell Differentiation, and Its Activity Is Suppressed in Congestive Heart Failure

Affiliations

An Intronic Enhancer Element Regulates Angiotensin II Type 2 Receptor Expression during Satellite Cell Differentiation, and Its Activity Is Suppressed in Congestive Heart Failure

Tadashi Yoshida et al. J Biol Chem. .

Abstract

Patients with advanced congestive heart failure (CHF) or chronic kidney disease often have increased angiotensin II (Ang II) levels and cachexia. We previously demonstrated that Ang II, via its type 1 receptor, causes muscle protein breakdown and apoptosis and inhibits satellite cell (SC) proliferation and muscle regeneration, likely contributing to cachexia in CHF and chronic kidney disease. In contrast, Ang II, via its type 2 receptor (AT2R) expression, is robustly induced during SC differentiation, and it potentiates muscle regeneration. To understand the mechanisms regulating AT2R expression and its potential role in muscle regeneration in chronic diseases, we used a mouse model of CHF and found that muscle regeneration was markedly reduced and that this was accompanied by blunted increase of AT2R expression. We performed AT2R promoter reporter analysis during satellite cell differentiation and found that the 70 bp upstream of the AT2R transcription start site contain a core promoter region, and regions upstream of 70 bp to 3 kbp are dispensable for AT2R induction. Instead, AT2R intron 2 acts as a transcriptional enhancer during SC differentiation. Further deletion/mutation analysis revealed that multiple transcription factor binding sites in the +286/+690 region within intron 2 coordinately regulate AT2R transcription. Importantly, +286/+690 enhancer activity was suppressed in CHF mouse skeletal muscle, suggesting that AT2R expression is suppressed in CHF via inhibition of AT2R intronic enhancer activity, leading to lowered muscle regeneration. Thus targeting intron 2 enhancer element could lead to the development of a novel intervention to increase AT2R expression in SCs and potentiate skeletal muscle regenerative capacity in chronic diseases.

Keywords: angiotensin II; heart failure; muscle regeneration; skeletal muscle; stem cells; transcription enhancer.


Figures

FIGURE 1.
FIGURE 1.
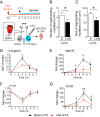
CHF suppresses skeletal muscle regenerative capacity and AT2R induction. A, experimental design. LAD ligation surgery was performed in C57BL/6 mice, and CTX was injected in gastrocnemius muscles 4 weeks after the surgery. The contralateral muscles were used as non-injury control. Muscles were harvested 3, 5, and 7 days after the CTX injection, and regenerating myofiber number (B) and size (C) and the expression of myogenin (D), eMyHC (E), AT1R (F), and AT2R (G) were analyzed by quantitative RT-PCR. n = 5–6; mean ± S.E.; *, p < 0.05; **, p < 0.01 between sham versus LAD.
FIGURE 2.
FIGURE 2.
AT2R promoter activity during myoblast differentiation. Mouse AT2R genomic DNA sequence upstream of TSS (+1) together with exon 1, intron 1, exon 2, intron 2, and the 5′-UTR of exon 3 were subcloned into the pGL4.10[luc2] vector. Four vectors were generated with different sized 5′ sequence (3000, 2000, 1000, and 500 bp). These vectors were transfected into SCs and C2C12 myoblasts. After 2 days of transfection, cells were induced to differentiate and harvested on days 0–3, and luciferase activity was measured using Renilla luciferase as an internal control. Mean ± S.E., n = 4; *, p < 0.05; **, p < 0.01 compared with d0. Western blotting images show representative AT2R protein induction in primary cultured SCs and C2C12 myoblasts during differentiation.
FIGURE 3.
FIGURE 3.
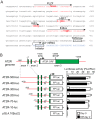
AT2R 5′–promoter analysis during myoblast differentiation. A, DNA sequence of AT2R promoter (−500/+40). Four transcription factor-binding sites were predicted by TRANSFAC database search as follows: promyelocytic leukemia zinc finger protein (PLZF) at −479, heat shock factor protein-1 (HSF1) at −282, kidney, ischemia, and developmentally regulated gene-3 (KID3) at −240, and E-box at −170. TATA box and initiator element are located at −30/−23 and +3/+7, respectively. B, series of AT2R promoter reporter vectors were constructed and analyzed by luciferase reporter assay in C2C12 myoblasts/myotubes. All the AT2R luciferase reporter vectors contain exon 1, intron 1, exon 2, intron 2, and the 5′-UTR of exon 3. Numbers indicate the distance from the AT2R TSS (+1). Cells were induced to differentiate 2 days after plasmid transfection, and harvested before (day 0) and 2 days after differentiation (Diff). Luciferase activity was measured using Renilla luciferase as an internal control. Mean ± S.E., n = 4; **, p < 0.01.
FIGURE 4.
FIGURE 4.
AT2R intron 2 regulates AT2R transcription during myoblast differentiation. A series of AT2R promoter reporter vectors were constructed and analyzed by luciferase reporter assay in C2C12 myoblasts/myotubes. AT2R-70-luc vector contains −70/+1503 DNA segment of AT2R upstream of firefly luciferase. Intron 1 and intron 2 were deleted from AT2R-70-luc vector to generate AT2R-70-ΔInt1-luc and AT2R-70-ΔInt2-luc vector. Both intron 1 and 2 were removed from AT2R-70-ΔInt1/2-luc vector. Cells were induced to differentiate 2 days after plasmid transfection and harvested before (day 0) and 2 days after differentiation (Diff). Luciferase activity was measured using Renilla luciferase as an internal control. Mean ± S.E., n = 4; **, p < 0.01 compared with d0 control; §§, p < 0.01 compared with AT2R-70-luc d2.
FIGURE 5.
FIGURE 5.
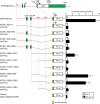
Analysis of transcriptional enhancer activity in AT2R intron 2. A series of luciferase reporter vectors with minimal promoter and AT2R intron 2 sequence were constructed and analyzed by luciferase reporter assay in C2C12 myoblasts/myotubes. Different segments from the AT2R promoter/enhancer region were subcloned into pGL4.23[luc2/minP] vector, which contains 31-bp minimal promoter sequence upstream of firefly luciferase. The numbers indicate the location of AT2R promoter/enhancer. AT2R-500-luc and pGL4.23[luc2/minP] were used as positive and negative controls, respectively. Cells were induced to differentiate 2 days after plasmid transfection and harvested before (day 0) and 2 days after differentiation (Diff). Luciferase activity was measured using Renilla luciferase as an internal control. Mean ± S.E., n = 4; **, p < 0.01 compared with d0 control.
FIGURE 6.
FIGURE 6.
Analysis of transcriptional enhancer activity in +286/+690 sequence of AT2R intron 2. A series of luciferase reporter vectors with minimal promoter and AT2R intron 2 sequence from the +286/+690 region were constructed and analyzed by luciferase reporter assay in C2C12 myoblasts/myotubes. Different segments from AT2R promoter/enhancer region were subcloned into pGL4.23[luc2/minP] vector, which contains 31-bp minimal promoter sequence upstream of firefly luciferase. The numbers indicate the location of AT2R promoter/enhancer. AT2R (+286/+690)-minP-luc and pGL4.23[luc2/minP] were used as positive and negative control, respectively. Cells were induced to differentiate 2 days after plasmid transfection and harvested before (day 0) and 2 days after differentiation (Diff). Luciferase activity was measured using Renilla luciferase as an internal control. Mean ± S.E., n = 4; *, p < 0.05 compared with d0 control; §§, p < 0.01 compared with AT2R (+286/+690)-minP-luc d2.
FIGURE 7.
FIGURE 7.
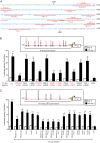
Analysis of putative transcription factor-binding sites in AT2R intron 2. A, AT2R +241/+720 DNA sequence is shown. Green characters indicate part of the exon 2 sequence, and +286/+690 sequence is shown in blue. Putative transcription factor-binding sites predicted by TRANSFAC are shown in red as follows: POU domain, class 3, transcription factor 2 (POU3F2, +302 and +404); FOXD3 (+305 and +320); octamer transcription factor-1 (OCT-1, +318); v-MYB (+375); hepatocyte nuclear factor 4α (HNF-4α, +429), FOXJ2 (+469); FOXL1 (+470); FOXI1 (+471); FOXF1 (+471); GATA (+472); hepatocyte nuclear factor 3β (HNF-3β, +520); PAX-4 (+531); MYOD (+537); ecotropic virus integration site 1 protein homolog (EVI-1, +478 and +590); NK2 transcription factor related, locus 5 (NKX2–5, +631); activator protein-1 (AP-1) and cartilage paired-class homeoprotein 1 (CART-1, +648). Five transcription factor binding sites overlaps at the FOXJ2 site (asterisk): FOXl1 (+470/+486); FOXI1 (+471/+483); FOXF1 (+471/+483); GATA (+472/+482); EVI-1 (+478/+492). B, predicted transcription factor binding sites shown in A were deleted from the AT2R (+286/+690)-minP-luc vector, and luciferase activity was analyzed in C2C12 myoblasts/myotubes. The vector map indicates the location of the deletion. In each vector, the nucleotides indicated by red lines in A were deleted. It is of note that the deletion of POU3F2 (+302/+317), OCT-1 (+318/+330), PAX-4 (+531/+559), and NKX2–5 (+631/+640) also delete FOXD3 (+305/+316), FOXD3 (+320/+329), MYOD (+537/+548), and AP-1 (+635/+640) sites, respectively. AT2R (+286/+690)-minP-luc and pGL4.23[luc2/minP] were used as positive and negative controls, respectively. Cells were induced to differentiate 2 days after plasmid transfection and harvested before (day 0) and 2 days after differentiation. Luciferase activity was measured using Renilla luciferase as an internal control. C, AT2R (+286/+690)-minP-luc vectors with the indicated double deletions at the predicted transcription factor-binding sites were generated, and luciferase activity was analyzed in C2C12 myoblasts/myotubes as in B. Mean ± S.E., n = 4; *, p < 0.05, and **, p < 0.01, compared with d0 control; §, p < 0.05 compared with AT2R (+286/+690)-minP-luc d2.
FIGURE 8.
FIGURE 8.
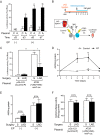
AT2R intron 2 enhancer activity during muscle regeneration in CHF. A, AT2R intron 2 (+286/+690) enhancer activity was measured during skeletal muscle regeneration in vivo. AT2R (+286/+690)-minP-luc (A) and control pGL4.23[luc2/minP] (C) vectors were electroporated (EP) into C57BL/6 mouse gastrocnemius muscles and harvested on d3, d5, and d7. Muscles injected with the vectors without electric pulse were used as non-injury control. Luciferase activity was measured using Renilla luciferase as an internal control. B, experimental design of luciferase activity measurement in CHF mice. LAD ligation surgery was performed in C57BL/6 mice, and AT2R (+286/+690)-minP-luc and control pGL4.23[luc2/minP] vectors were electroporated into gastrocnemius muscles 4 weeks after the surgery. Muscles were harvested 5 days after the electroporation, and luciferase activity was measured. C, luciferase activity in gastrocnemius muscles harvested from B. Sham surgery was used as a control, and luciferase activity was measured using Renilla luciferase as an internal control. D, electroporation-mediated cell death was measured by Cell Death Detection ELISA after 3, 5, and 7 days of electroporation. Measurement was normalized to protein amount. E, cell death was measured after LAD ligation surgery and electroporation in the gastrocnemius muscles harvested in B. Non-electroporation muscles were used as control. F, Renilla luciferase activity was shown in muscles from C and normalized to protein amount. Mean ± S.E., n = 6; *, p < 0.05; **, p < 0.01; ns, not significant; ND, not detected.

Similar articles

Cited by

References

    1. Penafuerte C. A., Gagnon B., Sirois J., Murphy J., MacDonald N., and Tremblay M. L. (2016) Identification of neutrophil-derived proteases and angiotensin II as biomarkers of cancer cachexia. Br. J. Cancer 114, 680–687 - PMC - PubMed
    1. Anker S. D., Negassa A., Coats A. J., Afzal R., Poole-Wilson P. A., Cohn J. N., and Yusuf S. (2003) Prognostic importance of weight loss in chronic heart failure and the effect of treatment with angiotensin-converting-enzyme inhibitors: an observational study. Lancet 361, 1077–1083 - PubMed
    1. Brink M., Wellen J., and Delafontaine P. (1996) Angiotensin II causes weight loss and decreases circulating insulin-like growth factor I in rats through a pressor-independent mechanism. J. Clin. Invest. 97, 2509–2516 - PMC - PubMed
    1. Song Y.-H., Li Y., Du J., Mitch W. E., Rosenthal N., and Delafontaine P. (2005) Muscle-specific expression of IGF-1 blocks angiotensin II-induced skeletal muscle wasting. J. Clin. Invest. 115, 451–458 - PMC - PubMed
    1. Yoshida T., Semprun-Prieto L., Sukhanov S., and Delafontaine P. (2010) IGF-1 prevents ANG II-induced skeletal muscle atrophy via Akt- and Foxo-dependent inhibition of the ubiquitin ligase atrogin-1 expression. Am. J. Physiol. Heart Circ Physiol. 298, H1565–H1570 - PMC - PubMed

Substances