

Marsdenia tenacissimae extraction (MTE) inhibits the proliferation and induces the apoptosis of human acute T cell leukemia cells through inactivating PI3K/AKT/mTOR signaling pathway via PTEN enhancement
- PMID: 27756877
- PMCID: PMC5347737
- DOI: 10.18632/oncotarget.12654
Marsdenia tenacissimae extraction (MTE) inhibits the proliferation and induces the apoptosis of human acute T cell leukemia cells through inactivating PI3K/AKT/mTOR signaling pathway via PTEN enhancement
Abstract
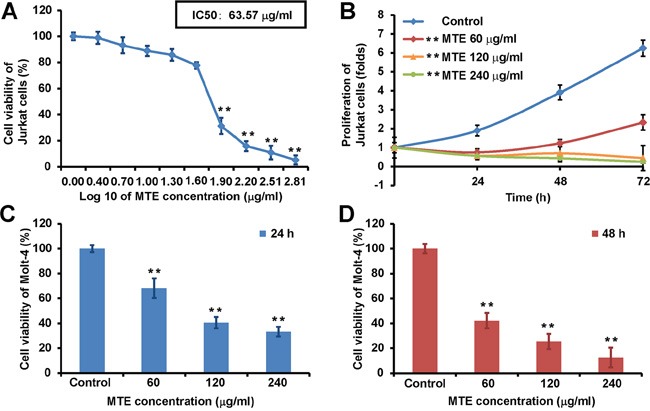
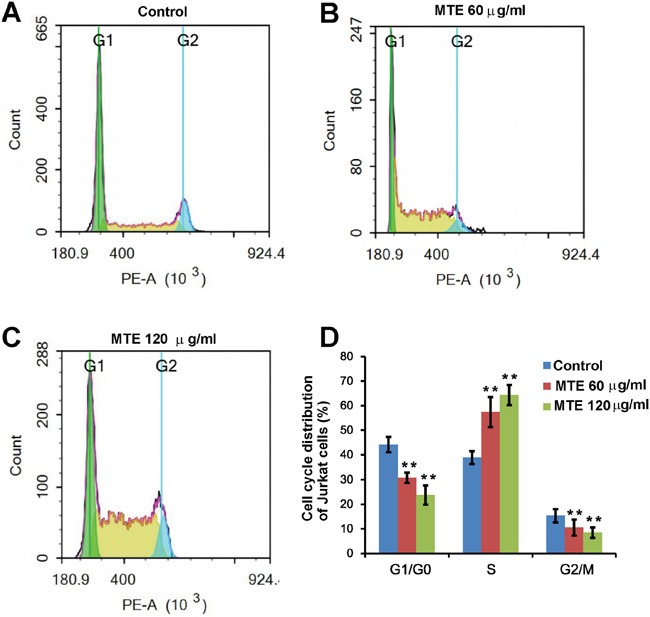
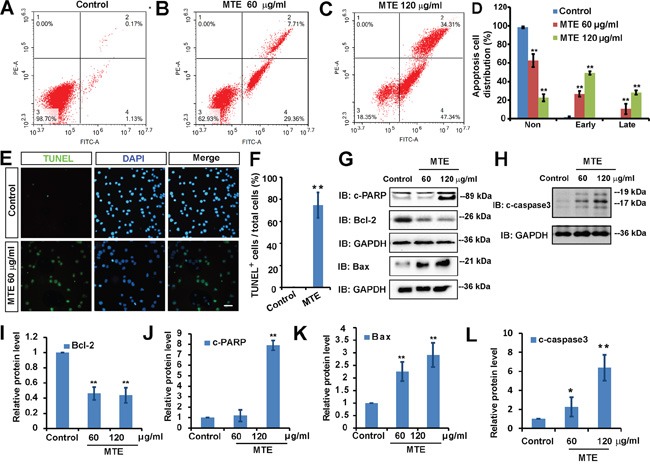
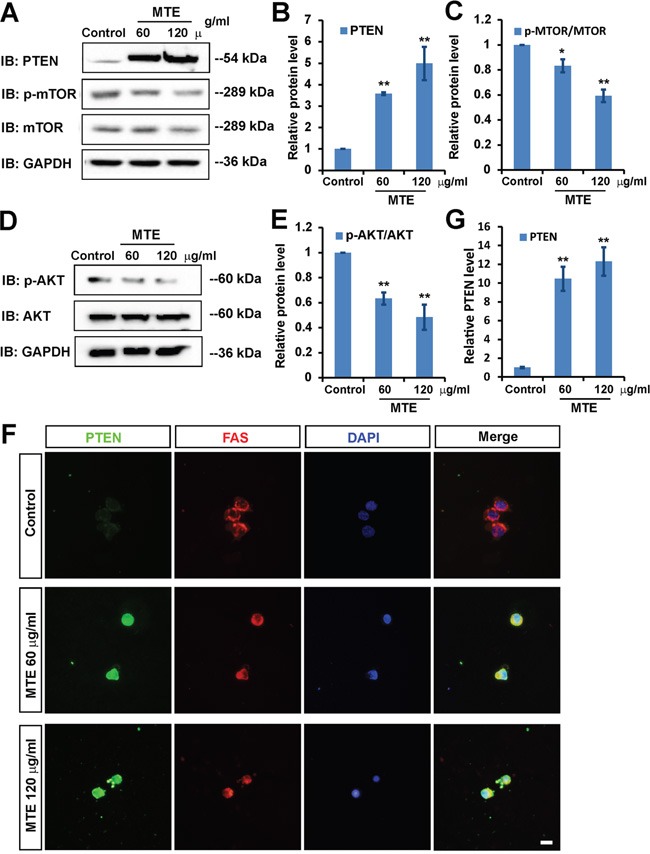
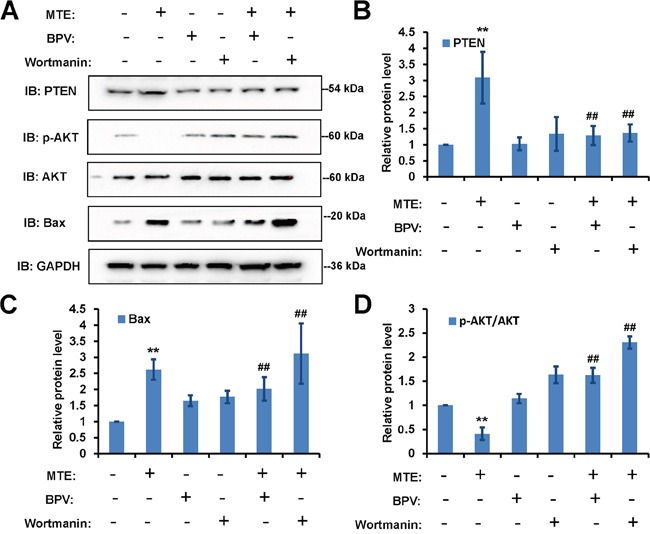
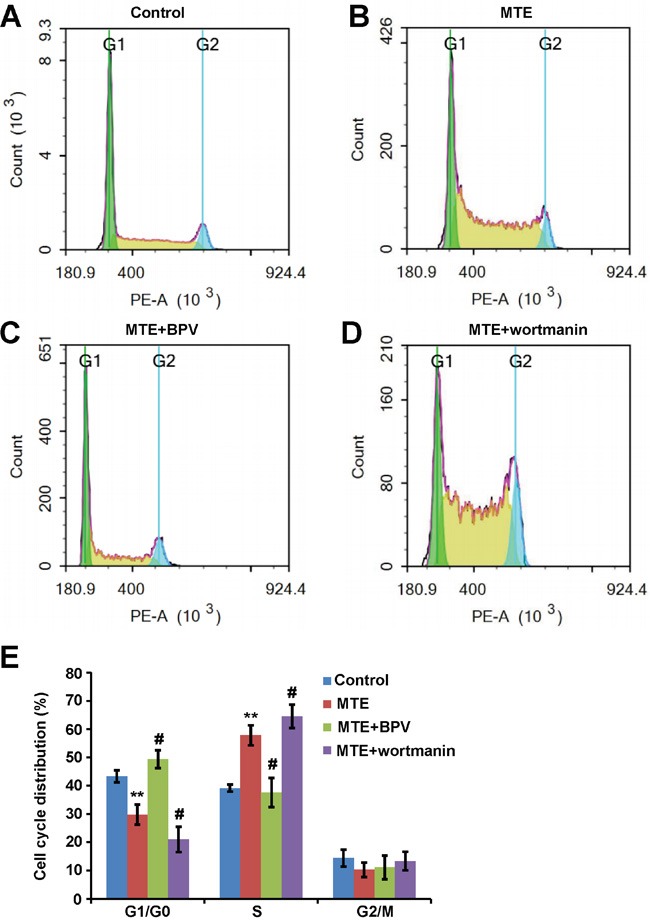
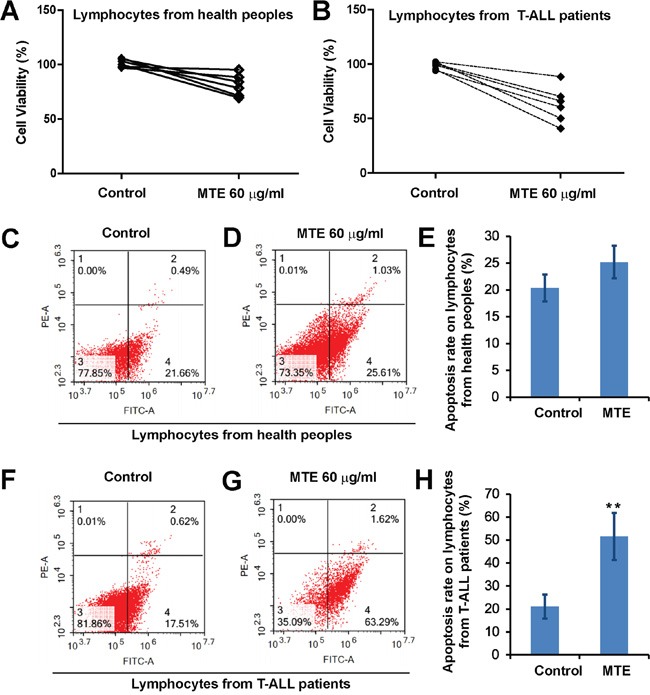
Marsdenia tenacissimae extraction (MTE) as a traditional Chinese herb has long been used to treat some diseases such as tumors in China. However, the potential effectiveness of MTE in leukemia has not yet been fully understood, and the related molecular mechanism is still unknown. In the present study, we aimed to evaluate the effects of MTE on the proliferation and apoptosis of Jurkat cells (T-ALL lines) and lymphocytes from T-ALL (T-cell acute lymphoblastic leukemia) patients. Firstly, CCK8 assays and flow cytometry assays revealed that MTE dose-dependently reduced the proliferation of Jurkat cells by arresting cell cycle at S phase. Secondly, Annexin V-FITC/PI-stained flow cytometry and TUNEL staining assays showed that MTE promoted the apoptosis of Jurkat cells. Mechanistically, MTE enhanced PTEN (phosphatases and tensin homolog) level and inactivated PI3K/AKT/mTOR signaling pathway in Jurkat cells, which mediated the inhibition of cell proliferation by MTE and MTE-induced apoptosis. Finally, MTE significantly inhibited the proliferation and promoted the apoptosis of lymphocytes from T-ALL patients, compared with lymphocytes from healthy peoples. Taken together, these results reveal an unrecognized function of MTE in inhibiting the proliferation and inducing the apoptosis of T-ALL cells, and identify a pathway of PTEN/PI3K/AKT/mTOR for the effects of MTE on leukemia therapy.
Keywords: Marsdenia tenacissimae extraction; PTEN; T-cell acute lymphoblastic leukemia; apoptosis; proliferation.
Conflict of interest statement
The authors declare no conflicts of interest.
Figures

Similar articles
-
Marsdeniae tenacissimae extract (MTE) suppresses cell proliferation by attenuating VEGF/VEGFR2 interactions and promotes apoptosis through regulating PKC pathway in human umbilical vein endothelial cells.Chin J Nat Med. 2016 Dec;14(12):922-930. doi: 10.1016/S1875-5364(17)30017-1. Chin J Nat Med. 2016. PMID: 28262119
-
Marsdenia Tenacissima Extract Inhibits Proliferation and Promotes Apoptosis in Human Ovarian Cancer Cells.Med Sci Monit. 2018 Sep 9;24:6289-6297. doi: 10.12659/MSM.909726. Med Sci Monit. 2018. PMID: 30196309
-
PI3K/AKT/mTOR signaling is involved in (-)-epigallocatechin-3-gallate-induced apoptosis of human pancreatic carcinoma cells.Am J Chin Med. 2013;41(3):629-42. doi: 10.1142/S0192415X13500444. Am J Chin Med. 2013. PMID: 23711146
-
The relevance of PTEN-AKT in relation to NOTCH1-directed treatment strategies in T-cell acute lymphoblastic leukemia.Haematologica. 2016 Sep;101(9):1010-7. doi: 10.3324/haematol.2016.146381. Haematologica. 2016. PMID: 27582570 Free PMC article. Review.
-
NOTCH and phosphatidylinositide 3-kinase/phosphatase and tensin homolog deleted on chromosome ten/AKT/mammalian target of rapamycin (mTOR) signaling in T-cell development and T-cell acute lymphoblastic leukemia.Leuk Lymphoma. 2011 Jul;52(7):1200-10. doi: 10.3109/10428194.2011.564696. Epub 2011 Apr 4. Leuk Lymphoma. 2011. PMID: 21463127 Review.
Cited by
-
Medicinal herbs and bioactive compounds overcome the drug resistance to epidermal growth factor receptor inhibitors in non-small cell lung cancer.Oncol Lett. 2021 Sep;22(3):646. doi: 10.3892/ol.2021.12907. Epub 2021 Jul 8. Oncol Lett. 2021. PMID: 34386068 Free PMC article. Review.
-
Effect of 5-Aza-2'-deoxycytidine on T-cell acute lymphoblastic leukemia cell biological behaviors and PTEN expression.Cytojournal. 2024 Oct 11;21:36. doi: 10.25259/Cytojournal_31_2024. eCollection 2024. Cytojournal. 2024. PMID: 39563669 Free PMC article.
-
C21 steroid-enriched fraction refined from Marsdenia tenacissima inhibits hepatocellular carcinoma through the coordination of Hippo-Yap and PTEN-PI3K/AKT signaling pathways.Oncotarget. 2017 Nov 30;8(66):110576-110591. doi: 10.18632/oncotarget.22833. eCollection 2017 Dec 15. Oncotarget. 2017. PMID: 29299170 Free PMC article.
-
Recombinant Human IFNα-2b Response Promotes Vaginal Epithelial Cells Defense against Candida albicans.Front Microbiol. 2017 Apr 20;8:697. doi: 10.3389/fmicb.2017.00697. eCollection 2017. Front Microbiol. 2017. PMID: 28473823 Free PMC article.
-
Downregulation of microRNA‑21 expression inhibits proliferation, and induces G1 arrest and apoptosis via the PTEN/AKT pathway in SKM‑1 cells.Mol Med Rep. 2018 Sep;18(3):2771-2779. doi: 10.3892/mmr.2018.9255. Epub 2018 Jul 5. Mol Med Rep. 2018. PMID: 30015844 Free PMC article.
References
-
- Pui CH, Robison LL, Look AT. Acute lymphoblastic leukaemia. Lancet. 2008;371:1030–1043. - PubMed
MeSH terms
Substances
LinkOut - more resources
Full Text Sources
Other Literature Sources
Research Materials
Miscellaneous
