

Altered microRNA-9 Expression Level is Directly Correlated with Pathogenesis of Nonalcoholic Fatty Liver Disease by Targeting Onecut2 and SIRT1
- PMID: 27756894
- PMCID: PMC5074799
- DOI: 10.12659/msm.897207
Altered microRNA-9 Expression Level is Directly Correlated with Pathogenesis of Nonalcoholic Fatty Liver Disease by Targeting Onecut2 and SIRT1
Abstract
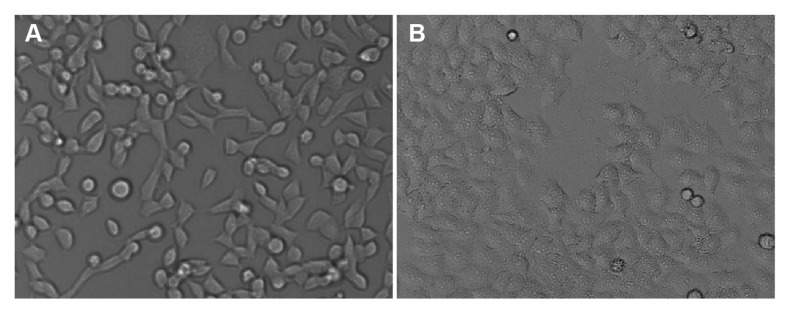
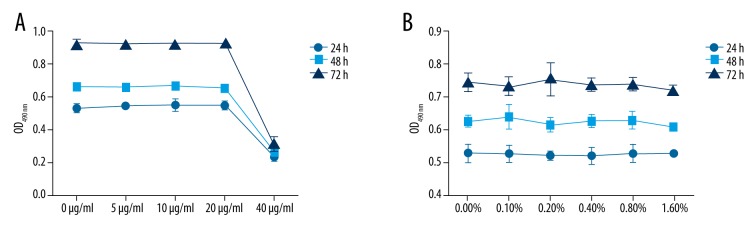
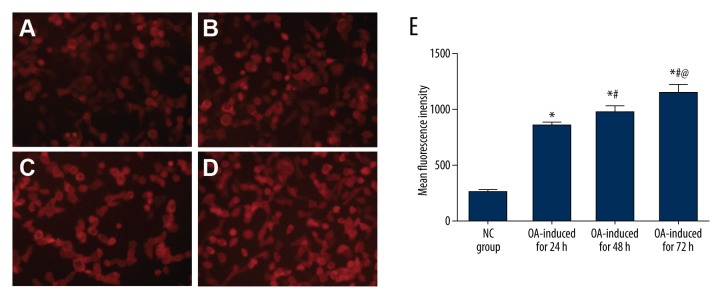
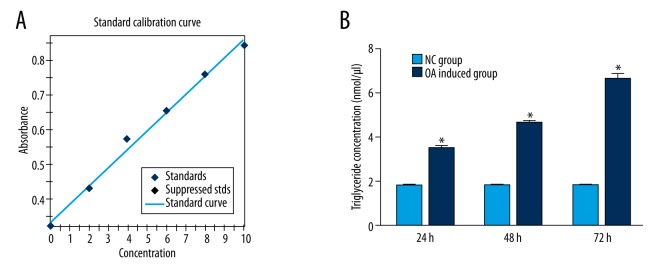
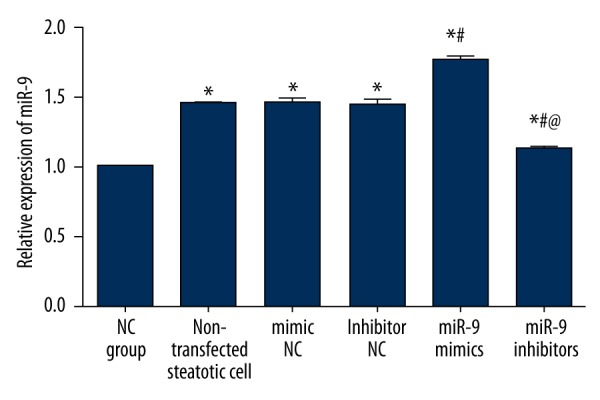
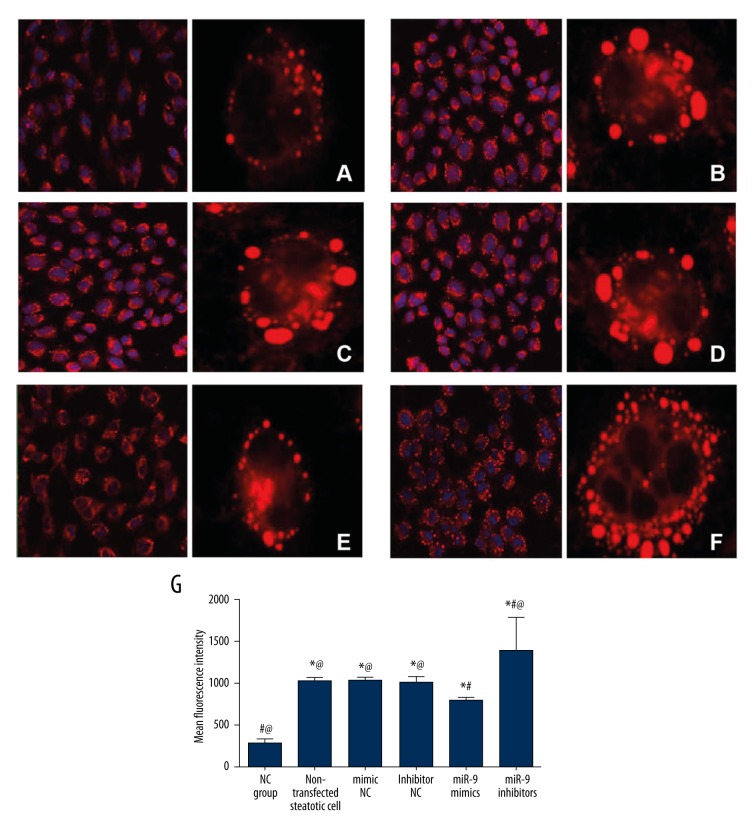
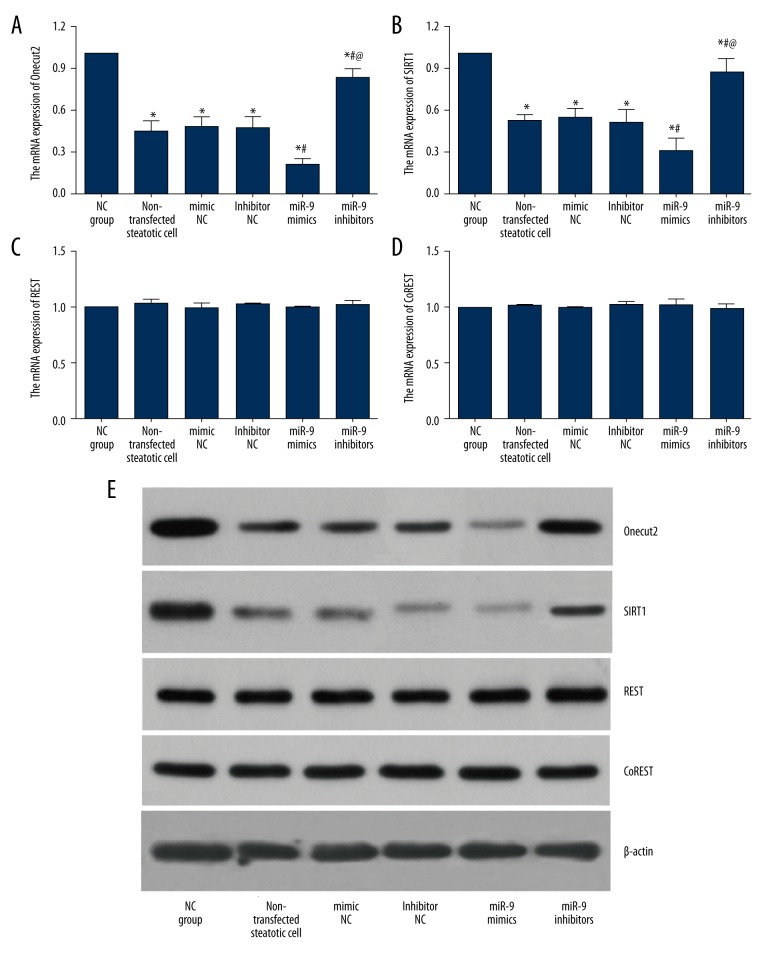
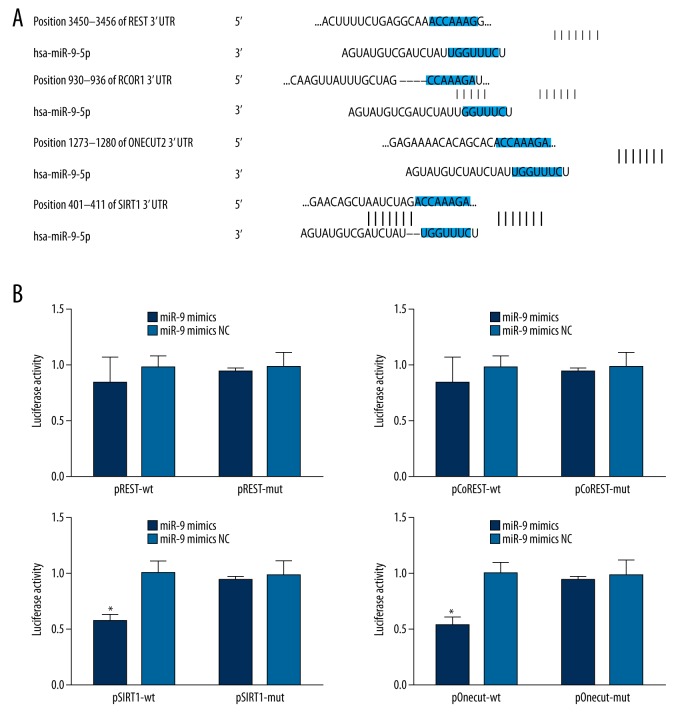
BACKGROUND MicroRNA-9 (miR-9) was detected in nonalcoholic fatty liver disease (NAFLD) patients to understand the role of miR-9 in NAFLD development. MATERIAL AND METHODS Between February 2014 and February 2015, 105 cases of NAFLD were recruited and confirmed by liver biopsy pathology, including patients with mild NAFLD (n=58) and moderate-severe NAFLD (n=47); nonalcoholic steatohepatitis (NASH) (n=53) and non-NASH (n=52); and 50 healthy participants were regarded as the healthy control group. MiR-9 expression was measured by qRT-PCR. For in vitro experiments, L-02 normal liver cells were divided into normal control group (cultured with original culture medium), dimethyl sulfoxide (DMSO) group (cultured with DMSO) and oleic acid group (cultured with oleic acid to induce fatty change), and MTT assay was used to measure the effect of different oleic acid concentrations on cell proliferation. Nile red staining was used to detect intracellular accumulation of lipid droplets. Further, synthetic miR-9 mimic and its control and miR-9 inhibitors and its control were independently transfected into L-02 cells. RESULTS MiR-9 levels in the mild NAFLD group and moderate-severe NAFLD group were significantly higher than in the healthy control group (both P<0.05). Mean fluorescence intensity of lipid droplets increased with the duration of induction, and were dramatically higher in oleate-treated L-02 cells; intracellular triglyceride (TG) content was also higher. miR-9 levels significantly increased following oleate induction. Importantly, miR-9 levels were significantly elevated upon miR-9 mimic transfection. Conversely, miR-9 level was lowered with miR-9 inhibitors transfection. Additionally, Onecut2 and SIRT1 were identified as miR-9 targets. CONCLUSIONS A positive relationship between miR-9 and steatosis was established with our results that miR-9 mimic transfection decreased intracellular lipid content. Finally, we identified 2 miR-9 targets, Onecut2 and SIRT1, which may be crucial players in NAFLD development.
Figures
Similar articles
-
miR-34a regulates lipid metabolism by targeting SIRT1 in non-alcoholic fatty liver disease with iron overload.Arch Biochem Biophys. 2020 Nov 30;695:108642. doi: 10.1016/j.abb.2020.108642. Epub 2020 Oct 21. Arch Biochem Biophys. 2020. PMID: 33098868
-
miR-122 promotes hepatic lipogenesis via inhibiting the LKB1/AMPK pathway by targeting Sirt1 in non-alcoholic fatty liver disease.Mol Med. 2019 Jun 13;25(1):26. doi: 10.1186/s10020-019-0085-2. Mol Med. 2019. PMID: 31195981 Free PMC article.
-
MiR-181b regulates steatosis in nonalcoholic fatty liver disease via targeting SIRT1.Biochem Biophys Res Commun. 2017 Nov 4;493(1):227-232. doi: 10.1016/j.bbrc.2017.09.042. Epub 2017 Sep 9. Biochem Biophys Res Commun. 2017. PMID: 28899784
-
'Micro-managers' of hepatic lipid metabolism and NAFLD.Wiley Interdiscip Rev RNA. 2015 Sep-Oct;6(5):581-93. doi: 10.1002/wrna.1295. Epub 2015 Jul 21. Wiley Interdiscip Rev RNA. 2015. PMID: 26198708 Review.
-
MicroRNAs in the Pathogenesis of Nonalcoholic Fatty Liver Disease.Int J Biol Sci. 2021 Apr 29;17(7):1851-1863. doi: 10.7150/ijbs.59588. eCollection 2021. Int J Biol Sci. 2021. PMID: 33994867 Free PMC article. Review.
Cited by
-
α-Tocopherol influences glycaemic control and miR-9-3 DNA methylation in overweight and obese women under an energy-restricted diet: a randomized, double-blind, exploratory, controlled clinical trial.Nutr Metab (Lond). 2018 Jul 11;15:49. doi: 10.1186/s12986-018-0286-7. eCollection 2018. Nutr Metab (Lond). 2018. PMID: 30008789 Free PMC article.
-
Role of microRNAs in alcohol-induced liver disorders and non-alcoholic fatty liver disease.World J Gastroenterol. 2018 Sep 28;24(36):4104-4118. doi: 10.3748/wjg.v24.i36.4104. World J Gastroenterol. 2018. PMID: 30271077 Free PMC article. Review.
-
Lipotoxic hepatocytes promote nonalcoholic fatty liver disease progression by delivering microRNA-9-5p and activating macrophages.Int J Biol Sci. 2021 Aug 27;17(14):3745-3759. doi: 10.7150/ijbs.57610. eCollection 2021. Int J Biol Sci. 2021. PMID: 35261562 Free PMC article.
-
Therapeutic Effects of microRNAs on Nonalcoholic Fatty Liver Disease (NAFLD) and Nonalcoholic Steatohepatitis (NASH): A Systematic Review and Meta-Analysis.Int J Mol Sci. 2023 May 23;24(11):9168. doi: 10.3390/ijms24119168. Int J Mol Sci. 2023. PMID: 37298120 Free PMC article.
-
The use of circulating miRNAs for the diagnosis, prognosis, and personalized treatment of MASLD.J Physiol Biochem. 2025 Jul 16. doi: 10.1007/s13105-025-01110-w. Online ahead of print. J Physiol Biochem. 2025. PMID: 40668532 Review.
References
-
- Yeh MM, Brunt EM. Pathological features of fatty liver disease. Gastroenterology. 2014;147:754–64. - PubMed
-
- McPherson S, Henderson E, Burt AD, et al. Serum immunoglobulin levels predict fibrosis in patients with non-alcoholic fatty liver disease. J Hepatol. 2014;60:1055–62. - PubMed
-
- Gruben N, Shiri-Sverdlov R, Koonen DP, Hofker MH. Nonalcoholic fatty liver disease: A main driver of insulin resistance or a dangerous liaison? Biochim Biophys Acta. 2014;1842:2329–43. - PubMed
MeSH terms
Substances
LinkOut - more resources
Full Text Sources
Other Literature Sources
Medical
Miscellaneous
