

Asperosaponin VI promotes bone marrow stromal cell osteogenic differentiation through the PI3K/AKT signaling pathway in an osteoporosis model
- PMID: 27756897
- PMCID: PMC5069473
- DOI: 10.1038/srep35233
Asperosaponin VI promotes bone marrow stromal cell osteogenic differentiation through the PI3K/AKT signaling pathway in an osteoporosis model
Abstract
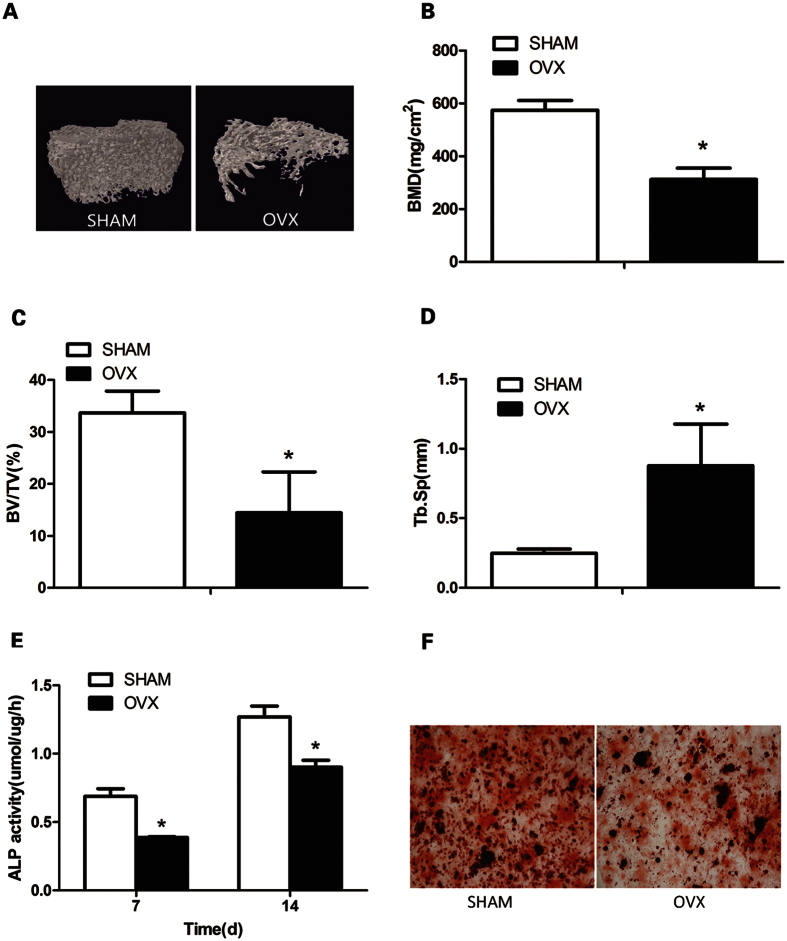
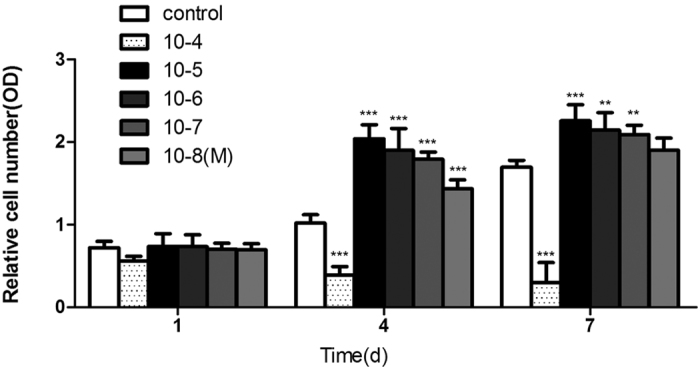
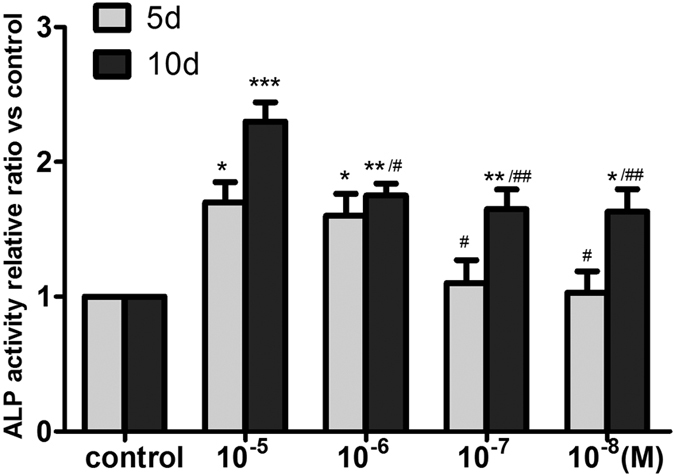
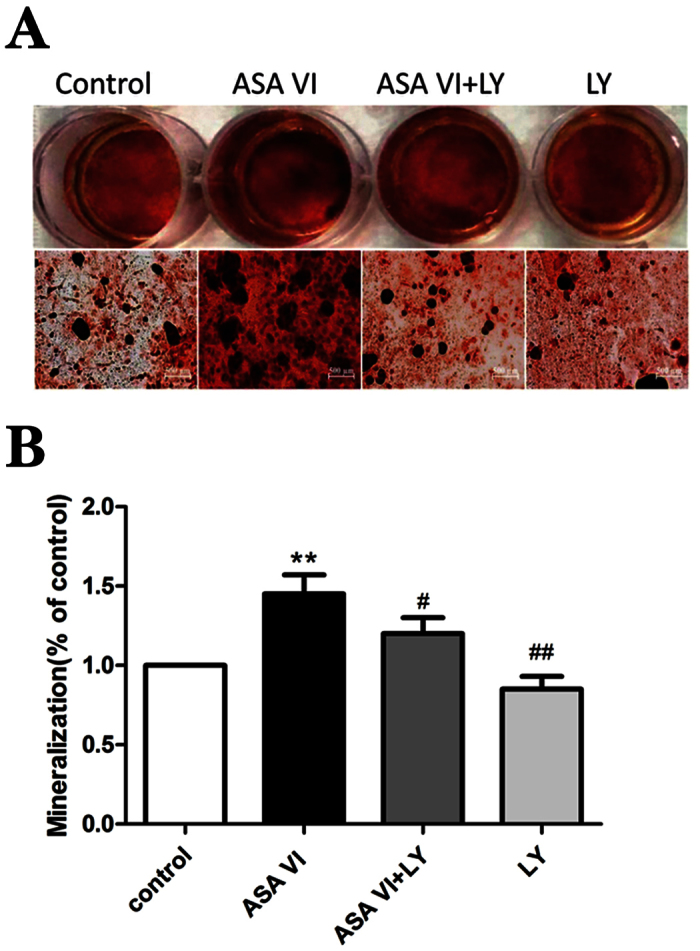
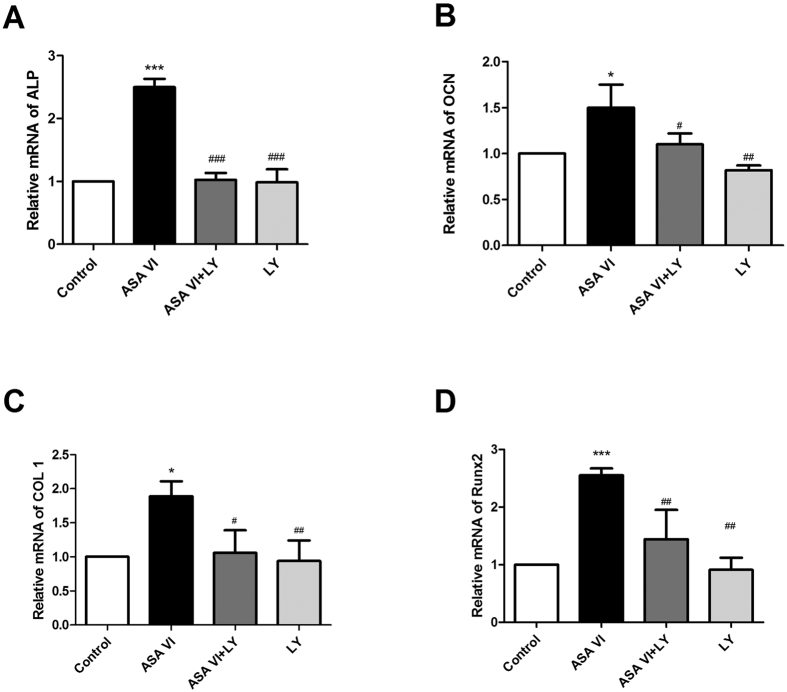
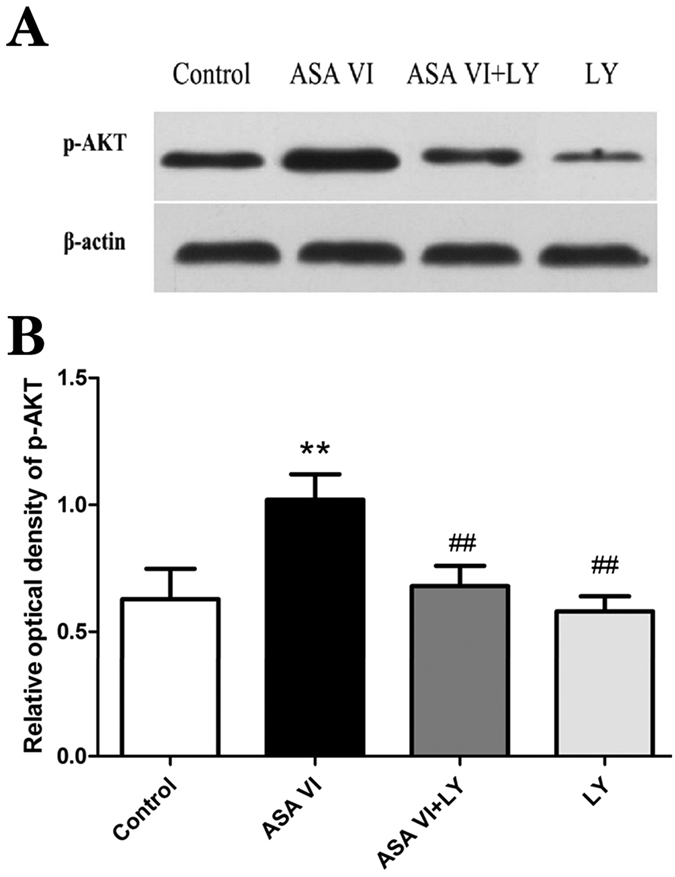
Asperosaponin VI (ASA VI), a natural compound isolated from the well-known traditional Chinese herb Radix Dipsaci, has an important role in promoting osteoblast formation. However, its effects on osteoblasts in the context of osteoporosis is unknown. This study aimed to investigate the effects and mechanism of ASA VI action on the proliferation and osteogenic differentiation of bone marrow stromal cells isolated from the ovariectomized rats (OVX rBMSCs). The toxicity of ASA VI and its effects on the proliferation of OVX rBMSCs were measured using a CCK-8 assay. Various osteogenic differentiation markers were also analyzed, such as ALP activity, calcified nodule formation, and the expression of osteogenic genes, i.e., ALP, OCN, COL 1 and RUNX2. The results indicated that ASA VI promoted the proliferation of OVX rBMSCs and enhanced ALP activity and calcified nodule formation. In addition, while ASA VI enhanced the expression of ALP, OCN, Col 1 and RUNX2, treatment with LY294002 reduced all of these osteogenic effects and reduced the p-AKT levels induced by ASA VI. These results suggest that ASA VI promotes the osteogenic differentiation of OVX rBMSCs by acting on the phosphatidylinositol-3 kinase/AKT signaling pathway.
Conflict of interest statement
The authors declare no competing financial interests.
Figures
Similar articles
-
Osteoking inhibits apoptosis of BMSCs in osteoporotic rats via PI3K/AKT signaling pathway.J Ethnopharmacol. 2025 Jan 31;340:118961. doi: 10.1016/j.jep.2024.118961. Epub 2024 Dec 7. J Ethnopharmacol. 2025. PMID: 39653105
-
Curculigoside promotes osteogenic differentiation of ADSCs to prevent ovariectomized-induced osteoporosis.J Orthop Surg Res. 2021 Apr 26;16(1):279. doi: 10.1186/s13018-021-02389-3. J Orthop Surg Res. 2021. PMID: 33902663 Free PMC article.
-
Icariin stimulates the osteogenic differentiation of rat bone marrow stromal cells via activating the PI3K-AKT-eNOS-NO-cGMP-PKG.Bone. 2014 Sep;66:189-98. doi: 10.1016/j.bone.2014.06.016. Epub 2014 Jun 20. Bone. 2014. PMID: 24956021
-
Linarin promotes osteogenic differentiation by activating the BMP-2/RUNX2 pathway via protein kinase A signaling.Int J Mol Med. 2016 Apr;37(4):901-10. doi: 10.3892/ijmm.2016.2490. Epub 2016 Feb 18. Int J Mol Med. 2016. PMID: 26935542 Free PMC article.
-
Calycosin stimulates the osteogenic differentiation of rat calvarial osteoblasts by activating the IGF1R/PI3K/Akt signaling pathway.Cell Biol Int. 2019 Mar;43(3):323-332. doi: 10.1002/cbin.11102. Epub 2019 Jan 29. Cell Biol Int. 2019. PMID: 30632644
Cited by
-
Synergy effects of Asperosaponin VI and bioactive factor BMP-2 on osteogenesis and anti-osteoclastogenesis.Bioact Mater. 2021 Sep 10;10:335-344. doi: 10.1016/j.bioactmat.2021.09.001. eCollection 2022 Apr. Bioact Mater. 2021. PMID: 34901550 Free PMC article.
-
Akebia Saponin D Regulates the Metabolome and Intestinal Microbiota in High Fat Diet-Induced Hyperlipidemic Rats.Molecules. 2019 Apr 1;24(7):1268. doi: 10.3390/molecules24071268. Molecules. 2019. PMID: 30939835 Free PMC article.
-
Enhancing the Biopharmacological Characteristics of Asperosaponin VI: Unveiling Dynamic Self-Assembly Phase Transitions in the Gastrointestinal Environment.Int J Nanomedicine. 2023 Dec 6;18:7335-7358. doi: 10.2147/IJN.S436372. eCollection 2023. Int J Nanomedicine. 2023. PMID: 38084126 Free PMC article.
-
Applications of honeybee-derived products in bone tissue engineering.Bone Rep. 2024 Jan 19;20:101740. doi: 10.1016/j.bonr.2024.101740. eCollection 2024 Mar. Bone Rep. 2024. PMID: 38304620 Free PMC article. Review.
-
The sweating process promotes toxigenic fungi expansion and increases the risk of combined contamination of mycotoxins in Radix Dipsaci.Front Microbiol. 2024 Jun 6;15:1394774. doi: 10.3389/fmicb.2024.1394774. eCollection 2024. Front Microbiol. 2024. PMID: 38903800 Free PMC article.
References
-
- Lewiecki E. M. New targets for intervention in the treatment of postmenopausal osteoporosis. Nat Rev Rheumatol. 7, 631–638 (2011). - PubMed
-
- Riggs B. L. & Melton L. J. The worldwide problem of osteoporosis: insights afforded by epidemiology. Bone. 17, 505s–511s (1995). - PubMed
-
- Cooper C. et al.. Population-based study of survival after osteoporotic fractures. Am J Epidemiol. 137, 1001–1005 (1993). - PubMed
-
- Burge R. et al.. Incidence and economic burden of osteoporosis-related fractures in the United States, 2005–2025. J Bone Miner Res. 22, 465–475 (2007). - PubMed
-
- Harada S. & Rodan G. A. Control of osteoblast function and regulation of bone mass. Nature. 423, 349–355 (2003). - PubMed
Publication types
MeSH terms
Substances
LinkOut - more resources
Full Text Sources
Other Literature Sources
Medical
