. 2016 Oct 19:6:34233.
doi: 10.1038/srep34233.

A rare schizophrenia risk variant of CACNA1I disrupts CaV3.3 channel activity

Affiliations

A rare schizophrenia risk variant of CACNA1I disrupts CaV3.3 channel activity

A Andrade et al. Sci Rep. .

Abstract

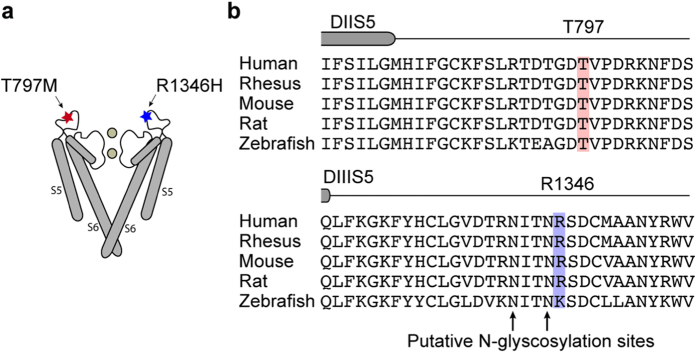
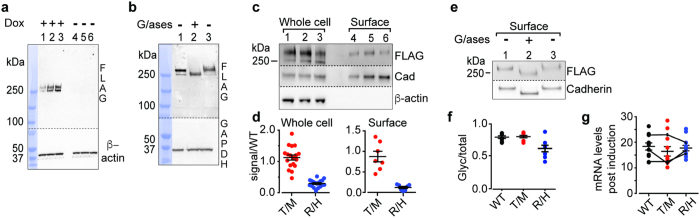
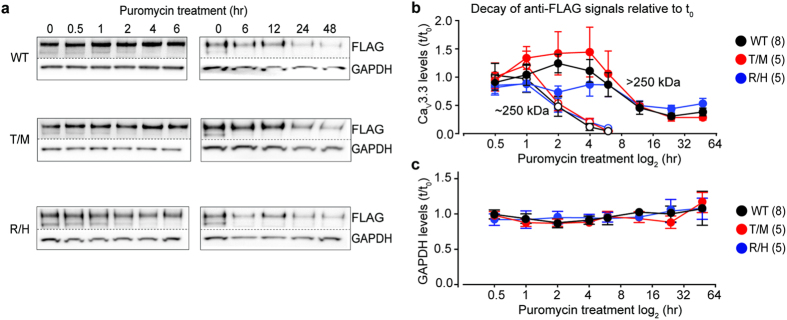
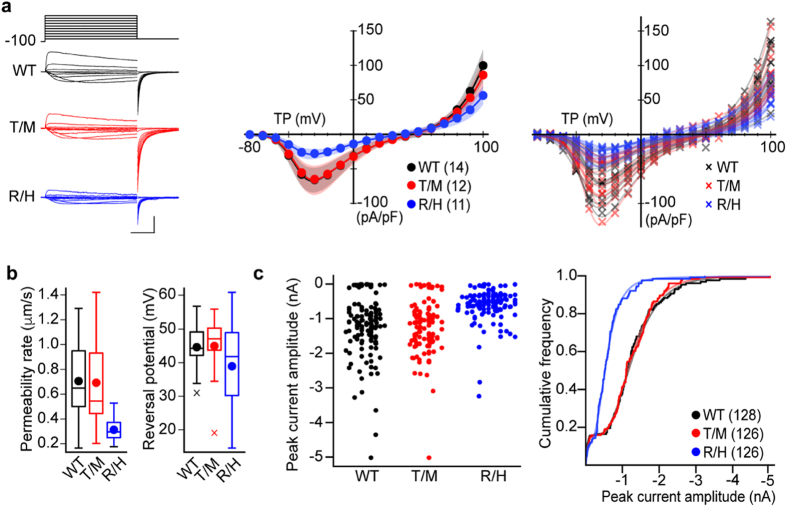
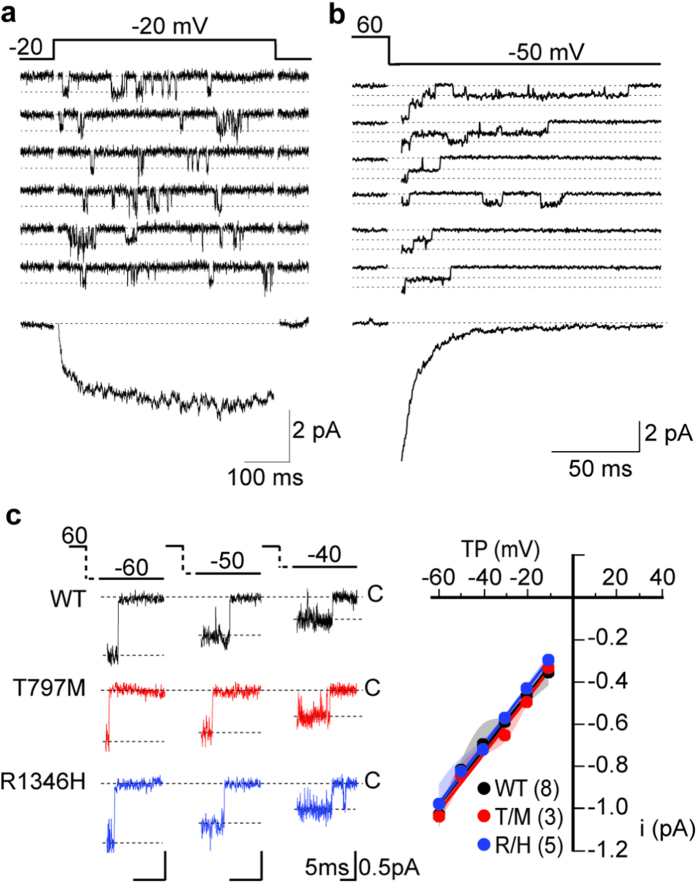
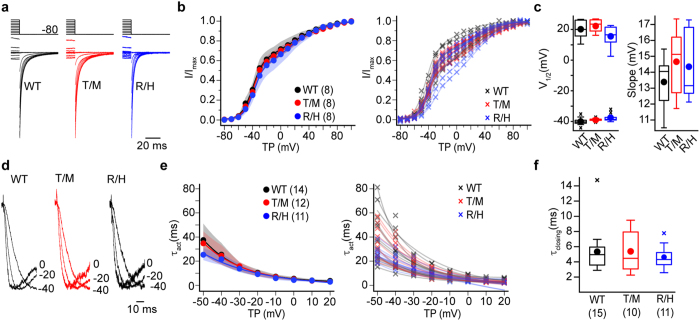
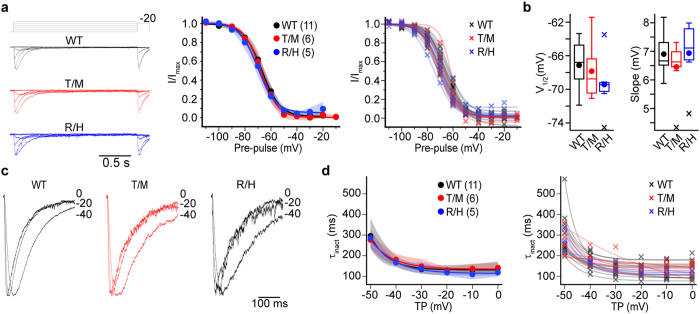
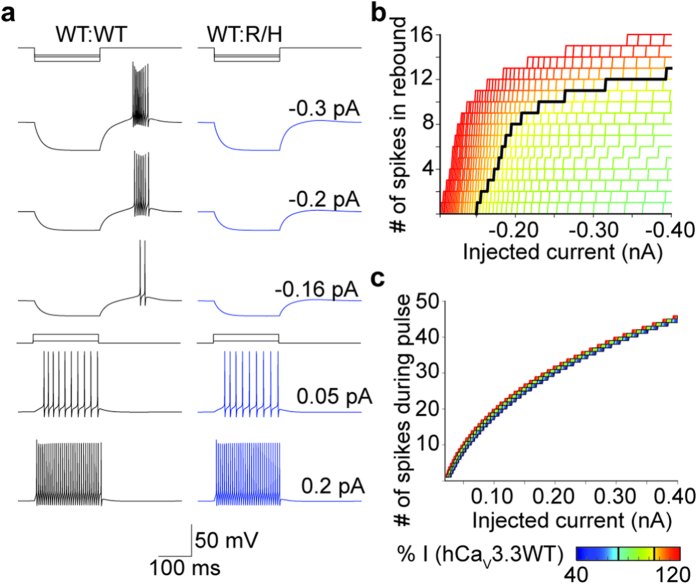
CACNA1I is a candidate schizophrenia risk gene. It encodes the pore-forming human CaV3.3 α1 subunit, a subtype of voltage-gated calcium channel that contributes to T-type currents. Recently, two de novo missense variations, T797M and R1346H, of hCaV3.3 were identified in individuals with schizophrenia. Here we show that R1346H, but not T797M, is associated with lower hCaV3.3 protein levels, reduced glycosylation, and lower membrane surface levels of hCaV3.3 when expressed in human cell lines compared to wild-type. Consistent with our biochemical analyses, whole-cell hCaV3.3 currents in cells expressing the R1346H variant were ~50% of those in cells expressing WT hCaV3.3, and neither R1346H nor T797M altered channel biophysical properties. Employing the NEURON simulation environment, we found that reducing hCaV3.3 current densities by 22% or more eliminates rebound bursting in model thalamic reticular nucleus (TRN) neurons. Our analyses suggest that a single copy of Chr22: 39665939G > A CACNA1I has the capacity to disrupt CaV3.3 channel-dependent functions, including rebound bursting in TRN neurons, with potential implications for schizophrenia pathophysiology.


Figures

Figure 1
Figure 1. hCaV3.3 variants, T797M and R1346H, are predicted to be extracellular.
(a) Approximate locations of T797M and R1346H in extracellular loops between transmembrane helices S5 and S6 in domains II and III of hCaV3.3. Figure highlights only S5 and S6 helices (S1–S4 missing), and pore regions of only two of four domains of a generic voltage-gated ion channel. (b) Amino acid sequences of CaV3.3 aligned for five vertebrates for regions I774 and S806 (upper), and Q1326 and V1357 (lower). Numbering according to NM_021096. The end of transmembrane helices S5 in domains II and III are marked (DIIS5, DIIIS5). Sequence alignment illustrates the high degree of conservation of amino acids in CaV3.3 surrounding T797 and R1346. Two putative N-glycosylation sites at asparagines 1345 and 1342 are marked (arrows; lower).
Figure 2
Figure 2. R1346H affects surface expression of hCaV3.3.
All membranes were cut in two; upper membranes were probed with anti-FLAG to measure hCaV3.3 levels and lower membranes with control antibodies. (a) Anti-FLAG signals from Flp-In T-REx HEK293 cell lysates after induction for 24, 48, and 72 hrs with (lanes 1–3), and without (lanes 4–6), 1 μg/ml doxycycline. (b) Anti-FLAG signals in whole cell lysates from cells expressing WT-hCaV3.3, untreated (1), with glycosidase (2), and same as (2) but lacking glycosidase (3). (a, b) Compiled figures from 4 digital images of the same gel. Protein ladder images are juxtaposed to the immunoblots; ladder lane is colored in blue. Dotted lines indicate the spliced borders of two immunoblots. (c) Anti-FLAG hCav3.3 levels in whole cell lysate (1–3) and biotin-surface fraction (4–6) from cells expressing WT (1, 4), T797M (T/M) (2, 5), and R1346H (R/H) (3, 6). (d) Anti-FLAG signal in whole cell and biotinylated (surface) preparations from cells expressing T/M and R/H shown relative to WT and normalized to controls (cadherin and β-actin). Mean ± SE values for T/M were 1.12 ± 0.08 (n = 18, whole cell) and 0.87 ± 0.13 (n = 7, surface); for R/H were 0.29 ± 0.03 (n = 18, whole cell) and 0.12 ± 0.03 (n = 7, surface). Coefficient of variation: T/M, 31% and R/H, 40% (1000 samples bootstrapping). (e) Anti-FLAG signals in biotinylated surface protein from cells expressing WT-hCaV3.3, untreated (1), glycosidase exposure (2) and, conditions same as (2) but lacking glycosidase (3). (f) Average fraction of upper MW band relative to total hCaV3.3 for WT: 0.80 ± 0.02 (n = 8); T/M: 0.80 ± 0.02 (n = 8); and R/H: 0.62 ± 0.05 (n = 8) from data in (c,d). (g) RT-qPCR analysis of hCaV3.3 mRNA 72 hr after doxycycline induction expressed as fold-change relative to non-induced. Each individual point is a separate qPCR measure for 3 biological replicates and 3–4 technical replicates. Lines connect the relative levels of mRNA for three genotypes within each biological experiment. Data do not violate D’Agostino-Pearson test for normality.
Figure 3
Figure 3. Glycosylated and non-glycosylated hCaV3.3 signals have different decay time courses after inhibition of protein translation.
(a) Anti-FLAG signals from total cell lysates at different time points following exposure to 0.8 μg/mL puromycin from cells expressing WT, T797M (T/M) and R1346H (R/H). All membranes were cut in two; upper membranes were probed with anti-FLAG to measure hCaV3.3 levels and lower membranes with anti-GAPDH for normalization. (b) Time course of anti-FLAG hCaV3.3 > 250kDa (closed symbols) and ~ 250kDa (open symbols) signals normalized to GAPDH and represented relative to pre-puromycin levels for WT (black), T/M (red) and R/H (blue). The >250 kDa glycosylated signals were similar among WT, T/M and R/H except at the 2 hr time point. Mean ± SE at 2hr for WT: 1.42 ± 0.10 (n = 8); T/M: 1.32 ± 0.11 (n = 5); and R/H: 0.85 ± 0.17 (n = 5), at 48 hr for WT: 0.36 ± 0.08 (n = 8); T/M: 0.27 ± 0.06 (n = 5); and R/H: 0.50 ± 0.12 (n = 5). Mean ± SE are shown for each time point. For all analysis, results shown represent at least three experimental replicates and at least two technical replicates. Data do not violate D’Agostino-Pearson test for normality, and comparisons were analyzed by one-way ANOVA with Dunnett’s post hoc test. (c) GAPDH levels during puromycin treatment. The level of GAPDH at each time point is normalized to GAPDH level at time 0 for each condition. Each data point represents mean ± SE for three separate cultures.
Figure 4
Figure 4. Calcium currents in Flp-In T-Rex HEK293 cells expressing R1346H (R/H) variant are smaller compared to those in cells expressing WT and T797M (T/M).
(a) Left: Calcium currents recorded by whole-cell patch method from three cells expressing WT (black), T/M (red) or R/H (blue) hCaV3.3. Currents were evoked by a series of 50 ms long test potentials from a holding potential of −100 mV. Scale bars correspond to 50 pA/pF and 10 ms. Middle: Average current-voltage plots. Plots for peak current densities for a range of test potentials (TP) with 99% confidence intervals generated by bootstrap resampling with replacement for cells expressing WT, T/M or R/H hCaV3.3. Right: Individual current-voltage plots for average data shown in middle. (b) Average permeability rates (left) and reversal potentials (right) were estimated from fitting the Goldman-Hodgkin-Katz function to individual current voltage relationships shown in (a). Mean (circle), median (horizontal bar), interquartile range (25th–75th percentile, box), whiskers (range), and outliers (cross) are shown for each condition. Mean ± SE permeability rates, WT: 0.71 ± 0.08 μm/s (n = 14); T/M: 0.69 ± 0.11 μm/s (n = 12); and R/H: 0.31 ± 0.03 μm/s (n = 11). Mean ± SE reversal potentials, WT: 44.63 ± 2.02 mV (n = 14); T/M: 44.98 ± 2.86 mV (n = 12); and R/H: 38.93 ± 4.27 mV (n = 11). (c) Calcium currents recorded by high throughput patch method from Flp-In T-Rex HEK293 cells expressing WT, T/M or R/H hCaV3.3. Left: Beeswarm plot of peak calcium current amplitudes for each cell line expressing hCaV3.3 WT, T/M, and R/H. Right: cumulative frequency plot of data shown in left together with fits of each distribution. Median values calculated from parametrization of each distribution, WT: 1.30 nA; T/M: 1.30 nA; and R/H: 0.56 nA. Mean values ± SE, WT: 1.13 ± 0.08 nA (n = 128); T/M: 1.10 ± 0.06 nA (n = 126); and R/H: 0.52 ± 0.04 nA (n = 126).
Figure 5
Figure 5. Single hCaV3.3 channel currents are unaffected by T797M (T/M) and R1346H (R/H).
Recordings are from cell-attached patches from tsA201 cells transiently expressing WT, T/M and R/H hCaV3.3. (a) Single WT hCaV3.3 channel currents evoked by step depolarizations from −80 mV to −20 mV, upper panel. Ensemble current trace generated by adding multiple single channel traces recorded at −20 mV, lower panel; (b) Single hCaV3.3 channel tail currents resolved immediately on membrane hyperpolarization to −50 mV from a depolarizing step to +60 mV (used to open the channels), upper panel. Tail currents are relatively large because of the large driving force at negative membrane potentials—although they close rapidly. Lower panel shows an ensemble tail current reconstructed from adding multiple single channel tail currents. Closed state is labeled (dotted line). (c) Average single CaV3.3 channel current amplitudes at different test potentials (TP, left panel) for each clone. Single channel conductances were estimated from slopes of single channel current (i)-voltage relationships (right panel). Mean ± SE, WT: 14.0 ± 0.8 pS (n = 8); T/M: 13.3 ± 0.27 pS (n = 3); and R/H: 13.7 ± 0.6 pS (n = 5). In each case, N corresponds to the number of individual patch recordings but each dataset represents measurements of >100 individual channel openings. Averages are shown with 99% confidence intervals calculated using bootstrap with resampling.
Figure 6
Figure 6. Activation and deactivation properties of CaV3.3 currents in cells expressing WT, T797M (T/M), and R1346H (R/H) hCaV3.3 are similar.
(a) Left: hCaV3.3 tail currents from cells expressing WT, T/M, and R/H clones. Currents were recorded after membrane potential is hyperpolarized to −80 mV from a series of steps (−80 mV to +60 mV). Current amplitudes were normalized. (b) Left: I/Imax activation at −80 mV from different test potentials. Averages are shown with 99% confidence intervals generated by bootstrap analysis for the three cell lines and; right: individual activation curves for each recording. The activation curve is distorted at stronger depolarizations that induce inactivation during the test pulse, but there is no difference among the three clones. (c) Left: Average V1/2 values estimated from fitting two Boltzmann functions to individual activation curves in b. Average (circle), median (horizontal bar), interquartile range (25th–75th percentile, box), whiskers (range), and outliers (cross) for each condition. Mean values ± SE for V1/2-negative, WT: −40.0 ± 0.98 mV; T/M: −38.8 ± 0.35 mV; and R/H: −37.6 ± 0.99 mV; for V1/2-positive, WT: 19.9 ± 2.2 mV; T/M: 22.6 ± 1.46 mV; and R/H: 15.4 ± 2.54 mV; for k, WT: 13.4 ± 0.6 mV; T/M: 14.7 ± 0.8 mV; and R/H: 14.3 ± 0.8 mV. (d) Calcium currents from cells expressing different hCaV3.3 as described above for panels aand b. Left: Currents activated by depolarizations to 0 mV, −20 mV, and −40 mV. Current amplitudes were normalized for visual comparison. (e) Time constants estimated from fitting the rising phase of calcium currents evoked by different test potentials (TP) are averaged and plotted as described above for panelb. (f) Closing rate (τclosing) at −60 mV for WT, T/M and R/H hCaV3.3 channels. −60 mV was chosen to minimize influence from the differences in current size between R/H and WT. Data are shown similar to panel b. Mean values ± SE, τclosing for WT: 5.33 ± 0.75 ms; T/M: 5.38 ± 0.88 ms; and R/H: 4.62 ± 0.46 ms. n values (bf), WT: n = 8; T/M: n = 8; and R/H: n = 8.
Figure 7
Figure 7. Inactivation properties were similar among WT, T797M (T/M) and R1346H (R/H) hCaV3.3 channels.
P values calculated using the 2-sample Kolmogorov-Smirnov test (a) Left: Representative traces to determine the availability of channels to open upon depolarization (voltage-dependence of inactivation). Voltage-dependent inactivation was obtained using a pre-pulse protocol. 2 s inactivating pre-pulses were applied from −110 mV to −10 mV in 10 mV steps; each pre-pulse was followed with a test pulse to −20 mV. Middle: voltage dependence of inactivation for WT, T/M and R/H hCav3.3 currents. Symbols represent mean and shaded areas correspond to 95% bootstrapped confidence interval. Right: Individual voltage dependent inactivation curves from each genotype are also shown. (b) Inactivation curves were fitted to a Boltzmann function. V1/2 and slope factor (k) were similar among the three genotypes. Average (circle), median (horizontal bar), interquartile range (25th–75th percentile, box), whiskers (range), and outliers (cross) are shown for V1/2 and k. Left: V1/2 mean ± SE, WT: −67.1 ± 0.89 mV (n = 11); T/M: −65.3 ± 1.30 mV (n = 6); and R/H: −69.4 ± 1.4 mV (n = 5). Right: k mean ± SE, WT: 6.90 ± 0.21 mV (n = 11); T/M: 6.45 ± 0.37 mV (n = 6); and R/H: 6.93 ± 0.48 mV (n = 5). (c) Left: representative traces depicting the rate of decay of the calcium current (open-state inactivation) during the test pulse for WT, T/M, R/H hCaV3.3 channels. Traces were normalized to enable comparisons. Middle: the decaying phase of calcium currents at several voltages was fitted to a single exponential. The rate of decay increased with test potential depolarization, and the time constants were similar among the three genotypes at all voltages analyzed. Right: time constants of inactivation for individual cells.
Figure 8
Figure 8. hCaV3.3 R1346H (R/H) variant impairs rebound burst firing in TRN neuron simulations.
(a) Simulations of membrane voltage in model TRN neurons responding to hyperpolarizing or depolarizing current injections. Left: WT neuron fires a burst of rebound action potentials following 200 ms negative, hyperpolarizing current injections of different magnitudes (upper) and bursts of action potentials during the depolarizing current injection (lower). Right: Neuron with 72.5% of WT CaV3.3 current density to approximate heterozygosity (50% R/H and 50% WT) does not exhibit rebound bursting following hyperpolarization. (b) Relationship between number of rebound spikes and size of hyperpolarizing current injection for a range of CaV3.3 current densities. Percent of CaV3.3 current relative to WT (black) color coded from green (78%) to red (120%). (c) The number of spikes during positive current injections depends on the magnitude of the current injection (x-axis), but it is only marginally influenced by CaV3.3 density. Black lines represent current density for WT and R/H heterozygous cells, with same color spectrum as in (b), extended to 40% of WT (blue).

Similar articles

Cited by

References

    1. Perez-Reyes E. Molecular physiology of low-voltage-activated t-type calcium channels. Physiol Rev 83, 117–161 (2003). - PubMed
    1. Lee J. H. et al. Cloning and expression of a novel member of the low voltage-activated T-type calcium channel family. J Neurosci 19, 1912–1921 (1999). - PMC - PubMed
    1. Houser C. R., Vaughn J. E., Barber R. P. & Roberts E. GABA neurons are the major cell type of the nucleus reticularis thalami. Brain Res 200, 341–354 (1980). - PubMed
    1. Liu X. B., Murray K. D. & Jones E. G. Low-threshold calcium channel subunit Ca(v) 3.3 is specifically localized in GABAergic neurons of rodent thalamus and cerebral cortex. J Comp Neurol 519, 1181–1195 (2011). - PubMed
    1. Steriade M. Grouping of brain rhythms in corticothalamic systems. Neuroscience 137, 1087–1106 (2006). - PubMed

Publication types

Substances