. 2016 Sep 30:11:4957-4973.
doi: 10.2147/IJN.S110201. eCollection 2016.

A nanoporous surface is essential for glomerular podocyte differentiation in three-dimensional culture

Affiliations

A nanoporous surface is essential for glomerular podocyte differentiation in three-dimensional culture

Cristina Zennaro et al. Int J Nanomedicine. .

Abstract

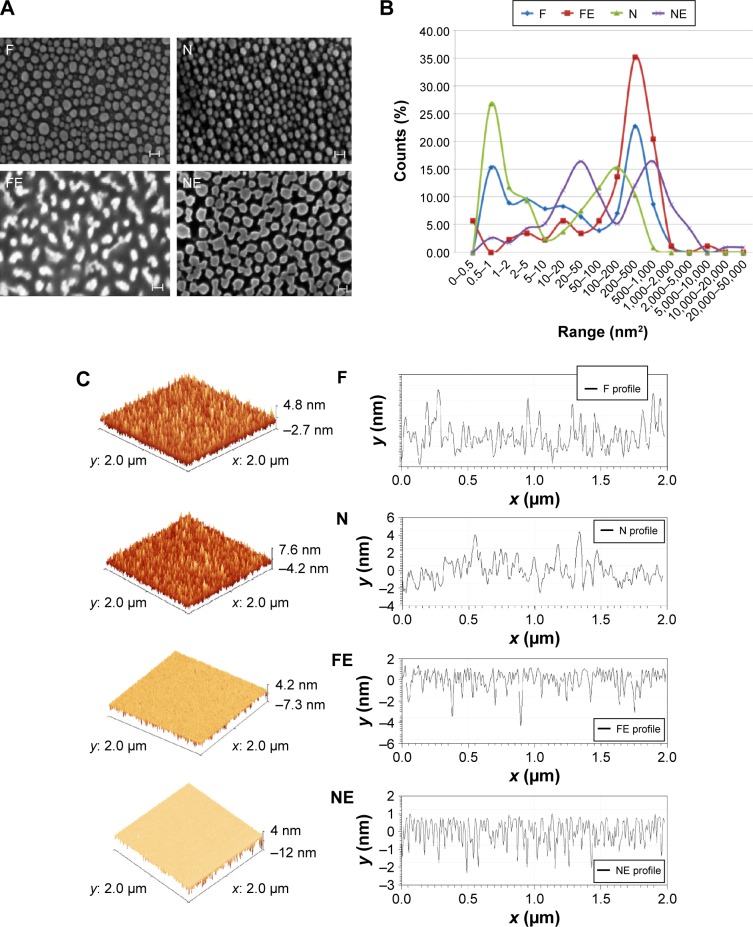
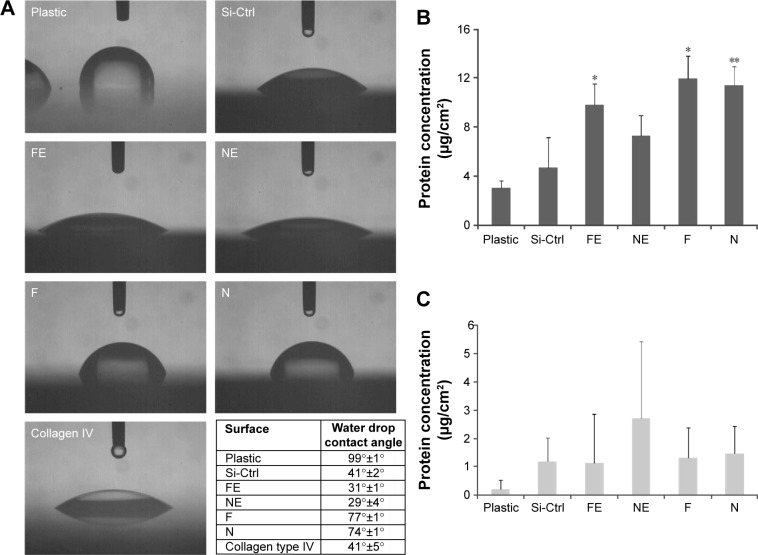
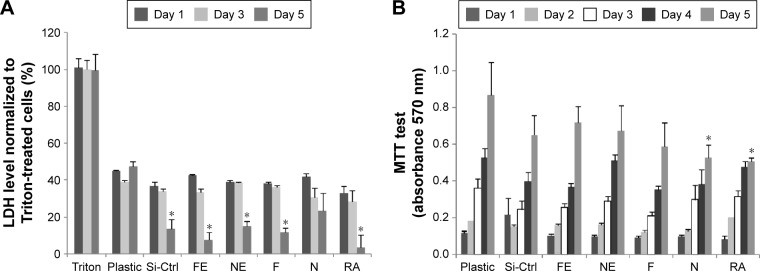
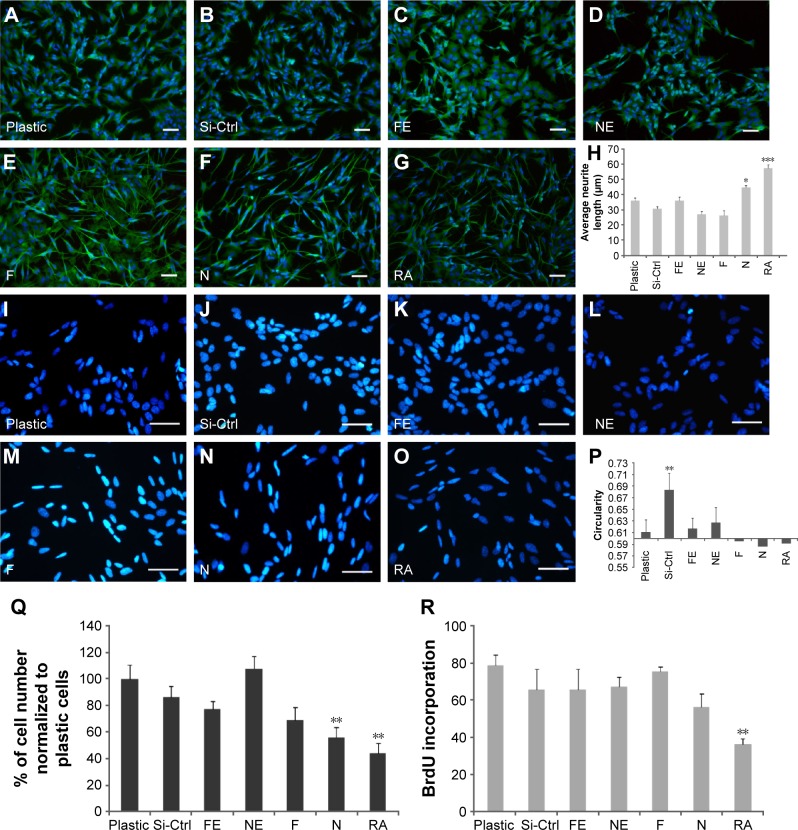
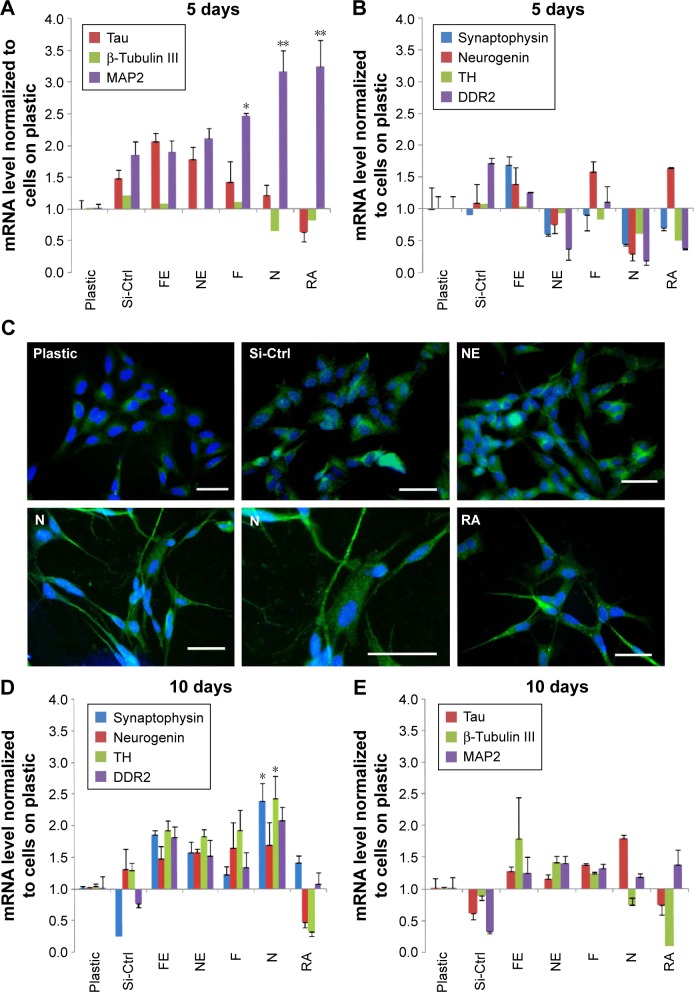
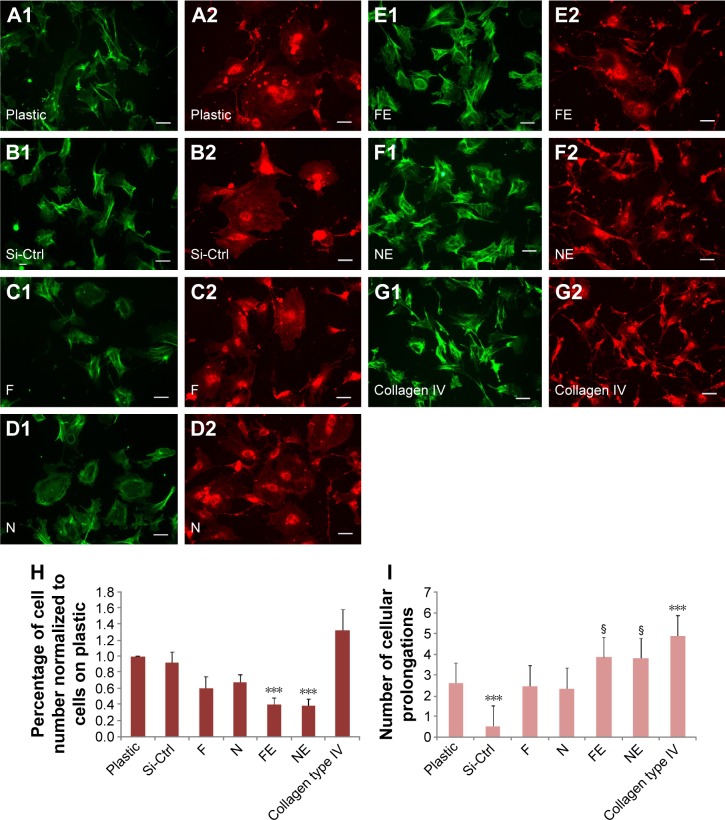
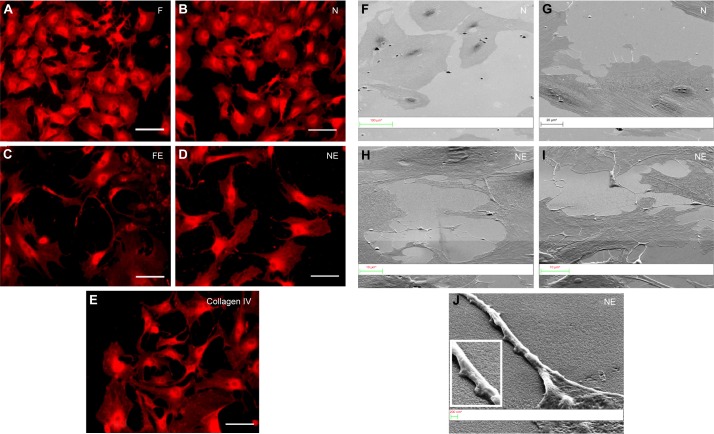
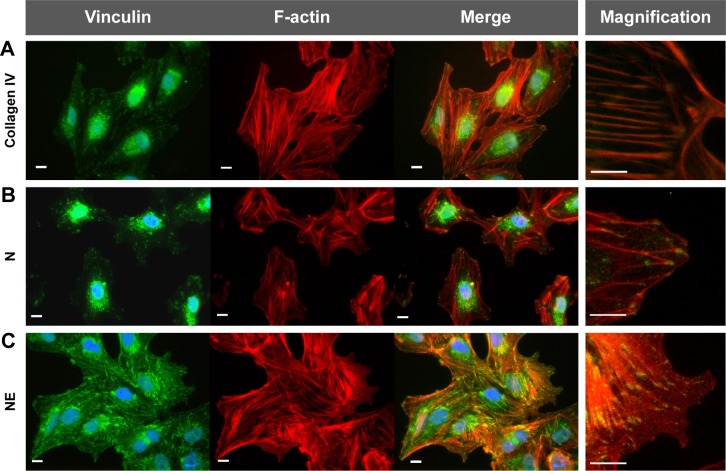
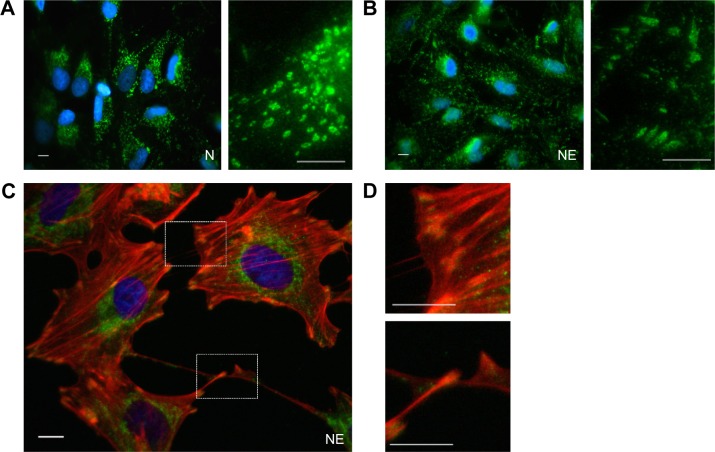
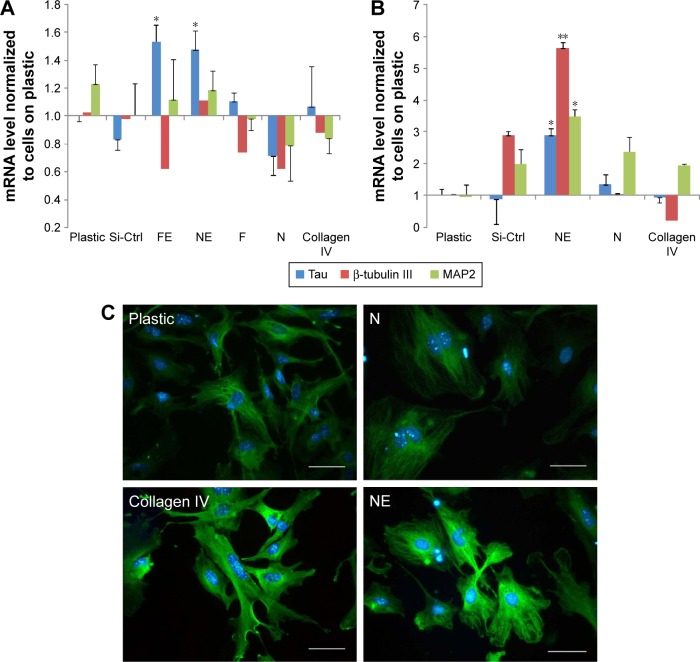
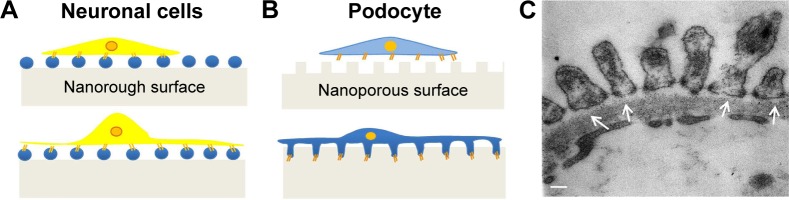
Although it is well recognized that cell-matrix interactions are based on both molecular and geometrical characteristics, the relationship between specific cell types and the three-dimensional morphology of the surface to which they are attached is poorly understood. This is particularly true for glomerular podocytes - the gatekeepers of glomerular filtration - which completely enwrap the glomerular basement membrane with their primary and secondary ramifications. Nanotechnologies produce biocompatible materials which offer the possibility to build substrates which differ only by topology in order to mimic the spatial organization of diverse basement membranes. With this in mind, we produced and utilized rough and porous surfaces obtained from silicon to analyze the behavior of two diverse ramified cells: glomerular podocytes and a neuronal cell line used as a control. Proper differentiation and development of ramifications of both cell types was largely influenced by topographical characteristics. Confirming previous data, the neuronal cell line acquired features of maturation on rough nanosurfaces. In contrast, podocytes developed and matured preferentially on nanoporous surfaces provided with grooves, as shown by the organization of the actin cytoskeleton stress fibers and the proper development of vinculin-positive focal adhesions. On the basis of these findings, we suggest that in vitro studies regarding podocyte attachment to the glomerular basement membrane should take into account the geometrical properties of the surface on which the tests are conducted because physiological cellular activity depends on the three-dimensional microenvironment.

Keywords: adhesion; basement membrane; differentiation; nanotechnology; neurons; podocytes.


Conflict of interest statement

The authors report no conflicts of interest in this work.

Figures

Figure 1
Figure 1
Features of nanosurfaces. Notes: (A) SEM images clearly show the aspects of the different nanosurfaces utilized in the study. F and N surfaces are characterized by pillars, whereas FE and NE surfaces show grooves. Scale bars =20 nm. (B) Graph plot of the frequency distribution of surface area of substrate nanostructures sampled with 50 nm2 area classes. (C) AFM topography profiles. Abbreviations: SEM, scanning electron microscopy; AFM, atomic force microscopy.
Figure 2
Figure 2
Water drop contact angle and protein absorption of nanosurfaces. Notes: (A) Representative images of water drop contact angle of the surfaces included in this study. The table shows the measured values for each surface. After 4 hours of incubation, patterned surfaces show higher protein absorption from the whole medium (B) and higher BSA adsorption (C) than plastic and non-patterned silicon. The difference with plastic is statistically significant for NE, N, and F surfaces. *P<0.01; **P<0.001. Abbreviations: BSA, bovine serum albumin; Si-Ctrl, unpatterned silicon surface.
Figure 3
Figure 3
Nanosurface biocompatibility. Notes: (A) LDH levels are compared to those produced after cell damage with Triton, taken as 100%. SHSY-5Y cells after 1 (black bars) and 3 days (light gray bars) of culture display LDH levels reduced by 40% from baseline. At 5 days (gray bars), silicon surfaces and treatment with RA further diminish LDH release, which becomes statistically significant in comparison to the same time point on plastic. (B) MTT assay confirms that cells are healthy on all surfaces and at any time points. In addition, the test shows a statistically significant difference at 5 days between cells grown on plastic and those treated with RA or seeded on the N surface. Results are expressed as mean ± SE. *P<0.01 compared to plastic. Abbreviations: LDH, lactate dehydrogenase; RA, retinoic acid; MTT, 3-(4,5-dimethylthiazol-2-yl)-2,5-diphenyl-tetrazolium bromide; SE, standard error; Si-Ctrl, unpatterned silicon surface.
Figure 4
Figure 4
Behavior of SHSY-5Y cells on different nanosurfaces. Notes: SHSY-5Y cells were immunostained with anti-β-tubulin III (green) and nuclei counterstained with DAPI (blue). The cells have an undifferentiated morphology, represented by short ramifications, when grown on (A) plastic, (B) non-patterned silicon, and porous materials (C) FE and (D) NE. A differentiated, elongated phenotype with long cell projections is present on rough materials (E) F and (F) N, as well as after (G) RA treatment. (H) The graph shows the results of measurement of cell ramification length, which is significantly higher in cells grown on the surface N and after RA treatment. By evaluation at higher magnification, the nuclear shape appears mostly rounded in cells grown on (I) plastic, (J) unpatterned silicon, or on the porous materials (K) FE and (L) NE, whereas adherence to the rough surfaces (M) F and (N) N as well as exposure to (O) RA seems to induce nuclear elongation. (P) The graph shows the results obtained by measurement of nuclear circularity, which is the highest in cells cultivated on unpatterned silicon and the lowest in cells grown on rough surfaces or exposed to RA. (Q) In the histogram, the cell number is expressed as percentage of values shown by cells grown on plastic, taken as 100%. A statistically significant decrease is shown by cells grown on the rough surface N, as well as after RA treatment. (R) After 5 days of culture, only cells treated with RA display a statistically significant lower BrdU incorporation than cells grown on plastic. Scale bars =50 µm. (H, P, Q, and R) Results are expressed as mean ± SE. *P<0.01, **P<0.001, and ***P<0.0001 compared to plastic. Abbreviations: DAPI, 4′,6-diamidino-2-phenylindole; RA, retinoic acid; SE, standard error; Si-Ctrl, unpatterned silicon surface; BrdU, bromodeoxyuridine.
Figure 5
Figure 5
Expression studies on SHSY-5Y cells. Notes: (A) Among the cytoskeletal components Tau (red bars), β-tubulin III (green bars), and MAP2 (violet bars), a significant increase of MAP2 expression is shown at 5 days of culture by cells grown on the rough surfaces N and F, as well as by cells stimulated with RA. (B) The expression of molecules related to neurotransmission, including synaptophysin (blue bars), neurogenin (red bars), TH (green bars), and DDR2 (violet bars), is not significantly modified at 5 days of culture. (C) MAP2 staining on SHSY-5Y cells shows the molecule barely expressed by cells grown on plastic (first row, left panel), non-patterned silicon (Si-Ctrl, first row, middle panel), and the porous surface NE (first row, right panel). MAP2 expression along cell processes can be detected in cells grown on the surface N (second row, left panel), and better appreciated at higher magnification of the punctated square area (second row, middle panel), similar to what is observed in cells treated with RA (second row, right panel). Scale bars =50 µm. (D) At 10 days, expression of synaptophysin (blue bars) and TH (green bars) is significantly increased in cells grown on the N surface, whereas at this time point, (E) the difference among cytoskeletal molecules is no longer present. *P<0.01 and **P<0.001 compared to plastic. Abbreviations: RA, retinoic acid; Si-Ctrl, unpatterned silicon surface.
Figure 6
Figure 6
Morphology of primary mouse podocytes. Notes: Representative F-actin (panels A1G1) and Dil staining (panels A2G2) images of primary mouse podocytes after 5 days of culture. Cobblestone phenotype and peripheral subcortical actin pattern are shown by cells grown on uncoated plastic (A1 and A2), non-patterned silicon (B1 and B2), and the rough surfaces F (C1 and C2) and N (D1 and D2). In contrast, cells seeded on the porous surfaces FE (E1 and E2) and NE (F1 and F2) resemble differentiated podocytes grown on collagen-coated plastic (G1 and G2), showing elongated cell body, presence of numerous ramifications, and actin stress fibers. Scale bars =50 µm. (H) The number of cells is significantly reduced as compared to uncoated plastic in presence of the FE and NE surfaces. (I) The cells on NE and FE surfaces show statistically significant increase of number of projections as compared to uncoated plastic. In contrast, exposure to unpatterned silicon greatly diminishes the number of cell processes. Results are expressed as mean ± SE. ***P<0.0001 and §P<0.05. Abbreviations: Dil, 1′-dioctadecyl-3,3,3′,3′-tetramethylindocarbocyanine perchlorate; SE, standard error; Si-Ctrl, unpatterned silicon surface.
Figure 7
Figure 7
Morphology of primary rat podocytes. Notes: Representative (AE) Dil staining and (FJ) SEM images of rat podocytes after 5 days of culture on nanopatterned silicon and collagen-coated plastic. Rat podocytes did not attach to uncoated plastic or to unpatterned silicon. Acobblestone morphology is observed when cells are seeded on the rough surfaces (A) F and (B, F, G) N, whereas cells grown on (C) FEand (D, H, I, J) NEporous materials present elongated shape and are provided with ramifications, similar to cells grown on (E) collagen-coated plastic. (J) The morphology of a podocyte ramification extending from the cell body and adhering on the porous surface NE can be better observed by SEM at higher magnification. (AE) Scale bars =50 μm. Abbreviations: Dil, 1′-dioctadecyl-3,3,3′,3′-tetramethylindocarbocyanine perchlorate; SEM, scanning electron microscopy.
Figure 8
Figure 8
Podocyte focal adhesions and actin cytoskeleton. Notes: Representative images of the human podocyte cell line after 2 days of culture. Though cells are not yet arborized, vinculin (left panels) positivity is higher in cells grown on (A) collagen-coated plastic and on (C) NE surface than in cells adherent to the (B) N surface. Phalloidin-rhodamine (middle panels) confirms the preferential organization of the actin cytoskeleton in stress fibers in (A) collagen-coated and (C) NE surface, whereas peripheral actin prevails in cells grown on (B) N material. Merging (right panels), particularly at higher magnification, shows that vinculin co-localizes with the tip of actin filaments in (A) and (C). Scale bars =10 µm, merge magnification ×3.
Figure 9
Figure 9
Podocyte focal adhesions and actin cytoskeleton. Notes: After 5 days of culture, the human podocyte cell line grown on (A) N surface shows cytoplasmic vinculin with a rounded appearance, typical of the inactive molecule. In contrast, a punctated pattern is present in cells seeded on the (B) NE material. (C) Vinculin puncta of cells grown on NE surface co-localize with actin tips, as better observed at (D) higher magnification (×3). Scale bars =10 µm. The second panels of panels (A) and (B) represent higher magnification (×4).
Figure 10
Figure 10
Podocyte expression changes. Notes: At 5 days of culture, the (A) human podocyte cell line shows a statistically significant increase of Tau (blue bars) in cells seeded on porous surfaces. (B) Mouse primary podocytes display a significant increase of Tau (blue bars), β-tubulin III (red bars), and MAP2 (green bars) when grown on the NE surface. *P<0.01 and **P<0.001 compared to plastic. (C) Immunostaining shows that mouse primary podocytes display increased and more ordered positivity (along the longitudinal axis of the cell) for β-tubulin III, when grown on collagen-coated plastic (second row, left panel) or on the NE surface (second row, right panel) than cells grown on uncoated plastic (first row, left panel) or on the N surface (first row, right panel). Scale bars =50 µm.
Figure 11
Figure 11
Geometry recognition differences between a neuronal cell line and podocytes. Notes: (A) The neuronal cell line has a preference for artificial surfaces provided with pillars which promote appropriate cellular adhesion and differentiation. On the contrary, (B) podocytes preferentially recognize grooves and pores on cross section, suggesting that this type of surface better resembles the three-dimensional surface of the GBM in vivo, represented in a (C) transmission electron microscopy image of a normal rat glomerulus, with arrows indicating the adhesion areas between the foot processes and the GBM. Scale bar =100 nm. Abbreviation: GBM, glomerular basement membrane.

Similar articles

Cited by

References

    1. Mendes PM. Cellular nanotechnology: making biological interfaces smarter. Chem Soc Rev. 2013;42(24):9207–9218. - PMC - PubMed
    1. Lim JY, Dreiss AD, Zhou Z, et al. The regulation of integrin-mediated osteoblast focal adhesion and focal adhesion kinase expression by nanoscale topography. Biomaterials. 2007;28(10):1787–1797. - PubMed
    1. Migliorini E, Grenci G, Ban J, et al. Acceleration of neuronal precursors differentiation induced by substrate nanotopography. Biotechnol Bioeng. 2011;108(11):2736–2746. - PubMed
    1. Fabbro A, Bosi S, Ballerini L, Prato M. Carbon nanotubes: artificial nanomaterials to engineer single neurons and neuronal networks. ACS Chem Neurosci. 2012;3(8):611–618. - PMC - PubMed
    1. Yim EK, Pang SW, Leong KW. Synthetic nanostructures inducing differentiation of human mesenchymal stem cells into neuronal lineage. Exp Cell Res. 2007;313(9):1820–1829. - PMC - PubMed