

Individual variation in functional brain connectivity: implications for personalized approaches to psychiatric disease
- PMID: 27757062
- PMCID: PMC5067145
- DOI: 10.31887/DCNS.2016.18.3/efinn
Individual variation in functional brain connectivity: implications for personalized approaches to psychiatric disease
Abstract
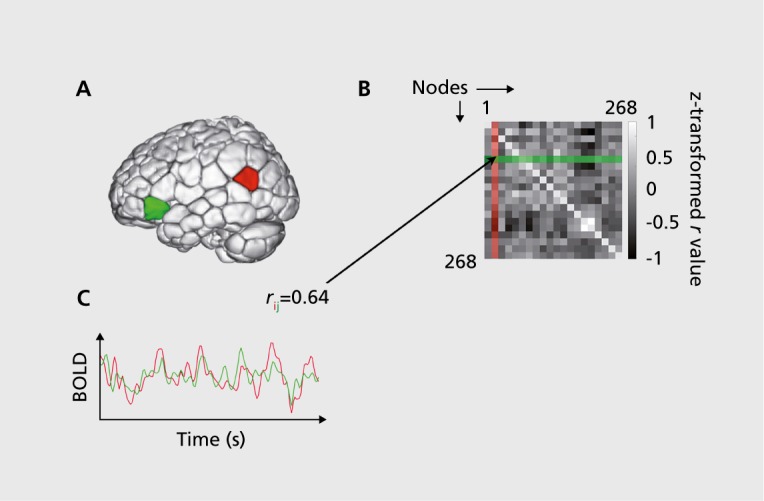
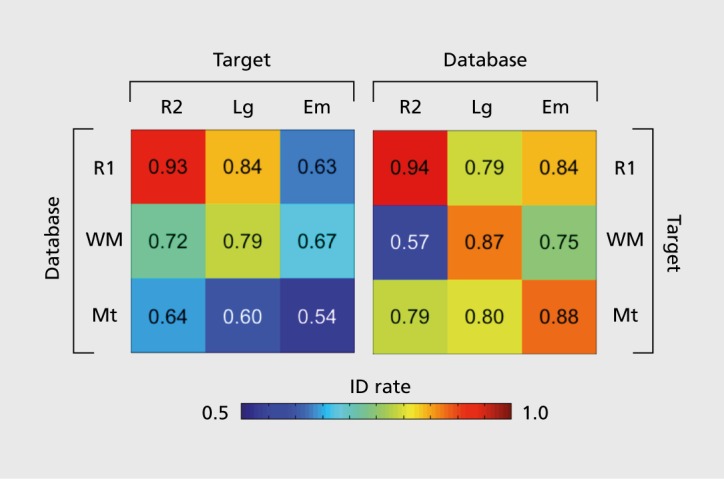
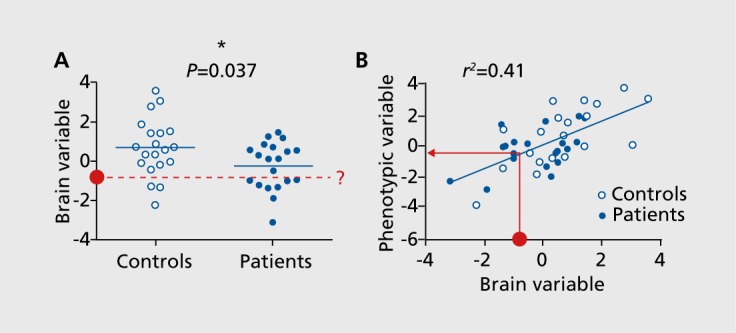
Functional brain connectivity measured with functional magnetic resonance imaging (fMRI) is a popular technique for investigating neural organization in both healthy subjects and patients with mental illness. Despite a rapidly growing body of literature, however, functional connectivity research has yet to deliver biomarkers that can aid psychiatric diagnosis or prognosis at the single-subject level. One impediment to developing such practical tools has been uncertainty regarding the ratio of intra- to interindividual variability in functional connectivity; in other words, how much variance is state- versus trait-related. Here, we review recent evidence that functional connectivity profiles are both reliable within subjects and unique across subjects, and that features of these profiles relate to behavioral phenotypes. Together, these results suggest the potential to discover reliable correlates of present and future illness and/or response to treatment in the strength of an individual's functional brain connections. Ultimately, this work could help develop personalized approaches to psychiatric illness.
La conectividad cerebral funcional medida con resonancia magnética funcional (RNMf) es una técnica habitual para investigar la organización neural tanto en sujetos sanos como en pacientes con patología mental. A pesar del rápido crecimiento del volumen de literatura, todavía la investigación de la conectividad funcional tiene que aportar biomarcadores que puedan ayudar al diagnóstico o pronóstico psiquiátrico para un sujeto en particular. Un impedimento para desarrollar tales herramientas prácticas han sido las dudas relacionadas con el porcentaje de la variabilidad intra e interindividual en la conectividad funcional, es decir, cuánto de la variación es estado versus rasgo dependiente. En este artículo se revisa la evidencia reciente acerca de los perfiles de conectividad funcional que son confiables para todos los sujetos como específicos entre ellos y las características de estos perfiles relacionadas con los fenotipos conductuales. En conjunto estos resultados sugieren la posibilidad de descubrir correlatos confiables de la enfermedad y/o de la respuesta al tratamiento actual o futura en la intensidad de las conexiones cerebrales funcionales de un individuo. Por último, este trabajo podría contribuir al desarrollo de aproximaciones personalizadas a la patología psiquiátrica.
La mesure par IRMf (imagerie par résonance magnétique fonctionnelle) de la connectivité fonctionnelle cérébrale est une technique courante d'observation de l'organisation neurologique chez les sujets sains et les sujets souffrant de maladie mentale. La littérature scientifique s'enrichit rapidement mais néanmoins, la recherche sur la connectivité fonctionnelle n'a pas encore trouvé de biomarqueurs qui aideraient au diagnostic ou au pronostic psychiatrique à un niveau individuel. L'incertitude du rapport de la variabilité intra- à interindividuelle dans la connectivité fonctionnelle est un des obstacles au développement de tels outils pratiques; en d'autres termes, dans quelle mesure la variance est-elle liée à l'état plutôt qu'à une caractéristique stable ? Nous analysons ici les données récentes selon lesquelles les profils de connectivité fonctionnelle sont à la fois fiables et propres à chaque individu, les caractéristiques de ces profils étant liées à des phénotypes comportementaux. D'après ces résultats, il est possible de découvrir des corrélats fiables de maladie actuelle ou à venir et/ou de réponse au traitement d'après la puissance des connections cérébrales fonctionnelles d'un individu. À terme, ce travail pourrait aider au développement d'approches personnalisées pour les maladies psychiatriques.
Keywords: biomarker; fMRI; functional connectivity; individual variation; prediction.
Figures
References
-
- Fornito A., Bullmore ET. Connectomics: a new paradigm for understanding brain disease. Eur Neuropsychopharmacol. 2015;25(5):733–748. - PubMed
-
- Braun U., Plichta MM., Esslinger C., et al Test-retest reliability of restingstate connectivity network characteristics using fMRI and graph theoretical measures. Neuroimage. 2012;59(2):1404–1412. - PubMed
Publication types
MeSH terms
LinkOut - more resources
Full Text Sources
Medical