

Mechanisms of leukemia resistance to antibody dependent cellular cytotoxicity
- PMID: 27757306
- PMCID: PMC5048777
- DOI: 10.1080/2162402X.2016.1211221
Mechanisms of leukemia resistance to antibody dependent cellular cytotoxicity
Abstract
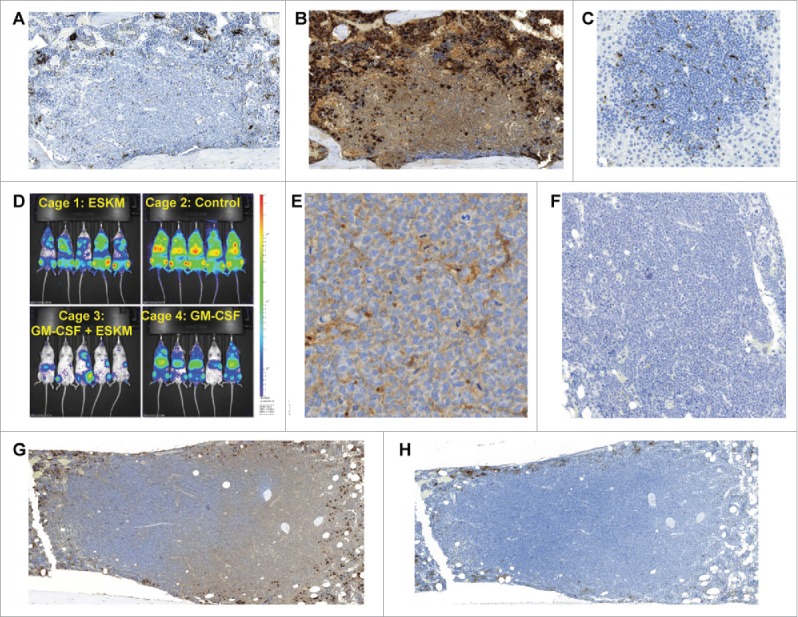
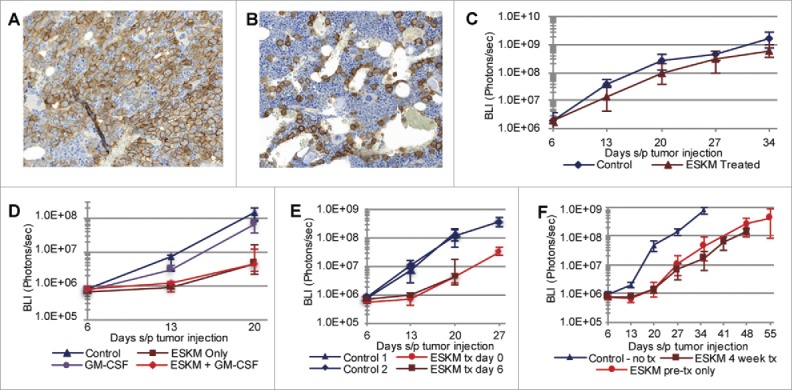
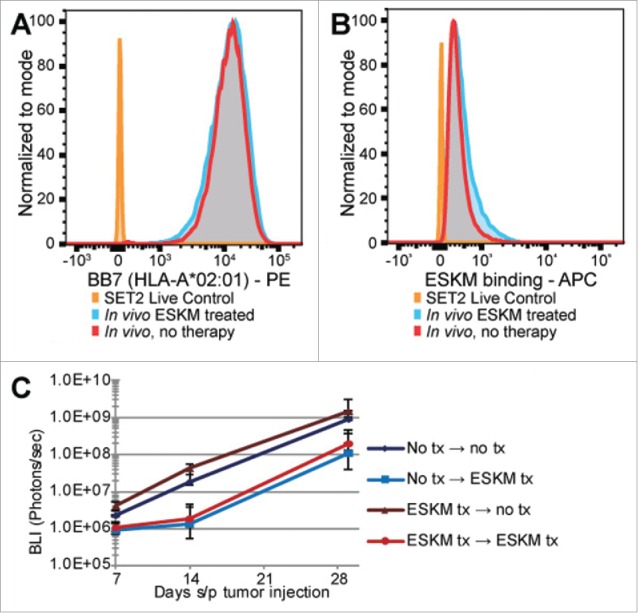
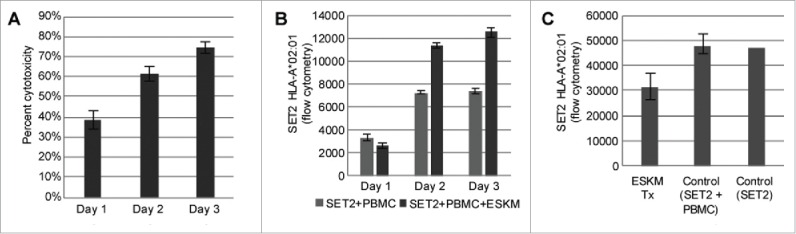
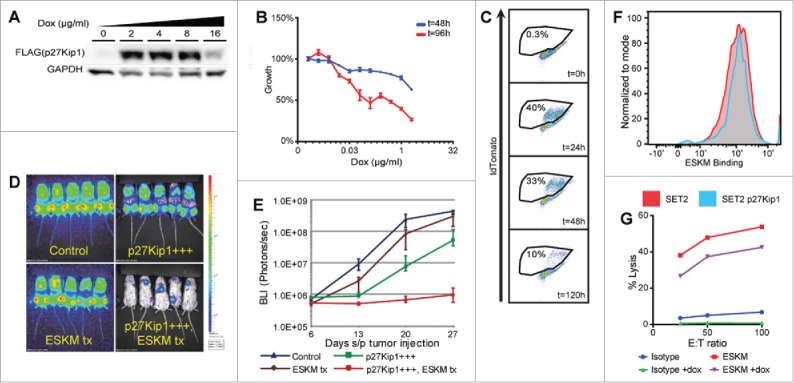
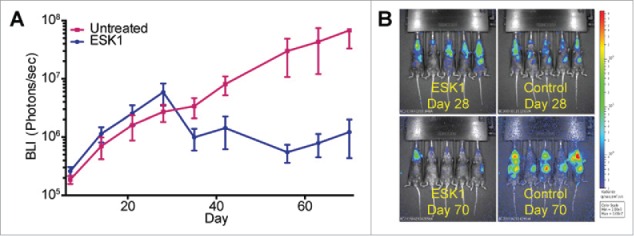
Specific immunotherapy for acute leukemia remains a great unmet need. Native unmodified monoclonal antibody therapies, while promising, are inadequately effective for these malignancies, and multiple mechanisms for failure have been described. Antibody-dependent cellular cytotoxicity or phagocytosis is the primary modality of mAb-mediated cell killing in vivo, but ultimately leads to relapse of the leukemias, in model systems and in humans. By use of a T-cell receptor mimic mAb ESKM, derived against a WT1 peptide expressed in complex with HLA-A*02:01, whose only mechanism of therapeutic action is ADCC, we evaluated the mechanisms of leukemic relapse from its potent therapeutic action in mouse xenograft models of human leukemia. Leukemia escape was not associated with loss of the antigenic target, downregulation of cell surface HLA, antibody pharmacokinetic or biodistribution issues, or development of leukemia cell-intrinsic resistance to ADCC. Interestingly, the rapidity of leukemic growth determined whether leukemia was able to evade cytotoxicity independent of the presence of sufficient effector cells. By engineering leukemia cells with upregulated p27Kip1 and slower cell cycling times, we show that relapse was inversely correlated with growth rates resulting in the eventual inadequacy of effector to target ratio. Moreover, lack of migration of effector cells into lymphomatous pockets of ALL also allowed local escape. Successful leukemia therapy with mAb might therefore be improved in similar situations by combination with measures to reduce burden and slow leukemia cell growth.
Keywords: ADCC; Leukemia; T-cell receptor mimicking; antibody; escape mechanisms.
Figures
Similar articles
-
[Immunotherapy for leukemia cells by using cytotoxic T lymphocyte specifically against WT1-derived peptide: an experimental study in vitro].Zhonghua Yi Xue Za Zhi. 2005 Dec 28;85(49):3475-80. Zhonghua Yi Xue Za Zhi. 2005. PMID: 16686063 Chinese.
-
Myeloid cells as effector cells for monoclonal antibody therapy of cancer.Methods. 2014 Jan 1;65(1):28-37. doi: 10.1016/j.ymeth.2013.06.020. Epub 2013 Jun 27. Methods. 2014. PMID: 23811299
-
Defucosylated chimeric anti-CC chemokine receptor 4 IgG1 with enhanced antibody-dependent cellular cytotoxicity shows potent therapeutic activity to T-cell leukemia and lymphoma.Cancer Res. 2004 Mar 15;64(6):2127-33. doi: 10.1158/0008-5472.can-03-2068. Cancer Res. 2004. PMID: 15026353
-
New anti-CD20 monoclonal antibodies for the treatment of B-cell lymphoid malignancies.BioDrugs. 2011 Feb 1;25(1):13-25. doi: 10.2165/11539590-000000000-00000. BioDrugs. 2011. PMID: 21090841 Review.
-
Antibody-siRNA conjugates: drugging the undruggable for anti-leukemic therapy.Expert Opin Biol Ther. 2017 Mar;17(3):325-338. doi: 10.1080/14712598.2017.1273344. Epub 2016 Dec 23. Expert Opin Biol Ther. 2017. PMID: 27977315 Review.
Cited by
-
Trial Watch: Immunostimulatory monoclonal antibodies for oncological indications.Oncoimmunology. 2017 Aug 30;6(12):e1371896. doi: 10.1080/2162402X.2017.1371896. eCollection 2017. Oncoimmunology. 2017. PMID: 29209572 Free PMC article. Review.
-
Molecular Aspects of Resistance to Immunotherapies-Advances in Understanding and Management of Diffuse Large B-Cell Lymphoma.Int J Mol Sci. 2022 Jan 28;23(3):1501. doi: 10.3390/ijms23031501. Int J Mol Sci. 2022. PMID: 35163421 Free PMC article. Review.
-
Development of Resistance to Type II JAK2 Inhibitors in MPN Depends on AXL Kinase and Is Targetable.Clin Cancer Res. 2024 Feb 1;30(3):586-599. doi: 10.1158/1078-0432.CCR-23-0163. Clin Cancer Res. 2024. PMID: 37992313 Free PMC article.
-
A therapeutic T cell receptor mimic antibody targets tumor-associated PRAME peptide/HLA-I antigens.J Clin Invest. 2017 Jun 30;127(7):2705-2718. doi: 10.1172/JCI92335. Epub 2017 Jun 19. J Clin Invest. 2017. PMID: 28628042 Free PMC article.
References
-
- Bhojwani D, Pui CH. Relapsed childhood acute lymphoblastic leukaemia. Lancet Oncol 2013; 14(6):e205-17; PMID:23639321; http://dx.doi.org/10.1016/S1470-2045(12)70580-6 - DOI - PubMed
-
- Tasian SK, Pollard JA, Aplenc R. Molecular therapeutic approaches for pediatric acute myeloid leukemia. Front Oncol 2014; 4:55; PMID:24672775; http://dx.doi.org/10.3389/fonc.2014.00055 - DOI - PMC - PubMed
-
- Jefferis R. Antibody therapeutics: isotype and glycoform selection. Expert Opin Biol Ther 2007; 7(9):1401-13; PMID:17727329; http://dx.doi.org/10.1517/14712598.7.9.1401 - DOI - PubMed
-
- Shah A. New developments in the treatment of chronic lymphocytic leukemia: role of obinutuzumab. Ther Clin Risk Manag 2015; 11:1113-22; PMID:26251607; http://dx.doi.org/10.2147/TCRM.S71839 - DOI - PMC - PubMed
-
- Jabbour E, O'Brien S, Ravandi F, Kantarjian H. Monoclonal antibodies in acute lymphoblastic leukemia. Blood 2015; 125(26):4010-16; PMID:25999456; http://dx.doi.org/10.1182/blood-2014-08-596403 - DOI - PMC - PubMed
Publication types
Grants and funding
LinkOut - more resources
Full Text Sources
Other Literature Sources
Research Materials
Miscellaneous