. 2017 Apr;368(1):79-92.
doi: 10.1007/s00441-016-2513-8. Epub 2016 Oct 18.

Cementogenic genes in human periodontal ligament stem cells are downregulated in response to osteogenic stimulation while upregulated by vitamin C treatment

Affiliations

Cementogenic genes in human periodontal ligament stem cells are downregulated in response to osteogenic stimulation while upregulated by vitamin C treatment

Philippe Gauthier et al. Cell Tissue Res. 2017 Apr.

Erratum in

Abstract

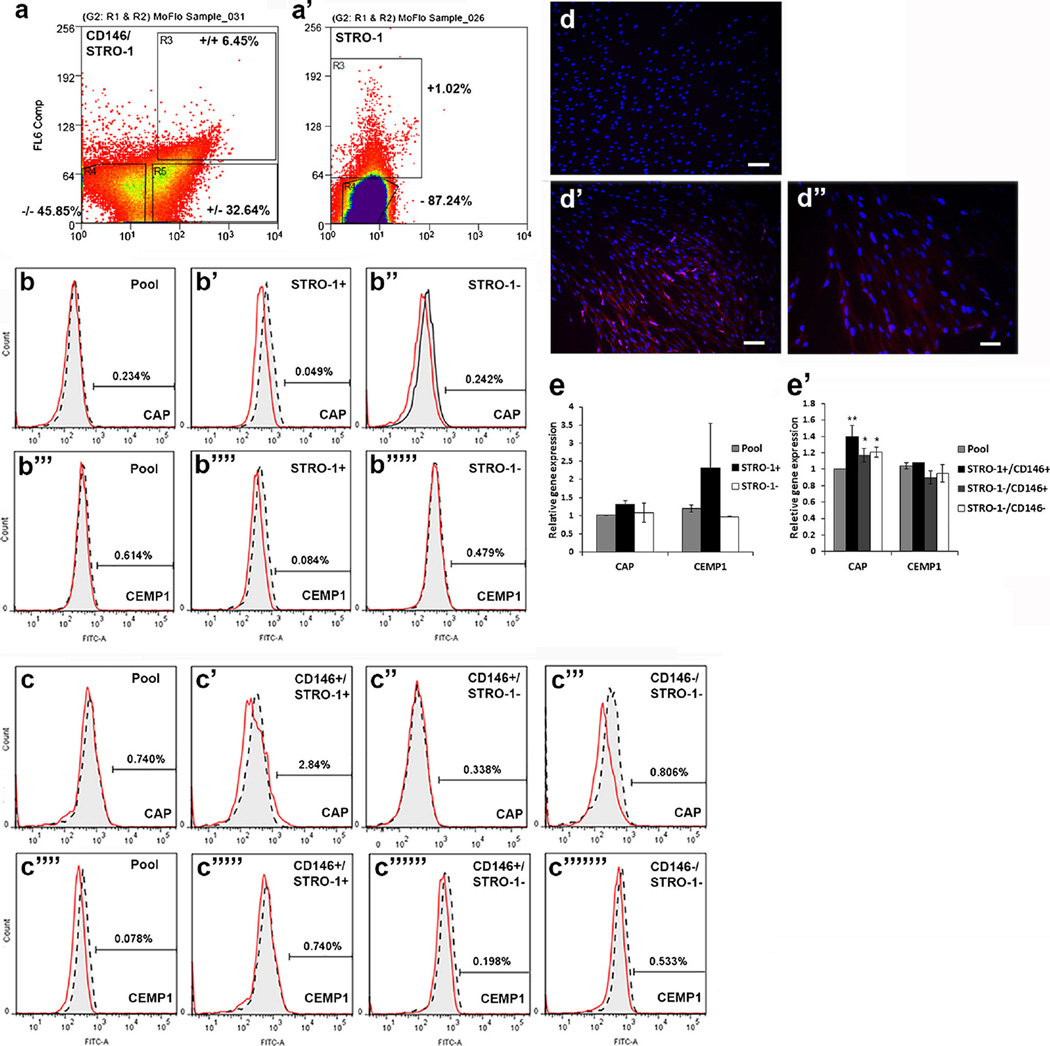
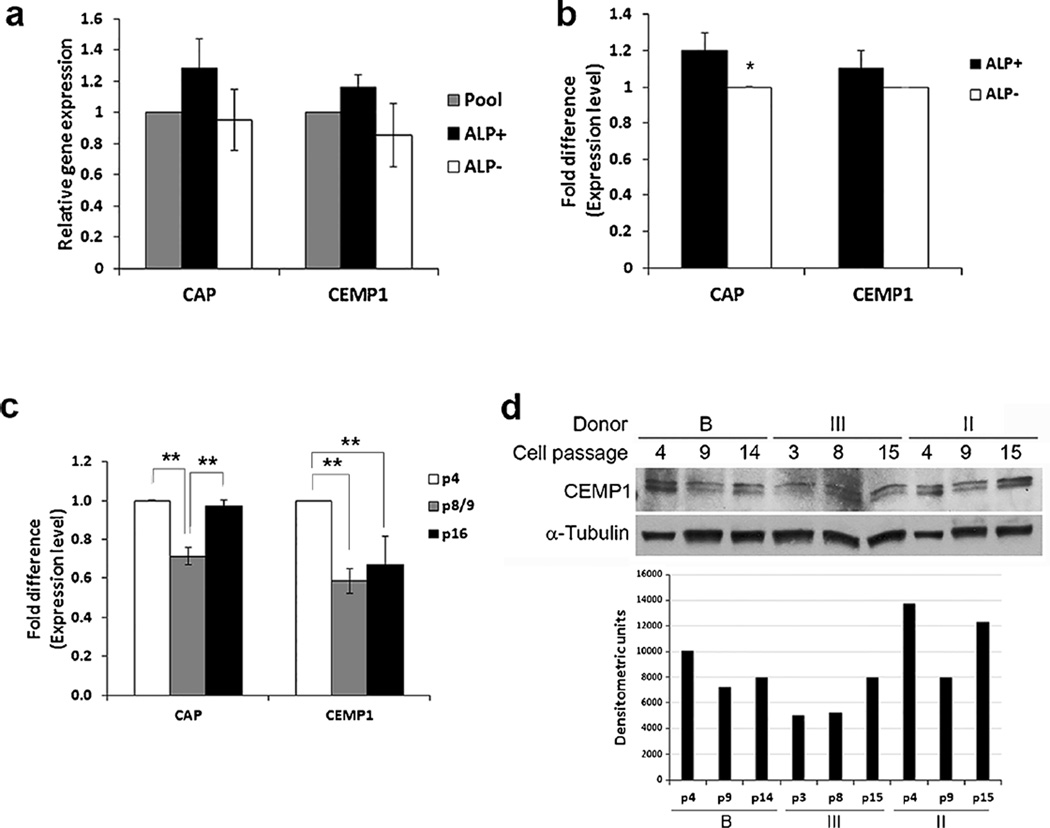
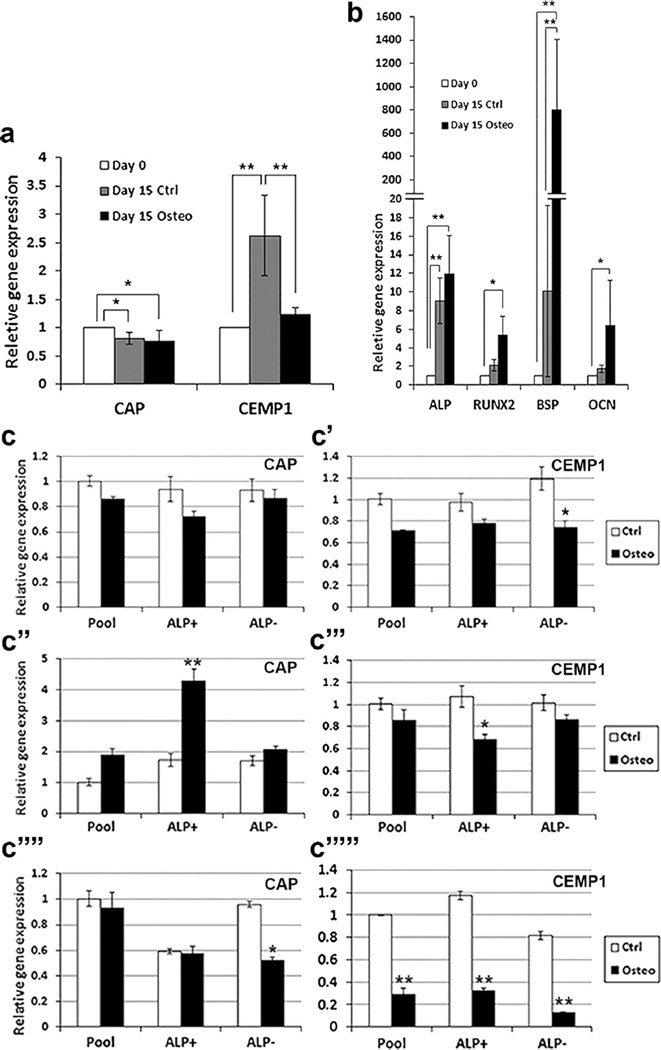
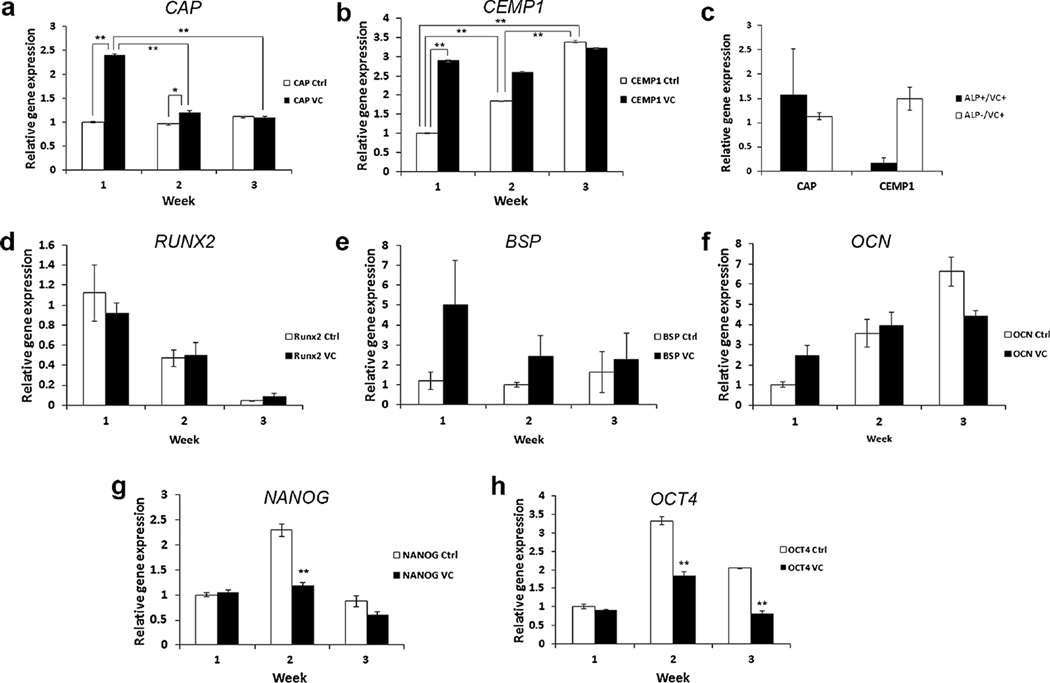
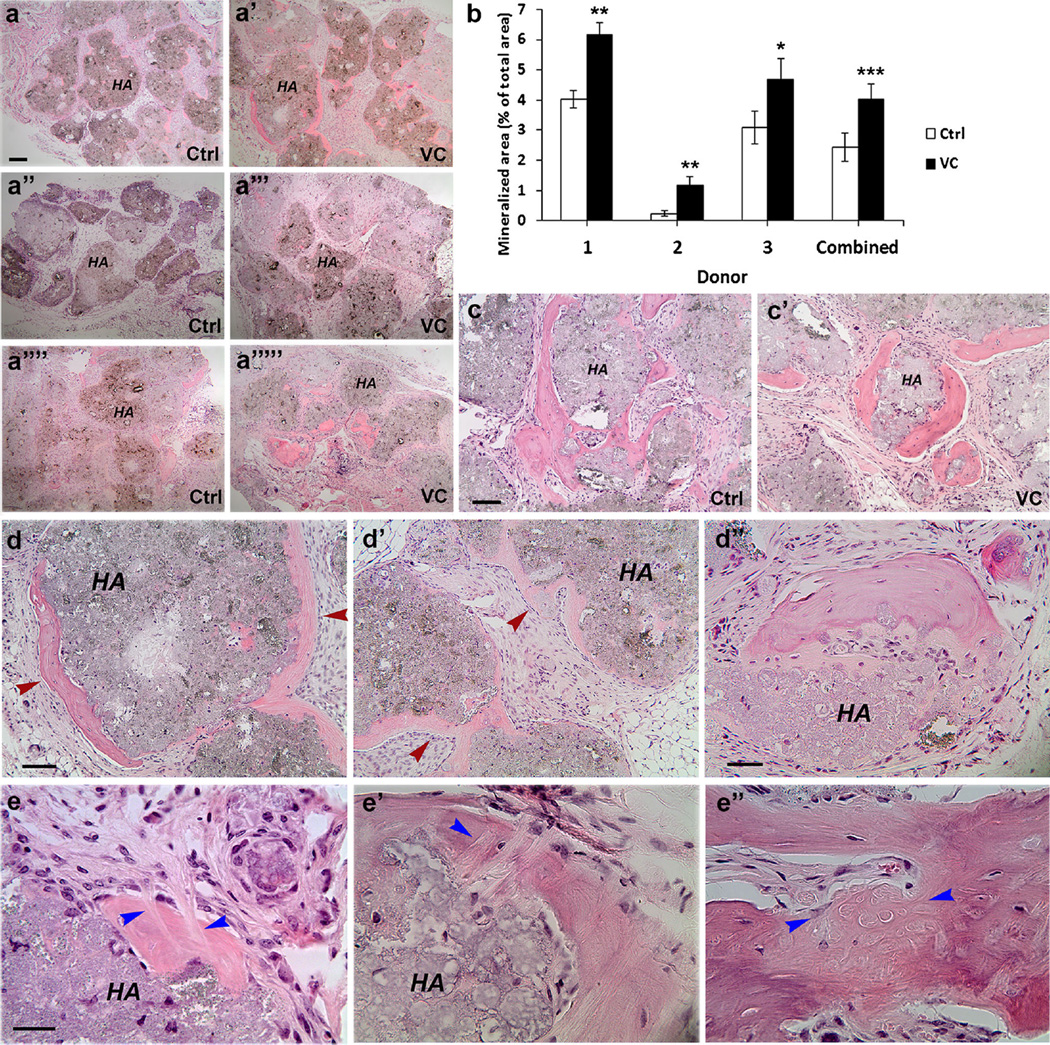
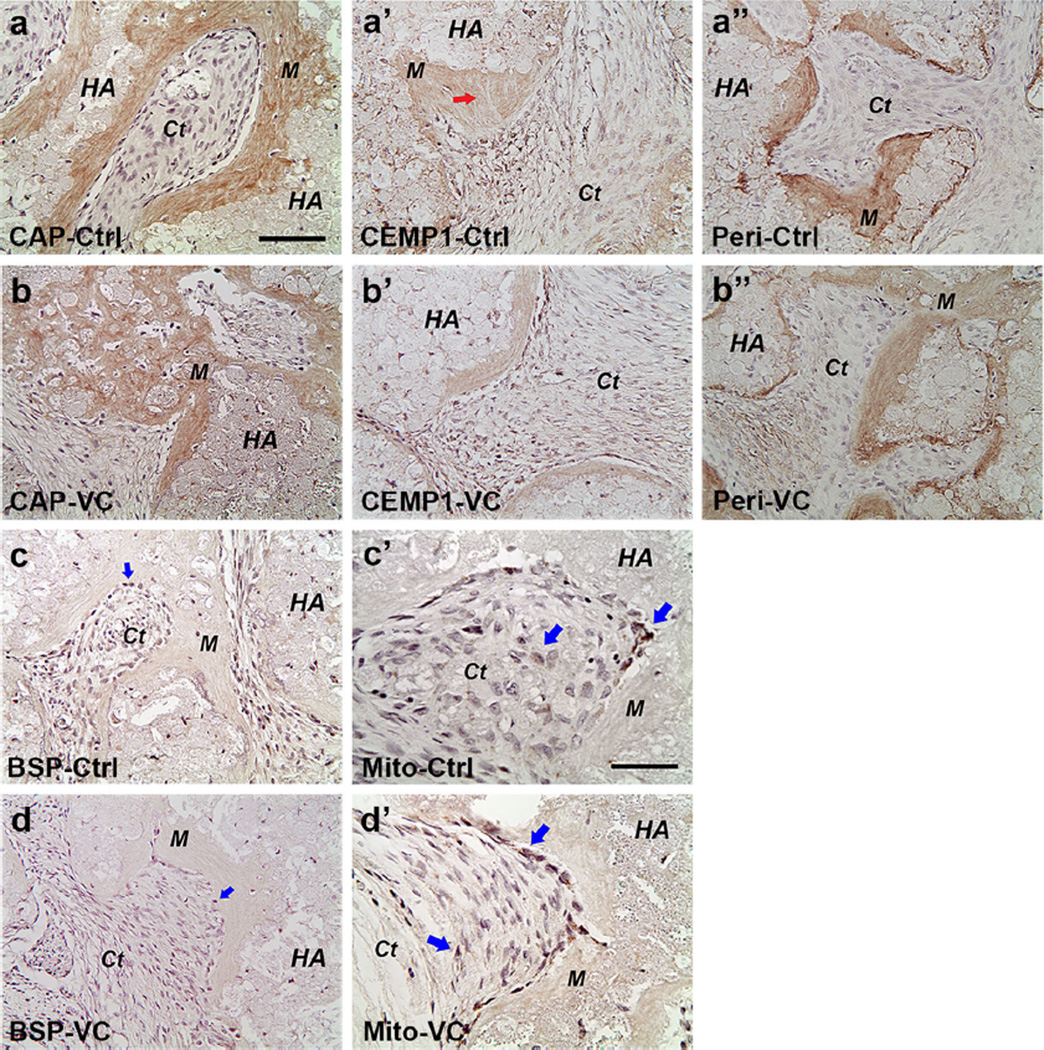
Regeneration of periodontal tissues, particularly cementum, is key to regaining periodontal attachment and health. Human periodontal ligament stem cells (hPDLSCs) have been shown to be a good cell source to regenerate periodontal tissues. However, their subpopulations and the differentiation induction in relation to cementogenic lineages is unclear. Thus, we aim to examine the expression of cementum-associated genes in PDLSC subpopulations and determine the effect of broadly used osteogenic stimulus or vitamin C (VC) on the expression of cementogenic and osteogenic genes in PDLSCs. Our real-time quantitative polymerase chain reaction (qPCR) analysis showed that cementogenic marker cementum attachment protein (CAP) expressed only slightly higher in STRO-1+/CD146+, STRO-1-/CD146+ and STRO-1-/CD146- subpopulations than in the original cell pool, while cementum protein 1 (CEMP1) expression in these subpopulations was not different from the original pool. Notably, under the stimulation with osteogenic differentiation medium, CAP and CEMP1 were downregulated while osteogenic markers bone sialoprotein (BSP) and osteocalcin (OCN) were upregulated. Both CAP and CEMP1 were upregulated by VC treatment. Transplantation of VC-treated PDLSCs into immunocompromised mice resulted in forming significantly more ectopic cementum- and bone-like mineral tissues in vivo. Immunohistochemical analysis of the ectopic growth showed that CAP and CEMP1 were mainly expressed in the mineral tissue and in some cells of the fibrous tissues. We conclude that osteogenic stimulation is not inductive but appears to be inhibitory of cementogenic pathways, whereas VC induces cementogenic lineage commitment by PDLSCs and may be a useful stimulus for cementogenesis in periodontal regeneration.

Keywords: Cementum attachment protein; Cementum protein 1; Osteogenic induction; Periodontal ligament stem cells; Vitamin C.


Figures

Fig. 1
Fig. 1
Expression of CAP and CEMP1 in PDLSC subpopulations. a, a’ Fluorescence-activated cell sorting of STRO-1+, STRO-1−, STRO-1+/CD146+, STRO-1−/CD146+ and STRO-1−/CD146− subpopulations. Cells were at passage 1 for sorting, after which cells were plated (passage 2) in culture, grown to 80 % confluence and harvested for flow or qPCR analysis. b, c Flow cytometry analysis of CAP (bb”, cc”’) and CEMP1 (b”’–b””’, c””–c”””’) in the PDLSC pool or subpopulations. dd” Immunocytofluorescence staining of CAP. PDLSCs at passage 1 were seeded into a 96-well plate at 1 cell/well. CAP was detected in one clone. d is the isotype IgG control, d’, d” show red fluorescence. No positive staining of CAP when heterogeneous subpopulation was used. Scale bars (d, d) 100 µm; (d”) 50 µm. e, e’ qPCR analysis of CAP and CEMP1 expression in STRO-1 (e) and STRO-1/CD146 (e’) subpopulations. Significant differences between the pool and other subpopulations: *p < 0.05; **p < 0.0001. Data measured from two donors each assayed in triplicate
Fig 2
Fig 2
Detection of CAP and CEMP1 in ALP+ and ALP− subpopulations and at different passages. a qPCR analysis of CAP and CEMP1 between the pool, ALP+ and ALP− subpopulations. Cells were sorted at passages 3 or 5 and cells lysed for RNA isolation. qPCR data represent mean ± SEM of two independent experiments (cells from two donors) each performed in triplicate. b Expression of cementum associated genes CAP and CEMP1 by PDLSC subpopulations ALP+ and ALP− at passage 8. PDLSC pools were first sorted at passages 2–3 and the ALP− subpopulations were continuously cultured and passaged until passage 8 and sorted again to separate ALP+ and ALP− for qPCR analysis. Data represent mean ± SEM from two different donors each assayed in triplicate. Significant differences in CAP expression between ALP+ and ALP−: F(3,8) = 6.4655, *p = 0.0034. c Expression of CAP and CEMP1 by PDLSC pools at various passages (p4, p8 or 9 and p16). Data represent mean ± SEM from three different donors each assayed in triplicate. Significant difference: *p < 0.001. d Western blot analysis of CEMP1 expression in the pool of PDLSCs from three different donors (B, III and II) at different cell passages. Bottom densities of each gel band after normalization against α-tubulin analyzed by ImageJ
Fig 3
Fig 3
Expression of cementum and osteogenic markers in PDLSCs under osteogenic induction. Heterogeneous pools of PDLSCs were stimulated in OM (osteogenic) for various time points and harvested for qPCR analysis. Cells in control group (non-induced) were grown in regular GM. a, b Expression of cememtum and osteogenic markers at days 0 and 15. Data represent mean ± SEM of three donors (3 independent experiments, each performed in triplicate). Significant differences: *p < 0.05, **p < 0.0001. c Expression of CAP and CEMP1 detected by qPCR of the pool and ALP+/ALP− subpopulation PDLSCs under osteogenic induction for 1 (c, c’), 2 (c”, c”’) or 3 (c””, c””’) weeks. Representative data from one donor measured in triplicate. Significant differences between control and osteogenesis in each cell group: *p < 0.05, **p < 0.0001
Fig. 4
Fig. 4
Expression of cemental markers in PDLSCs with vitamin C (VC) treatment. PDLSCs (passages 3–4) were seeded in wells of 6 well-plates and the VC group was added (20 µg/mL) at subconfluence and the control groups received no VC. At different time points after the VC addition, cells were harvested for qPCR analysis. Expression of CAP (a, p < 0.0001 F(5,12) = 434.7178) and CEMP1 (b, p < 0.0001, F(5,12) = 1059.43) in PDLSCs after 1–3 weeks of VC treatment. c PDLSCs were cultured with VC for 1 week and sorted into ALP+ and ALP- cells for qPCR analysis of CAP and CEMP1. df Osteogenic markers RUNX2, BSP and OCN were also detected by qPCR at the different time points. (We performed the Cochran–Mantel–Haenszel test on the ranks of fold change in each time block; there was no statistically significant difference). g, h Stemness genes NANOG (p < 0.0001, F(5,12) = 39.78; Ctrl vs VC) and OCT4 (p < 0.0001, F(5,12) = 109.15; Ctrl vs VC) were detected by qPCR. Data in (a, b, dh) represent mean ± SEM from one donor assayed in triplicate. Data in (c) represent mean ± SEM from three different donors each assayed in triplicate. Significant differences: *p < 0.05; **p < 0.0001. PDLSCs were grown in medium absent of L-ascorbic acid 2-phospate for the VC experiments
Fig. 5
Fig. 5
Formation of ectopic mineral tissues in vivo by PDLSCs. Cells (2–3 × 10⁶) at passages 2–3 treated or not treated (control) with VC (20 µg/mL) for 1 week were mixed with 20 mg of HA/TCP and transplanted into SCID mice. Formed tissues were harvested after 3 months and decalcified for histological analysis. aa””’ Mineral tissue formation around the HA/TCP granules by PDLSCs from three donors 1 (a, a’), 2 (a”, a”’) and 3 (a””, a””’). b Quantitative analysis of mineral tissues. Cells from each donor were made duplicate for ectopic mineral tissue formation. There were a total of 12 tissue samples and each was sectioned into 9–12 sections (total 138 sections). Every section was analyzed using ImageJ as described in “Materials and methods”. Data represent mean ± SEM for each donor (t test for two-tailed p values after Benjamini Hochberg adjustment; *p < 0.01; **p < 0.001) or combined for 3 donors (a mixed model with a donor and slide were random variables, treatment as a fixed variable. The treatment effect when comparing VC to control has a ***p value <0.0001). c, c’ Magnified views of mineral tissues. Sample from donor 3. dd” Sample from donor 1, VC-treated group. Red arrowheads indicate mineral tissues. d Heavier mineral stain (right) versus lighter mineral stain (left). d’ Light mineral stain. d” Heavy and light mineral stain located in the same mineral complex. e Collagen fibers (bundles) resembling Sharpey’s fibers (blue arrowheads). Samples from (a”, a”’) donor 2, VC-treated; e’) donor 1, control; e”) donor 3, VC-treated. Ctrl: cells grown in regular medium; VC: cells treated with VC. Scale bar: (aa””’) 200 µm for all six images. Scale bars (c, c’) 100 µm; (d, d’) 100 µm, (d”) 50 µm; (ee”) 30 µm
Fig. 6
Fig. 6
Immunohistochemical analysis of ectopic tissues regenerated in vivo by PDLSCs. Specific antibodies against human CAP (a, b), CEMP1 (a’, b’), periostin (a”, b”), BSP (c, d) and mitochondria (c’, d’) were used to detect these gene products in the tissues shown in Fig. 5. The same antibody dilutions and conditions were used to detect the antigens for both control (Ctrl) and VC-treated groups in the same donor. Positive staining is shown by brown stains in mineral tissue, soft connective tissue or in individual cells. HA: hydroxyapatite/tri-calcium phosphate; M mineral tissue; Ct fibrous connective tissue. Arrows: in the CEMP1 group indicating Sharpey’s fiber-like; in the BSP group indicate some cells having weak staining; in the Mito (mitochondria) group, they indicate stronger staining in cells lining against the mineral tissue and weaker staining in cells in the adjacent soft connective tissue. Scale bars (CAP, CEMP1, periostin and BSP images) 100 µm; (Mito images) 50 µm

Similar articles

Cited by

References

    1. Akizuki T, Oda S, Komaki M, Tsuchioka H, Kawakatsu N, Kikuchi A, Yamato M, Okano T, Ishikawa I. Application of periodontal ligament cell sheet for periodontal regeneration: a pilot study in beagle dogs. J Periodontal Res. 2005;40:245–251. - PubMed
    1. Alongi DJ, Yamaza T, Song Y, Fouad AF, Romberg EE, Shi S, Tuan RS, Huang GT-J. Stem/progenitor cells from inflamed human dental pulp retain tissue regeneration potential. Regen Med. 2010;5:617–631. - PMC - PubMed
    1. Alvarez-Pérez MA, Narayanan S, Zeichner-David M, Rodríguez Carmona B, Arzate H. Molecular cloning, expression and immunolocalization of a novel human cementum-derived protein (CP-23) Bone. 2006;38:409–419. - PubMed
    1. Arzate H, Olson SW, Page RC, Gown AM, Narayanan AS. Production of a monoclonal antibody to an attachment protein derived from human cementum. FASEB J. 1992;6:2990–2995. - PubMed
    1. BarKana I, Narayanan AS, Grosskop A, Savion N, Pitaru S. Cementum attachment protein enriches putative cementoblastic populations on root surfaces in vitro. J Dent Res. 2000;79:1482–1488. - PubMed

MeSH terms