. 2017 Jan;230(1):30-46.
doi: 10.1111/joa.12541. Epub 2016 Oct 19.

Role of C16, angiopoietin-1 and regeneration gene protein 2 in attenuating inflammation in an experimental rat model of autoimmune encephalomyelitis

Affiliations

Role of C16, angiopoietin-1 and regeneration gene protein 2 in attenuating inflammation in an experimental rat model of autoimmune encephalomyelitis

Ke-Wei Tian et al. J Anat. 2017 Jan.

Abstract

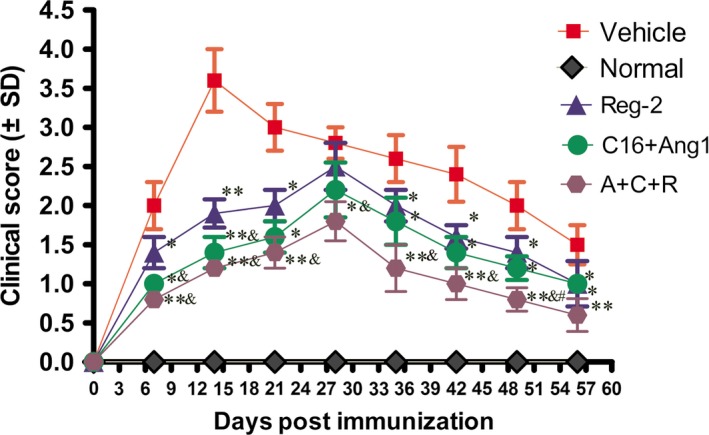
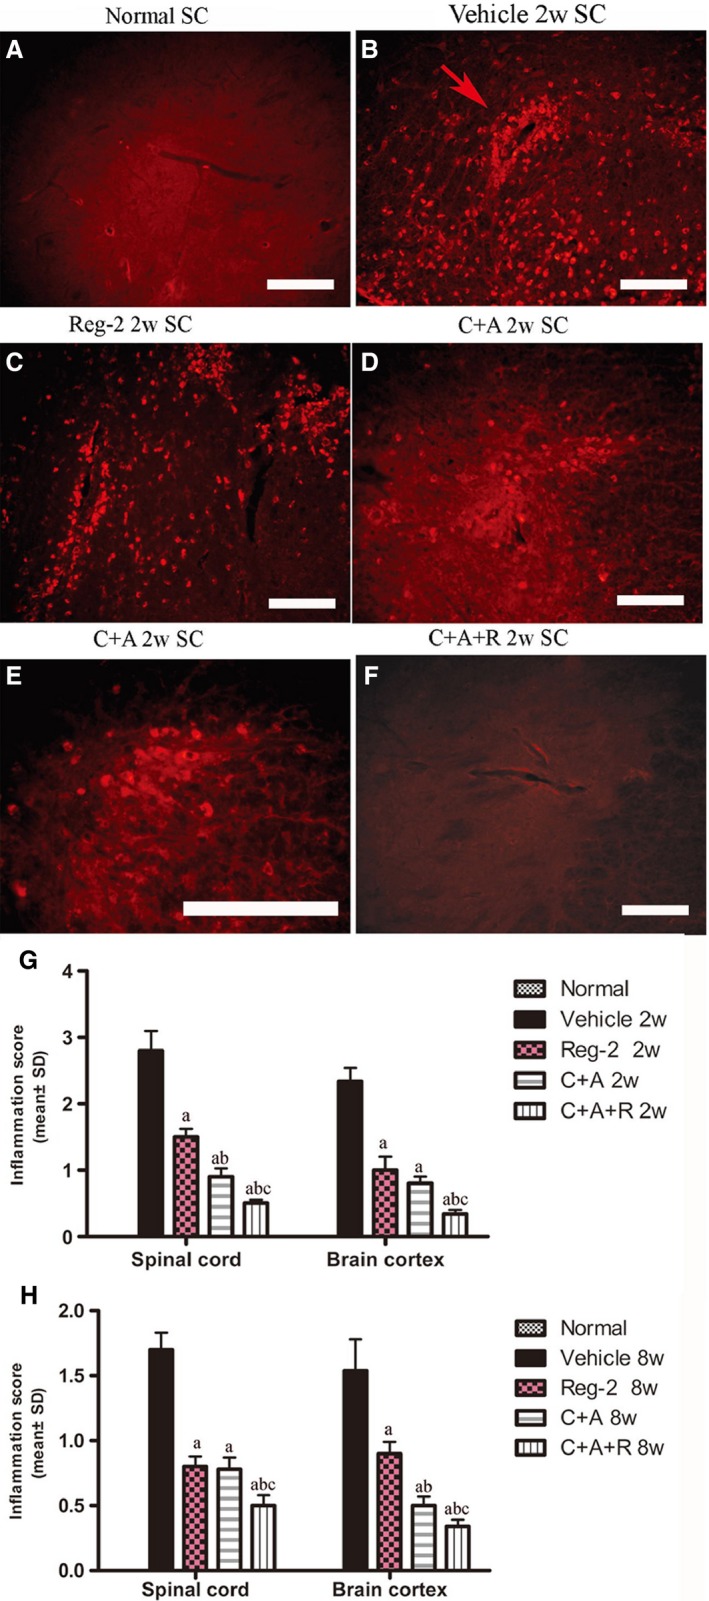
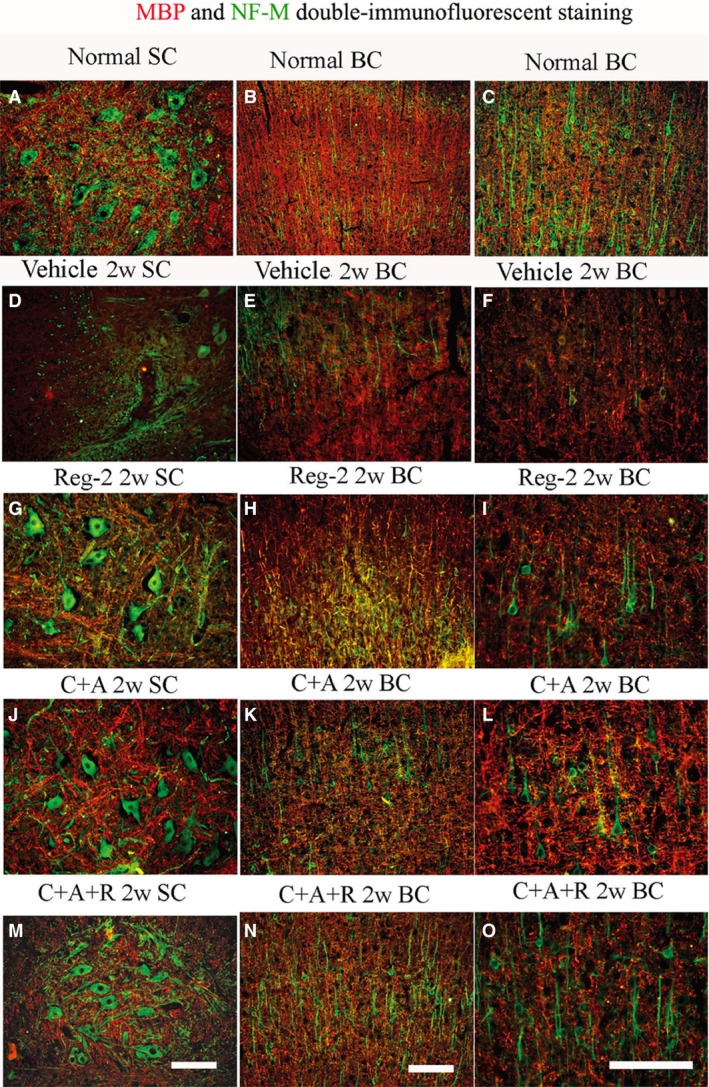
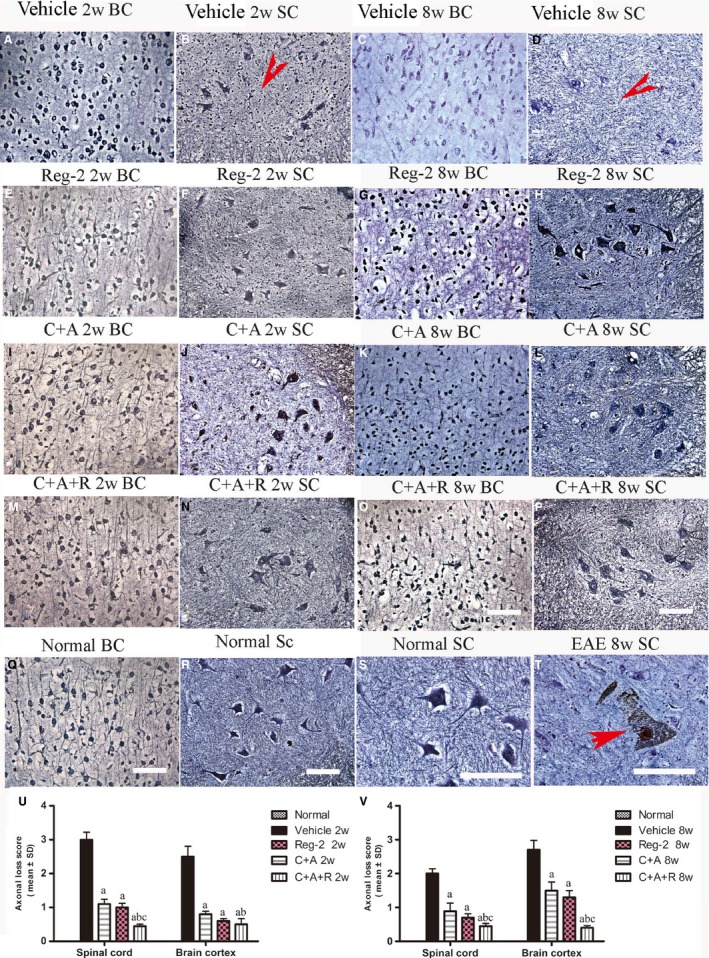
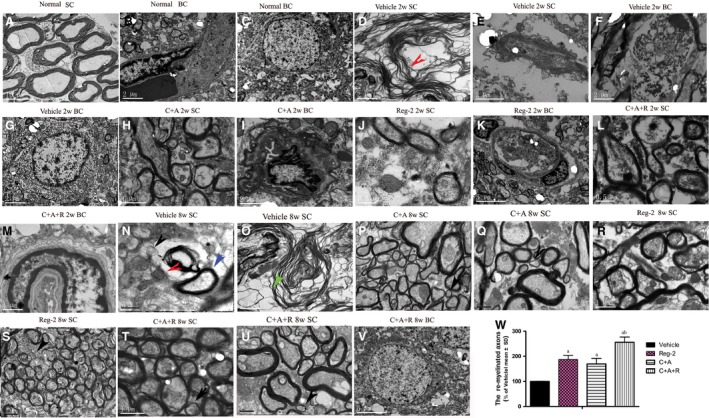
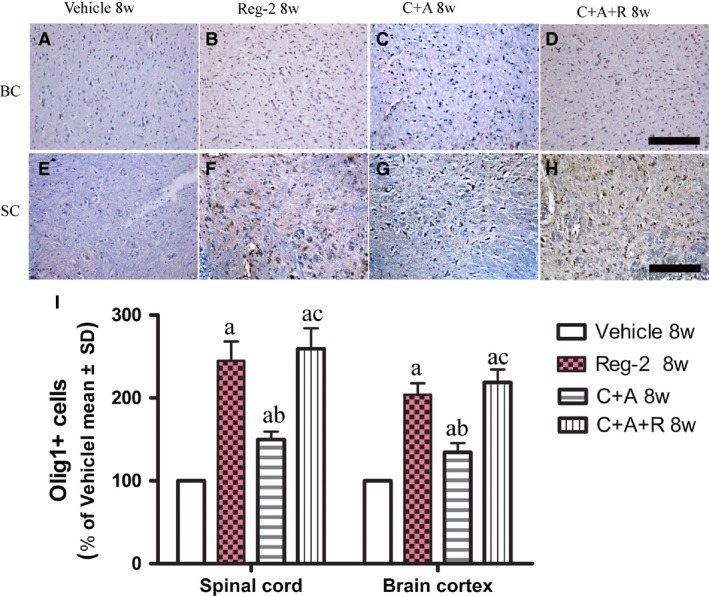
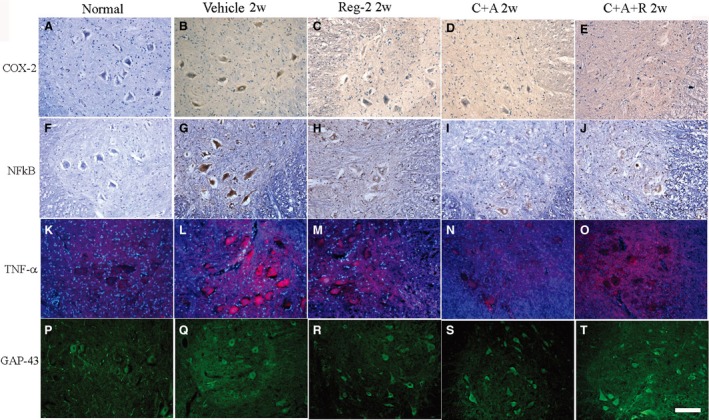
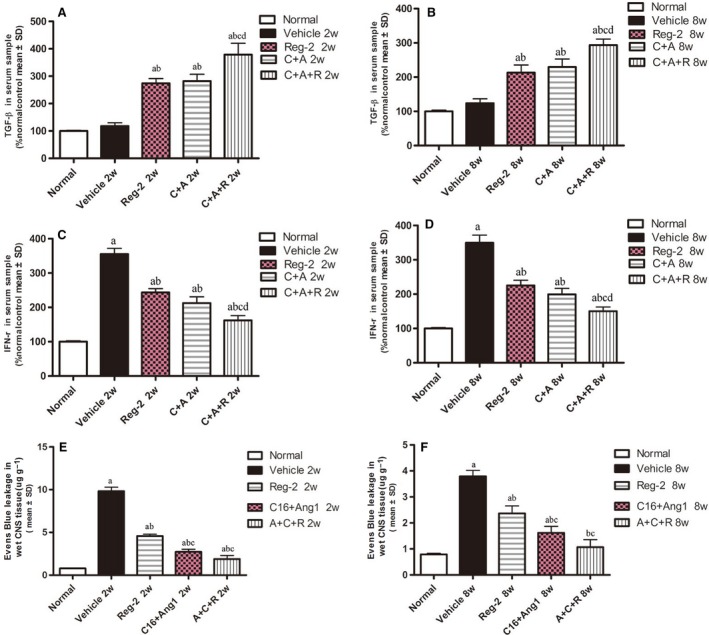
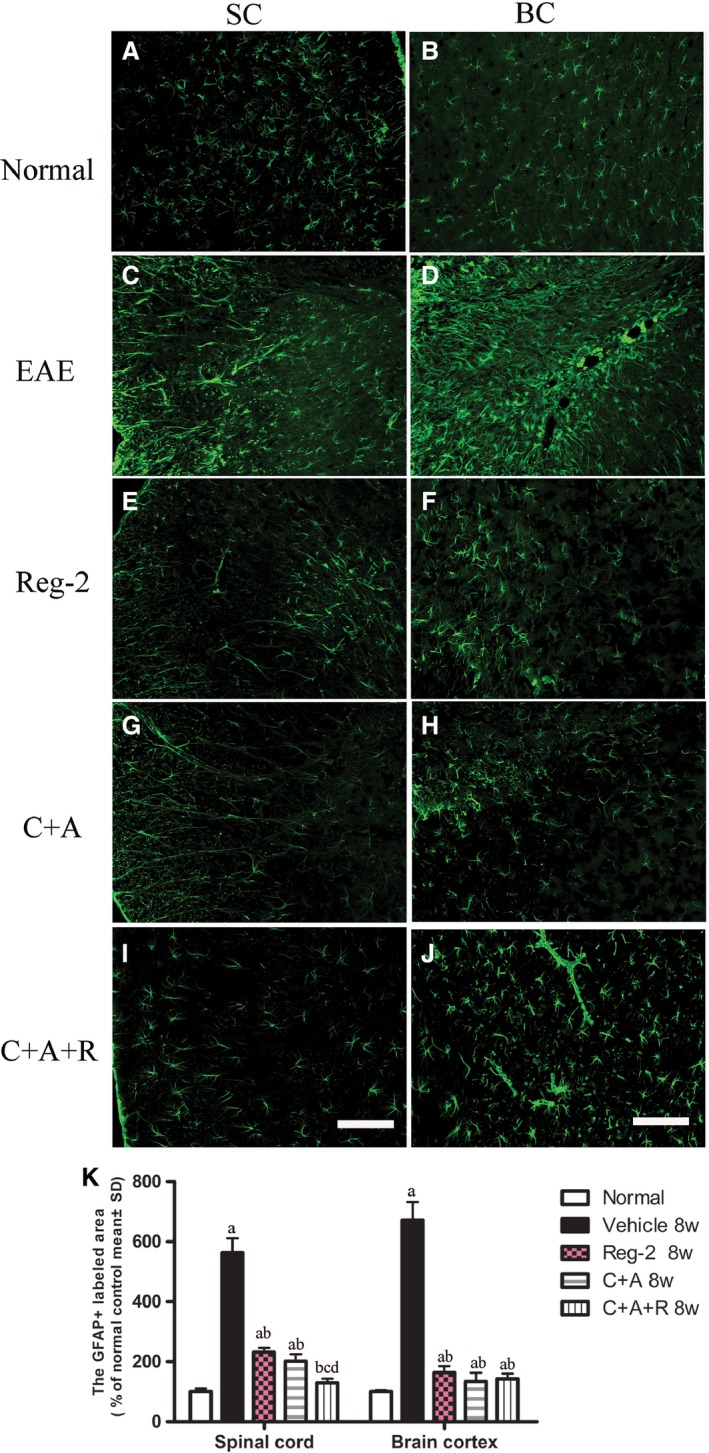
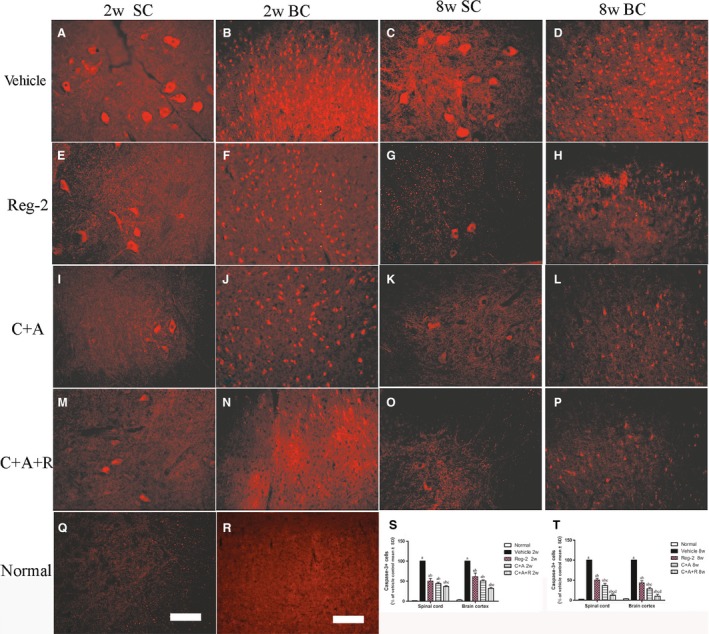
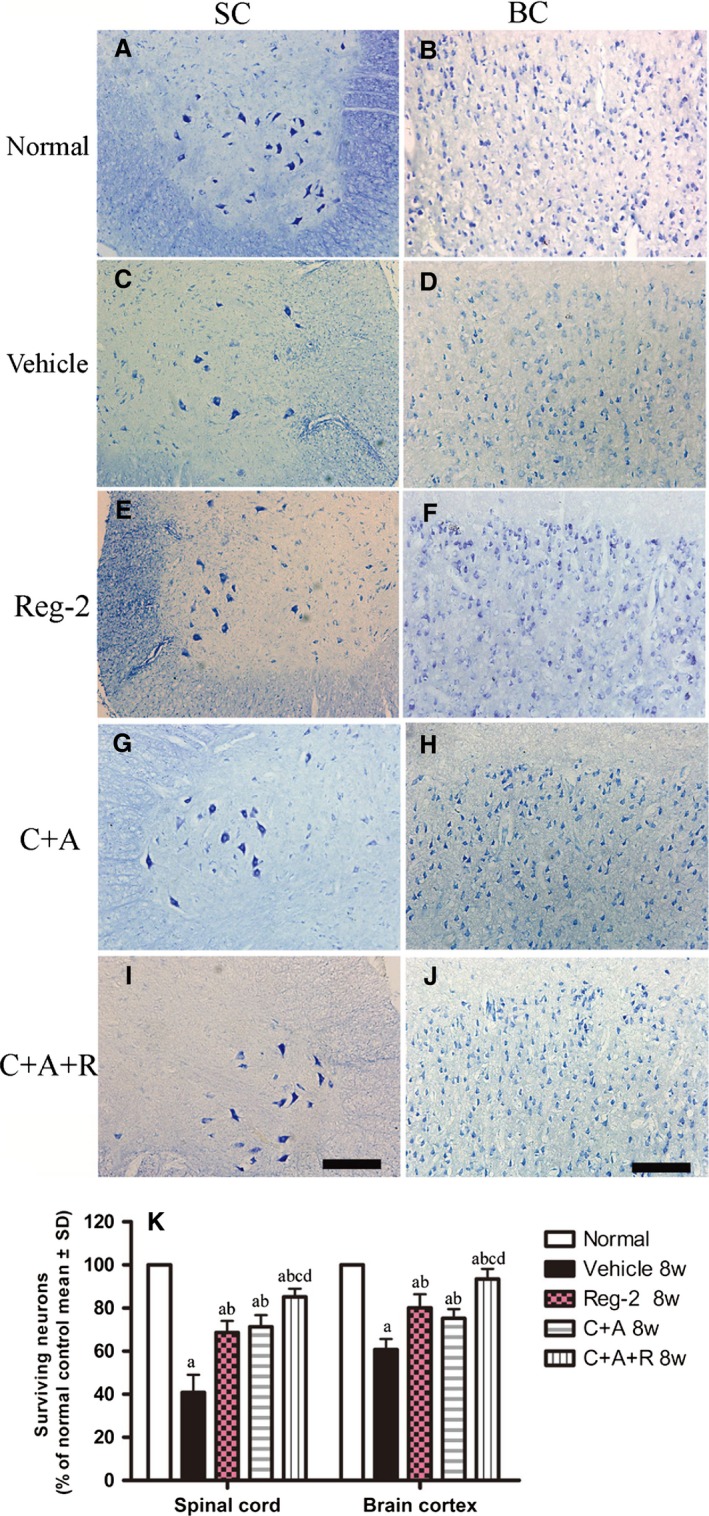
Multiple sclerosis (MS) is a chronic neurological disorder that affects the central nervous system (CNS), and results in CNS inflammation and damage to myelin. In this study, we examined the possible synergistic effects of C16, angiopoietin-1 (Ang-1) and regeneration gene protein 2 (Reg-2) in alleviating inflammation in an acute experimental autoimmune encephalomyelitis (EAE) model. We employed multiple histological, morphological and iconographic assays to examine the effect of those drugs on disease onset, clinical scores and behavioral deficits. Our results demonstrated that triple combination therapy was more efficient than the monotherapy in EAE treatment. The triple therapy significantly delayed the onset of motor symptoms, reduced disease severity, attenuated inflammatory cell infiltration and suppressed the secretion of proinflammatory cytokines. Additionally, treatment increased anti-inflammatory cytokines expression, inhibited reactive astrocytes proliferation, reduced demyelination and axonal loss, and finally reduced the neural death. Specifically, Reg-2 administration rescued oligodendrocytes and neuronal axons mainly by direct neurotrophic effects, while C16+Ang-1 (C+A) mainly improved the inflammatory milieu. In conclusion, our study suggests a possible synergistic effect through targeting a variety of pathways in relieving the clinical symptoms of inflammation in acute EAE model. Therefore, using molecules that target different molecular pathways can be beneficial for exploring novel therapeutic approaches for MS treatment.

Keywords: C16; angiopoietin-1; complementary effects; encephalomyelitis; regeneration gene protein 2.


Figures

Figure 1
Figure 1
Combination treatment of C16, Ang1 and Reg‐2 improves the clinical progression of EAE. Clinical progression of EAE was attenuated after treatment with C+A, Reg‐2 and C+A+R, as measured by disease scoring (n = 11 in each group). *P < 0.05 vs. vehicle‐treated group at the same time point. **P < 0.01 vs. vehicle‐treated group at the same time point. The onset stage of EAE symptoms in the vehicle group was 1 week Pi, and peaked at 2 weeks Pi. However, a significant delay in the onset of clinical signs and postponing the peak stage of EAE symptoms were observed in C+A‐, Reg‐2‐ and C+A+R‐treated groups. Moreover, the clinical scores were lower in the C+A+R‐treated group than in the other two groups. The clinical scores in the C+A‐ and C+A+R‐treated rats were significantly lower than those of the Reg‐2‐treated group at 1–2 weeks Pi (&P < 0.05). At 7 weeks Pi, the clinical score of the C+A+R group was lower than in the C+A group (#P < 0.05) vs. C+A‐treated EAE rats, Scoring was performed by observers blind to the treatment groups.
Figure 2
Figure 2
At 2 weeks Pi, infiltration of inflammatory CD68+ (a marker for extravasated macrophages) cells (B) was observed surrounding blood vessels and in the parenchyma of spinal cord in vehicle‐treated EAE rats. The C+A and Reg‐2, and especially the C+A+R, applications could evidently alleviate this phenomenon. CD68 immunofluorescence staining, scale bar: 100 μm. (E) is the regional magnification of (D), which showed the morphological feature of macrophages. The arrow in (B) shows the infiltrated inflammatory cells surrounding blood vessels as ‘perivascular cuffing’. SC, transverse sections through the anterior horn of the lumbar spinal; BC, coronal sections of the motor cortex. (G,H) C16, Ang1 and Reg‐2 treatment attenuated CNS inflammation at (G) 2 and (H) 8 weeks Pi, as shown by inflammation scoring. (a) P < 0.05 vs. vehicle‐treated EAE rats; (b) P < 0.05 vs. Reg‐2‐treated EAE rats; (c) P < 0.05 vs. C+A‐treated EAE rats.
Figure 3
Figure 3
At 2 weeks Pi, the vehicle group revealed visible demyelination (showed by MBP immunofluorescence, red) phenomenon accompanied with the loss of neurofilaments (showed by NF‐M immunofluorescence, green). However, C16, Ang1 and Reg‐2 treatments could reduce demyelination and axonal loss in the CNS following EAE induction, and C+A+R application produced more pronounced effects. Scale bar: 100 μm. SC, transverse sections through the anterior horn of the lumbar spinal; BC, coronal sections of the motor cortex.
Figure 4
Figure 4
C16+Ang1, Reg‐2, and C+A+R treatments alleviated axonal loss revealed by Bielschowsky staining at both 2 and 8 weeks Pi. Scale bar: 100 µm. SC, transverse sections through the anterior horn of the lumbar spinal; BC, coronal sections of the motor cortex. (B,D) In vehicle‐treated EAE rats, numerous axons undergo gradual loss and exhibited deformed and ovoid formation (arrows) and, at 8 weeks Pi, neurons in the anterior horn of the spinal cord presented a dissolving necrotic appearance with only a few remaining neurofilaments (arrow in T), while C16+Ang1 and Reg‐2 treatments preserved more axons in the CNS following EAE induction. The triple treatment group C+A+R application showed the most obvious effects at both (U) 2 and (V) 8 weeks Pi, showed by estimated axonal loss score. (a) P < 0.05 vs. vehicle‐treated EAE rats; (b) P < 0.05 vs. Reg‐2‐treated EAE rats; (c) P < 0.05 vs. C+A‐treated EAE rats.
Figure 5
Figure 5
Electron micrograph demonstrating the prevention of perivascular edema, demyelination/axon loss, and neuronal apoptosis in C16+Ang1‐, Reg‐2‐ and C+A+R‐treated groups. (A–C) Normal control rats (A) normal myelinated axons exhibiting dark, ring‐shaped myelin sheaths surrounding axons; (B) blood vessel with normal shape, arrow indicates an endothelial cell; (C) normal neuronal nuclei with uncondensed chromatin; (D–G) vehicle‐treated EAE rats 2 weeks Pi. (D) Myelin sheath displaying splitting, vacuoles, loose and fused changes, and shrunken, atrophied axons (red arrow). (E) Severe blood vessel leakage and tissue edema was detected in the extracellular space surrounding the vessels. (F) A necrotic neuron with large vacuoles and degenerated organelles in the perikaryon, rupturing cytoplasmic membrane and oncolytic chromatin. (G) Neuron showing apoptotic signs with a shrunken nucleus and condensed, fragmented and marginated nuclear chromatin. In the meantime, in C+A‐ (H,I), Reg‐2‐ (J,K), and C+A+R‐ (L,M)treated groups, myelin sheath splitting, axonal loss and perivascular edema were reduced. At week 8 Pi, many myelin lamellae were still undergoing vesicular disintegration and demyelination (N,O). The unmyelinated axons showed swollen axon profiles and contained vesicles (black arrows in N), tubulo‐vesicular structures and small mitochondria (red arrows in N), some fibers were completely lost and a disintegrated empty circle of myelin was left (green arrow in O). On the contrary, in C+A (P,Q), Reg‐2 (R,S) and C+A+R (T,U), the newly formed myelin sheaths surrounding intact axons (red arrows P–U), the morphology nucleus were relatively normal, especially in the C+A+R‐treated group (V). (W) Quantification of thinly re‐myelinated axons revealed that the thinly myelinated axons were increased in all treatment groups vs. the vehicle group (P < 0.05). (A) Scale bar: 10 μm; (K,V) scale bar: 5 μm; (B–G, I,O) scale bar: 2 μm; (H, P, R, S, M,T, U) scale bar: 1 μm; (J, L, N, Q) scale bar: 0.5 μm. SC, transverse sections through the anterior horn of the lumbar spinal; BC, coronal sections of the motor cortex.
Figure 6
Figure 6
At 8 weeks Pi, Reg‐2 and C+A+R treatments enhanced oligodendrocyte progenitor cells (OPCs) proliferation, as demonstrated by Olig1 immunostaining (A–H, counterstained with hematoxylin). Scale bar: 100 μm. SC, transverse sections through the anterior horn of the lumbar spinal; BC, coronal sections of the motor cortex. (a) P < 0.05 vs. vehicle‐treated EAE rats; (b) P < 0.05 vs. Reg‐2‐treated EAE rats; (c) P < 0.05 vs. C+A‐treated EAE rats.
Figure 7
Figure 7
At 2 weeks Pi, pre‐inflammatory factors COX‐2 (A–E, immunostaining, counterstained with hematoxylin), NFκB (F–J, immunostaining, counterstained with hematoxylin), TNF‐α (K–O, red color immunofluorescence staining, nuclei of all cells were stained with blue color of Hoechst 33342) and GAP‐43 (P–T, green color immunofluorescence staining) exhibited visible expression levels in the lumbar spinal cord anterior horn. Scale bar: 100 μm. COX‐2, NF‐κB and TNF‐α were all significantly increased in vehicle‐treated EAE rats, while the C+A, Reg‐2 and C+A+R treatments could markedly reduce the expression of those factors. Moreover, treatment with C+A, Reg‐2 and C+A+R upregulated the expression of GAP‐43.
Figure 8
Figure 8
(A–D) Ang‐1+C16, Reg‐2 and most notably C+A+R treatments effectively reduced the expression of the proinflammatory cytokines IFN‐γ, which were upregulated in vehicle‐treated EAE rats (A,B). However, the anti‐inflammatory cytokines TGF‐β (C,D) increased with CNTF and Reg‐2 treatments. Quantification of the proinflammatory cytokine IFN‐γ and anti‐inflammatory cytokines TGF‐β in serum samples at weeks 2 (A,C) and 8 (B,D) Pi by ELISA. (E–F) Evans blue extravasation was significantly higher in vehicle‐treated EAE rats, but was reduced in C16+Ang1 and Reg‐2, especially the C+A+R application at 2 (E) and 8 (F) weeks Pi. (a) P < 0.05 vs. normal control; (b) P < 0.05 vs. vehicle‐treated EAE rats; (c) P < 0.05 vs. Reg‐2‐treated EAE rats; (d) P < 0.05 vs. C+A‐treated EAE rats.
Figure 9
Figure 9
C+A, Reg‐2 and C+A+R treatments inhibit reactive gliosis in EAE rats at 8 weeks Pi. Green immunofluorescence indicates GFAP staining, Scale bar: 100 μm. (a) P < 0.05 vs. normal control; (b) P < 0.05 vs. vehicle‐treated EAE rats; (c) P < 0.05 vs. Reg‐2‐treated EAE rats; (d) P < 0.05 vs. C+A‐treated EAE rats. SC, transverse sections through the anterior horn of the lumbar spinal; BC, coronal sections of the motor cortex.
Figure 10
Figure 10
In vehicle‐treated EAE rats, the expression of active caspase‐3 was markedly increased. This phenomenon could be reversed by C+A, Reg‐2 and C+A+R treatments, more evidently at 8 weeks post‐immunization, as shown by calculated red color immunofluorescence‐stained caspase‐3‐positive cells (scale bar: 100 µm). (a) P < 0.05 vs. normal control; (b) P < 0.05 vs. vehicle‐treated EAE rats; (c) P < 0.05 vs. Reg‐2‐treated EAE rats; (d) P < 0.05 vs. C+A‐treated EAE rats. SC, transverse sections through the anterior horn of the lumbar spinal; BC, coronal sections of the motor cortex.
Figure 11
Figure 11
(A–J) Treatment with C+A, Reg‐2 and C+A+R reduced neuronal loss in the spinal cord and brain as verified by Nissl staining at 8 weeks Pi; scale bar: 100 μm. SC, transverse sections through the anterior horn of the lumbar spinal; BC, coronal sections of the motor cortex. (K) Surviving neural cells calculated in different groups at 8 weeks Pi following Nissl staining (each group is presented as a percentage of the normal control). (a) P < 0.05 vs. normal control; (b) P < 0.05 vs. vehicle‐treated EAE rats.

Similar articles

Cited by

References

    1. Albrecht PJ, Enterline JC, Cromer J, et al. (2007) CNTF‐activated astrocytes release a soluble trophic activity for oligodendrocyte progenitors. Neurochem Res 32, 263–271. - PubMed
    1. All AH, Walczak P, Agrawal G, et al. (2009) Effect of MOG sensitization on somatosensory evoked potential in Lewis rats. J Neurol Sci 284, 81–89. - PMC - PubMed
    1. Amadio S, Pluchino S, Brini E, et al. (2006) Motor evoked potentials in a mouse model of chronic multiple sclerosis. Muscle Nerve 33, 265–273. - PubMed
    1. Arellano G, Ottum PA, Reyes LI, et al. (2015) Stage‐specific role of interferon‐gamma in experimental autoimmune encephalomyelitis and multiple sclerosis. Front Immunol 6, 492. - PMC - PubMed
    1. Baker D, Amor S (2014) Experimental autoimmune encephalomyelitis is a good model of multiple sclerosis if used wisely. Mult Scler Relat Disord 3, 555–564. - PubMed

Publication types

MeSH terms

LinkOut - more resources