

Hydrogen peroxide-mediated conversion of coproheme to heme b by HemQ-lessons from the first crystal structure and kinetic studies
- PMID: 27758026
- PMCID: PMC5157759
- DOI: 10.1111/febs.13930
Hydrogen peroxide-mediated conversion of coproheme to heme b by HemQ-lessons from the first crystal structure and kinetic studies
Abstract
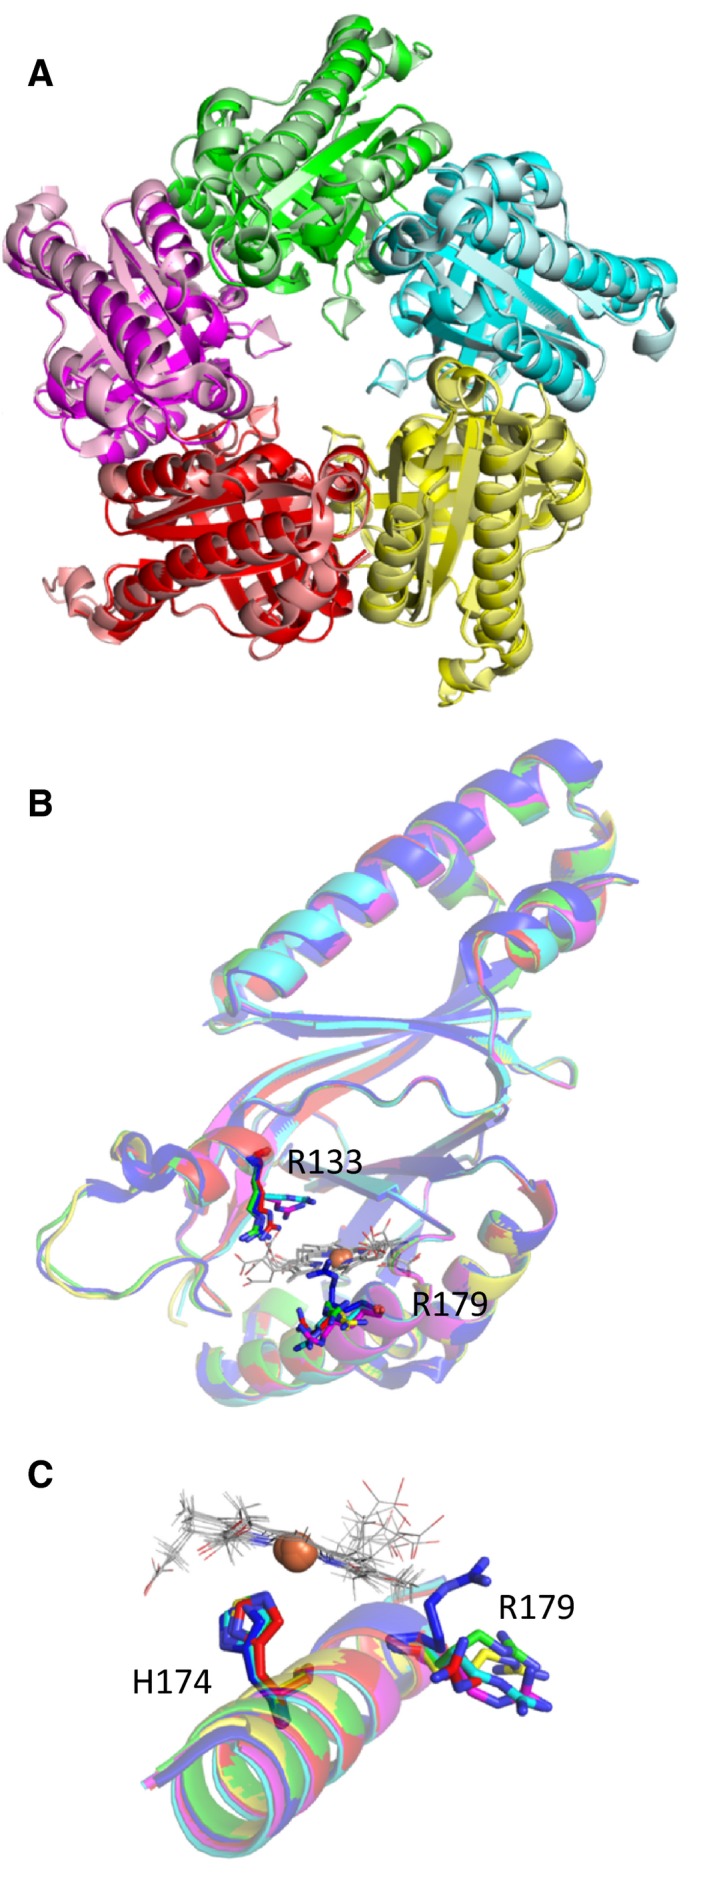
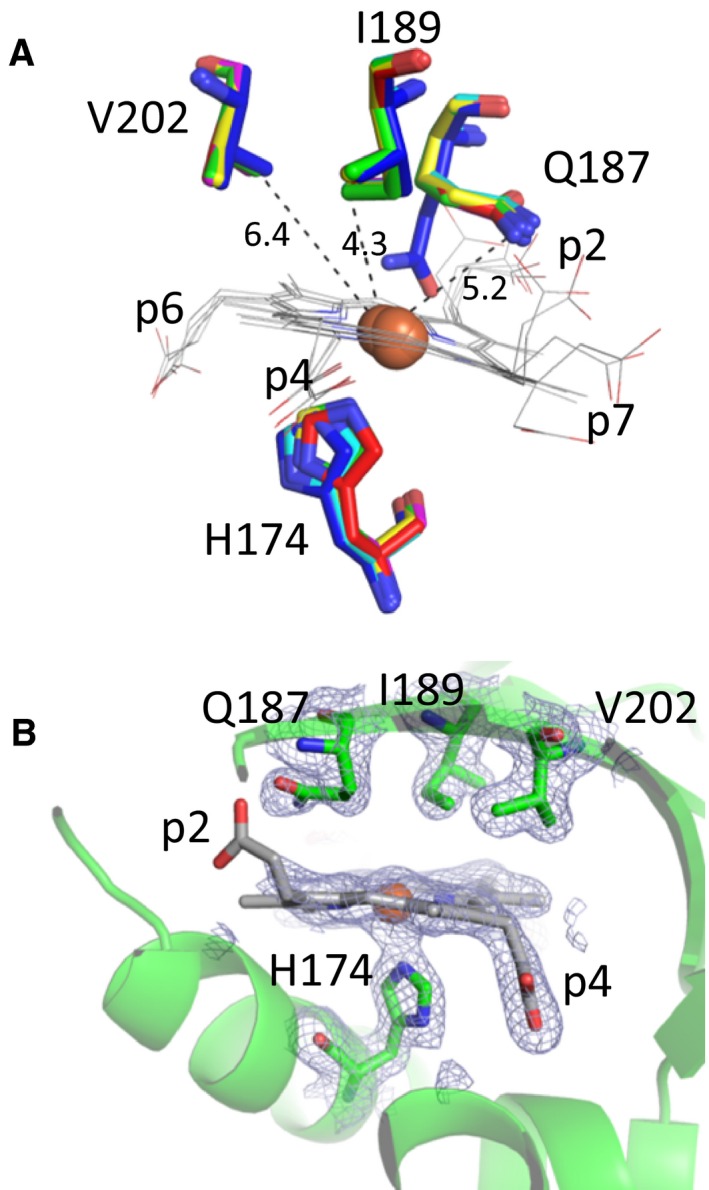
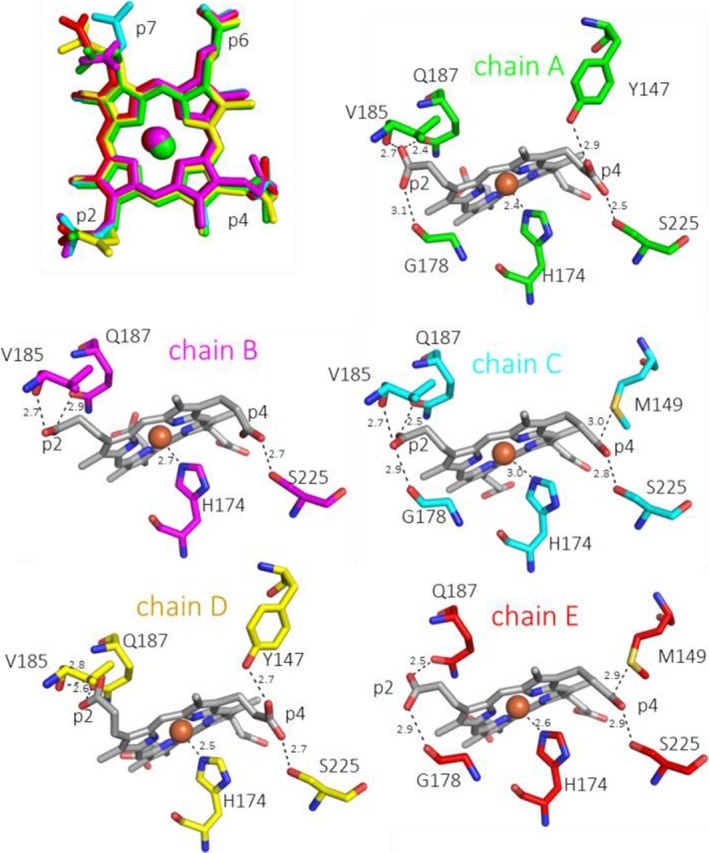
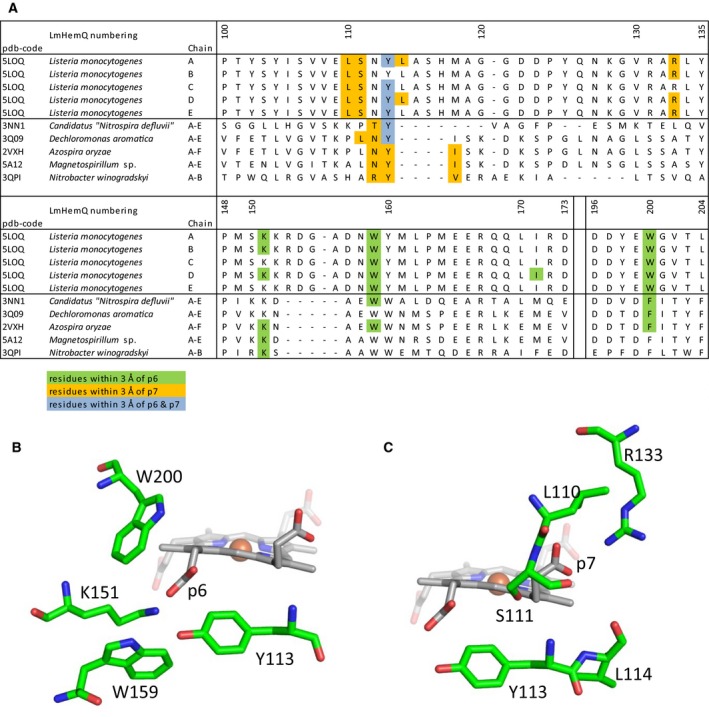
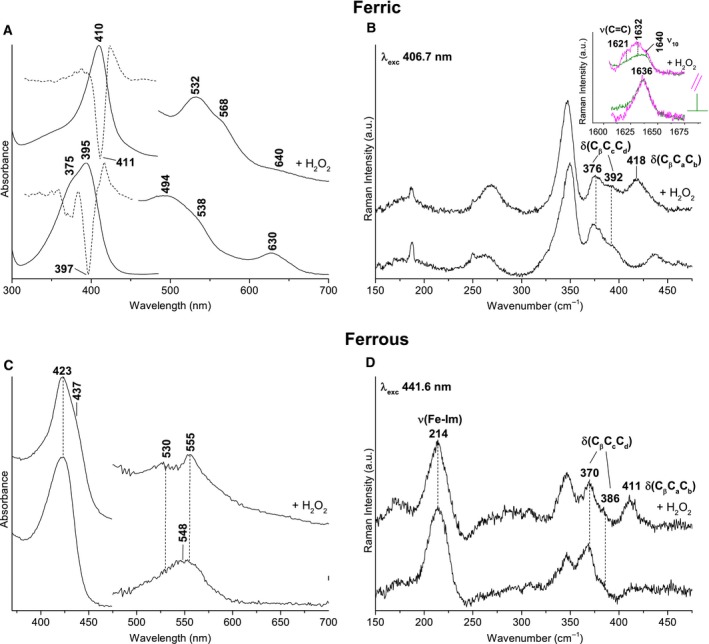
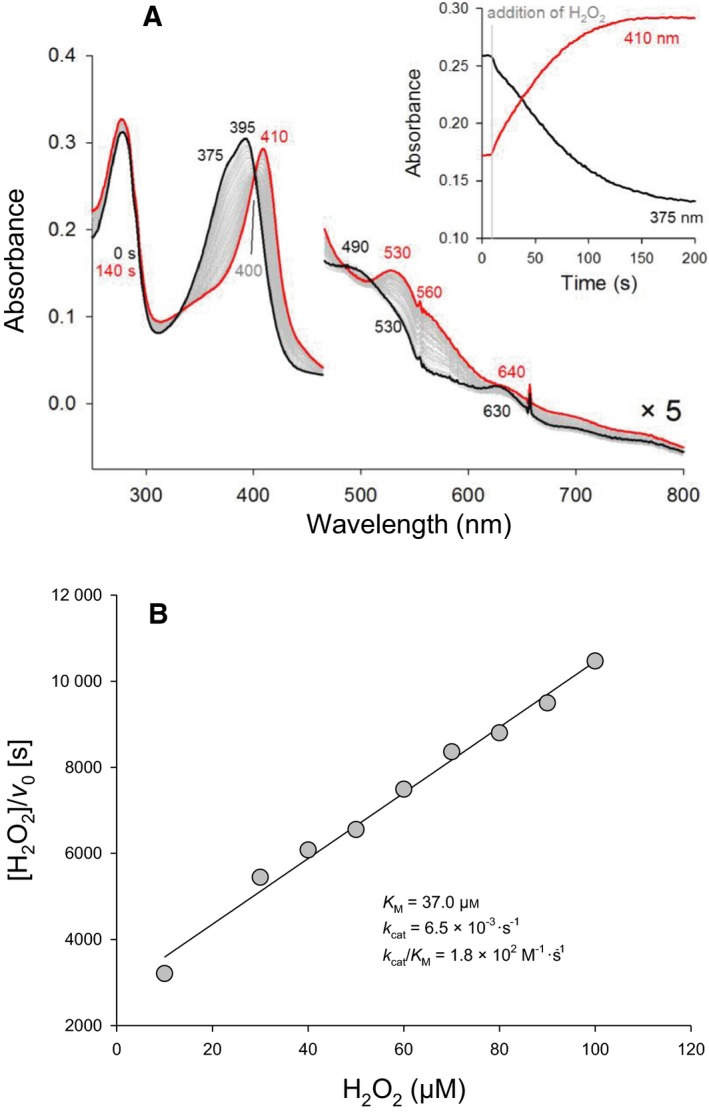
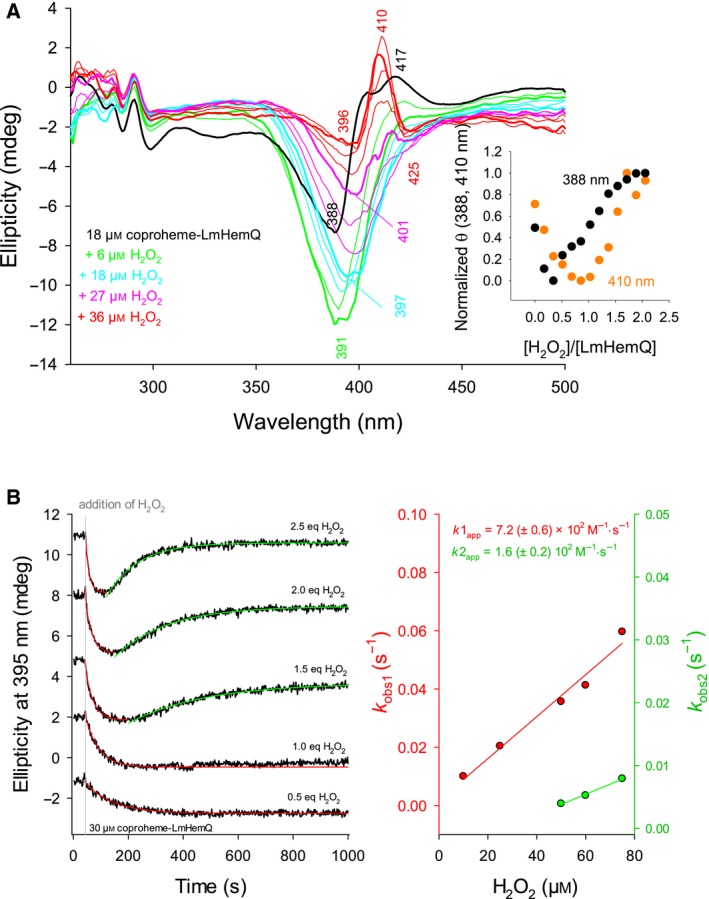
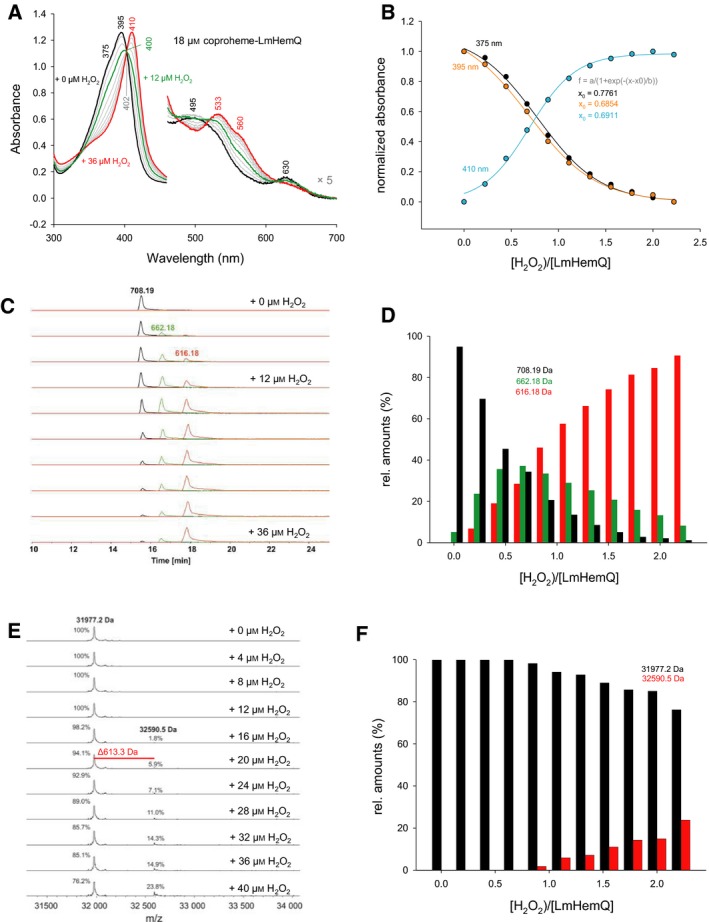
Heme biosynthesis in Gram-positive bacteria follows a recently described coproporphyrin-dependent pathway with HemQ catalyzing the decarboxylation of coproheme to heme b. Here we present the first crystal structure of a HemQ (homopentameric coproheme-HemQ from Listeria monocytogenes) at 1.69 Å resolution and the conversion of coproheme to heme b followed by UV-vis and resonance Raman spectroscopy as well as mass spectrometry. The ferric five-coordinated coproheme iron of HemQ is weakly bound by a neutral proximal histidine H174. In the crystal structure of the resting state, the distal Q187 (conserved in Firmicutes HemQ) is H-bonded with propionate p2 and the hydrophobic distal cavity lacks solvent water molecules. Two H2 O2 molecules are shown to be necessary for decarboxylation of the propionates p2 and p4, thereby forming the corresponding vinyl groups of heme b. The overall reaction is relatively slow (kcat /KM = 1.8 × 10² m-1 ·s-1 at pH 7.0) and occurs in a stepwise manner with a three-propionate intermediate. We present the noncovalent interactions between coproheme and the protein and propose a two-step reaction mechanism. Furthermore, the structure of coproheme-HemQ is compared to that of the phylogenetically related heme b-containing chlorite dismutases.
Database: Structural data are available in the PDB under the accession number 5LOQ.
Keywords: Gram-positive pathogens; HemQ; coproheme; heme b; heme biosynthesis.
© 2016 The Authors The FEBS Journal published by John Wiley & Sons Ltd on behalf of Federation of European Biochemical Societies.
Figures
Similar articles
-
Reactions of Ferrous Coproheme Decarboxylase (HemQ) with O2 and H2O2 Yield Ferric Heme b.Biochemistry. 2017 Jan 10;56(1):189-201. doi: 10.1021/acs.biochem.6b00958. Epub 2016 Dec 16. Biochemistry. 2017. PMID: 27982566 Free PMC article.
-
Crystal structures and calorimetry reveal catalytically relevant binding mode of coproporphyrin and coproheme in coproporphyrin ferrochelatase.FEBS J. 2020 Jul;287(13):2779-2796. doi: 10.1111/febs.15164. Epub 2019 Dec 19. FEBS J. 2020. PMID: 31794133 Free PMC article.
-
Chemistry and Molecular Dynamics Simulations of Heme b-HemQ and Coproheme-HemQ.Biochemistry. 2016 Sep 27;55(38):5398-412. doi: 10.1021/acs.biochem.6b00701. Epub 2016 Sep 15. Biochemistry. 2016. PMID: 27599156 Free PMC article.
-
HemQ: An iron-coproporphyrin oxidative decarboxylase for protoheme synthesis in Firmicutes and Actinobacteria.Arch Biochem Biophys. 2015 May 15;574:27-35. doi: 10.1016/j.abb.2015.02.017. Epub 2015 Feb 21. Arch Biochem Biophys. 2015. PMID: 25711532 Free PMC article. Review.
-
Understanding molecular enzymology of porphyrin-binding α + β barrel proteins - One fold, multiple functions.Biochim Biophys Acta Proteins Proteom. 2021 Jan;1869(1):140536. doi: 10.1016/j.bbapap.2020.140536. Epub 2020 Sep 4. Biochim Biophys Acta Proteins Proteom. 2021. PMID: 32891739 Free PMC article. Review.
Cited by
-
Structure-Based Mechanism for Oxidative Decarboxylation Reactions Mediated by Amino Acids and Heme Propionates in Coproheme Decarboxylase (HemQ).J Am Chem Soc. 2017 Feb 8;139(5):1900-1911. doi: 10.1021/jacs.6b11324. Epub 2017 Jan 27. J Am Chem Soc. 2017. PMID: 27936663 Free PMC article.
-
Reorienting Mechanism of Harderoheme in Coproheme Decarboxylase-A Computational Study.Int J Mol Sci. 2022 Feb 25;23(5):2564. doi: 10.3390/ijms23052564. Int J Mol Sci. 2022. PMID: 35269706 Free PMC article.
-
Insights into the Active Site of Coproheme Decarboxylase from Listeria monocytogenes.Biochemistry. 2018 Apr 3;57(13):2044-2057. doi: 10.1021/acs.biochem.8b00186. Epub 2018 Mar 22. Biochemistry. 2018. PMID: 29536725 Free PMC article.
-
Insights into the flexibility of the domain-linking loop in actinobacterial coproheme decarboxylase through structures and molecular dynamics simulations.Protein Sci. 2025 Feb;34(2):e70027. doi: 10.1002/pro.70027. Protein Sci. 2025. PMID: 39865384 Free PMC article.
-
The hydrogen bonding network of coproheme in coproheme decarboxylase from Listeria monocytogenes: Effect on structure and catalysis.J Inorg Biochem. 2019 Jun;195:61-70. doi: 10.1016/j.jinorgbio.2019.03.009. Epub 2019 Mar 21. J Inorg Biochem. 2019. PMID: 30925402 Free PMC article.
References
-
- Lobo SA, Scott A, Videira MA, Winpenny D, Gardner M, Palmer MJ, Schroeder S, Lawrence AD, Parkinson T, Warren MJ et al (2015) Staphylococcus aureus haem biosynthesis: characterisation of the enzymes involved in final steps of the pathway. Mol Microbiol 97, 472–487. - PubMed
-
- Magiorakos AP, Srinivasan A, Carey RB, Carmeli Y, Falagas ME, Giske CG, Harbarth S, Hindler JF, Kahlmeter G, Olsson‐Liljequist B et al (2012) Multidrug‐resistant, extensively drug‐resistant and pandrug‐resistant bacteria: an international expert proposal for interim standard definitions for acquired resistance. Clin Microbiol Infect 18, 268–281. - PubMed
Publication types
MeSH terms
Substances
Grants and funding
LinkOut - more resources
Full Text Sources
Other Literature Sources
Molecular Biology Databases
Miscellaneous
