

Quantitative Identification of Compound-Dependent On-Modules and Differential Allosteric Modules From Homologous Ischemic Networks
- PMID: 27758049
- PMCID: PMC5080653
- DOI: 10.1002/psp4.12127
Quantitative Identification of Compound-Dependent On-Modules and Differential Allosteric Modules From Homologous Ischemic Networks
Abstract
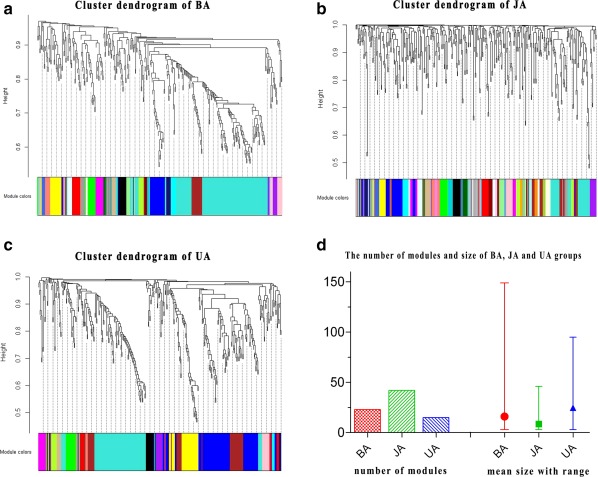
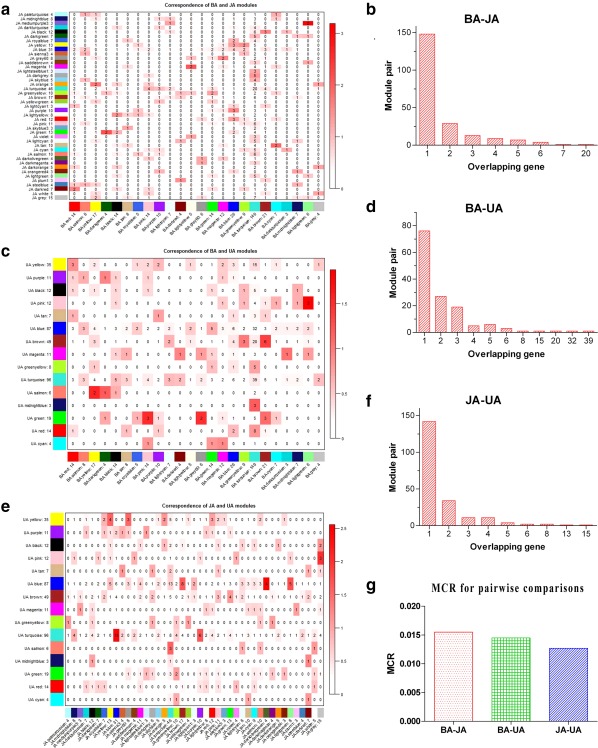
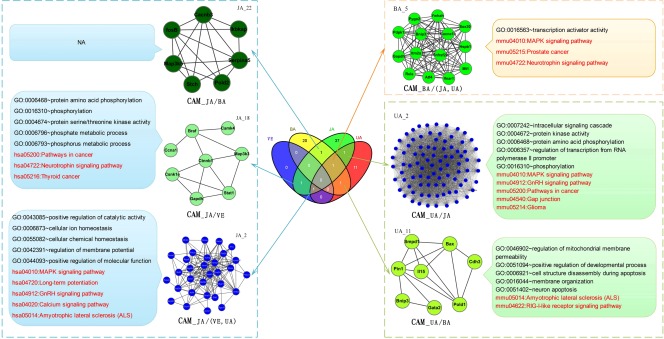
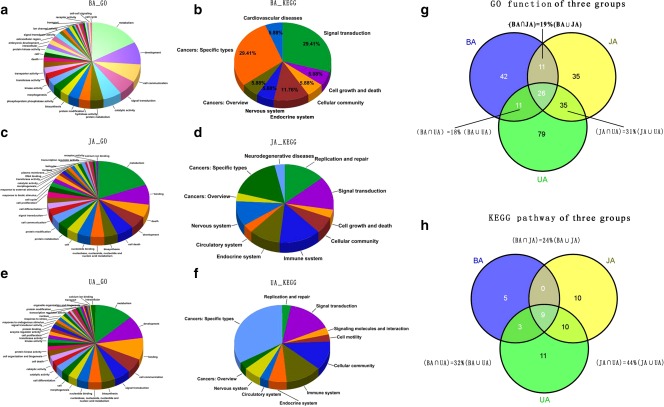
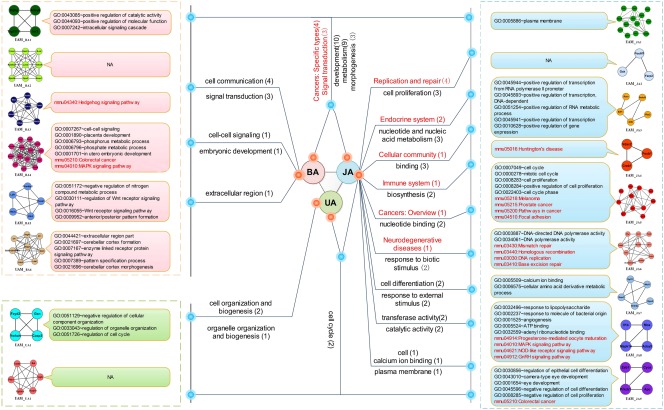
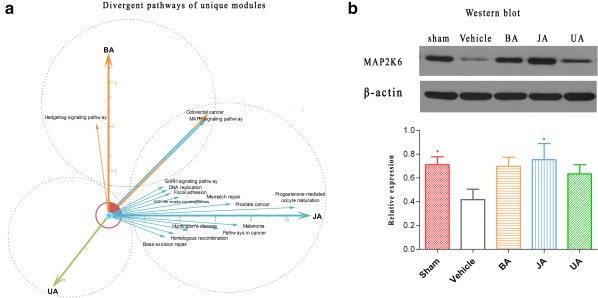
Module-based methods have made much progress in deconstructing biological networks. However, it is a great challenge to quantitatively compare the topological structural variations of modules (allosteric modules [AMs]) under different situations. A total of 23, 42, and 15 coexpression modules were identified in baicalin (BA), jasminoidin (JA), and ursodeoxycholic acid (UA) in a global anti-ischemic mice network, respectively. Then, we integrated the methods of module-based consensus ratio (MCR) and modified Zsummary module statistic to validate 12 BA, 22 JA, and 8 UA on-modules based on comparing with vehicle. The MCRs for pairwise comparisons were 1.55% (BA vs. JA), 1.45% (BA vs. UA), and 1.27% (JA vs. UA), respectively. Five conserved allosteric modules (CAMs) and 17 unique allosteric modules (UAMs) were identified among these groups. In conclusion, module-centric analysis may provide us a unique approach to understand multiple pharmacological mechanisms associated with differential phenotypes in the era of modular pharmacology.
© 2016 The Authors CPT: Pharmacometrics & Systems Pharmacology published by Wiley Periodicals, Inc. on behalf of American Society for Clinical Pharmacology and Therapeutics.
Figures
Similar articles
-
Network-Wide Screen Identifies Variation of Novel Precise On-Module Targets Using Conformational Modudaoism.CPT Pharmacometrics Syst Pharmacol. 2018 Jan;7(1):16-25. doi: 10.1002/psp4.12253. Epub 2017 Nov 20. CPT Pharmacometrics Syst Pharmacol. 2018. PMID: 28925077 Free PMC article.
-
Entropy-based divergent and convergent modular pattern reveals additive and synergistic anticerebral ischemia mechanisms.Exp Biol Med (Maywood). 2016 Dec;241(18):2063-2074. doi: 10.1177/1535370216662361. Epub 2016 Aug 10. Exp Biol Med (Maywood). 2016. PMID: 27480252 Free PMC article.
-
Hierarchical profiles of signaling pathways and networks reveal two complementary pharmacological mechanisms.CNS Neurol Disord Drug Targets. 2013 Sep;12(6):882-93. doi: 10.2174/18715273113129990073. CNS Neurol Disord Drug Targets. 2013. PMID: 23469837
-
Modular pharmacology: deciphering the interacting structural organization of the targeted networks.Drug Discov Today. 2013 Jun;18(11-12):560-6. doi: 10.1016/j.drudis.2013.01.009. Epub 2013 Jan 24. Drug Discov Today. 2013. PMID: 23353707 Review.
-
Decoding the Polyphyletic Flexibility of Allosteric Modular Networks: Progress and Perspectives.Crit Rev Eukaryot Gene Expr. 2016;26(4):279-301. doi: 10.1615/CritRevEukaryotGeneExpr.2016016649. Crit Rev Eukaryot Gene Expr. 2016. PMID: 27910743 Review.
Cited by
-
IMCC: A Novel Quantitative Approach Revealing Variation of Global Modular Map and Local Inter-Module Coordination Among Differential Drug's Targeted Cerebral Ischemic Networks.Front Pharmacol. 2021 Apr 16;12:637253. doi: 10.3389/fphar.2021.637253. eCollection 2021. Front Pharmacol. 2021. PMID: 33935725 Free PMC article.
-
Network-Wide Screen Identifies Variation of Novel Precise On-Module Targets Using Conformational Modudaoism.CPT Pharmacometrics Syst Pharmacol. 2018 Jan;7(1):16-25. doi: 10.1002/psp4.12253. Epub 2017 Nov 20. CPT Pharmacometrics Syst Pharmacol. 2018. PMID: 28925077 Free PMC article.
-
Modular Screening Reveals Driver Induced Additive Mechanisms of Baicalin and Jasminoidin on Cerebral Ischemia Therapy.Front Cardiovasc Med. 2022 Feb 21;9:813983. doi: 10.3389/fcvm.2022.813983. eCollection 2022. Front Cardiovasc Med. 2022. PMID: 35265682 Free PMC article.
-
Modular-Based Synergetic Mechanisms of Jasminoidin and Ursodeoxycholic Acid in Cerebral Ischemia Therapy.Biomedicines. 2025 Apr 11;13(4):938. doi: 10.3390/biomedicines13040938. Biomedicines. 2025. PMID: 40299522 Free PMC article.
-
Pure mechanistic analysis of additive neuroprotective effects between baicalin and jasminoidin in ischemic stroke mice.Acta Pharmacol Sin. 2018 Jun;39(6):961-974. doi: 10.1038/aps.2017.145. Epub 2018 Jan 18. Acta Pharmacol Sin. 2018. PMID: 29345255 Free PMC article.
References
-
- Xiong, M. , Li, B. , Zhu, Q. , Wang, Y.X. & Zhang, H.Y. Identification of transcription factors for drug‐associated gene modules and biomedical implications. Bioinformatics 30, 305–309 (2014). - PubMed
-
- Wang, Z. , Liu, J. , Yu, Y. , Chen, Y. & Wang, Y. Modular pharmacology: the next paradigm in drug discovery. Expert Opin. Drug Discov. 7, 667–677 (2012). - PubMed
-
- Wang, Z. & Wang, Y.Y. Modular pharmacology: deciphering the interacting structural organization of the targeted networks. Drug Discov. Today 18, 560–566 (2013). - PubMed
Publication types
MeSH terms
Substances
LinkOut - more resources
Full Text Sources
Other Literature Sources
