. 2016 Dec 27;10(12):10636-10651.
doi: 10.1021/acsnano.6b02231. Epub 2016 Oct 19.

Gold Nanoparticle Reprograms Pancreatic Tumor Microenvironment and Inhibits Tumor Growth

Affiliations

Gold Nanoparticle Reprograms Pancreatic Tumor Microenvironment and Inhibits Tumor Growth

Sounik Saha et al. ACS Nano. .

Abstract

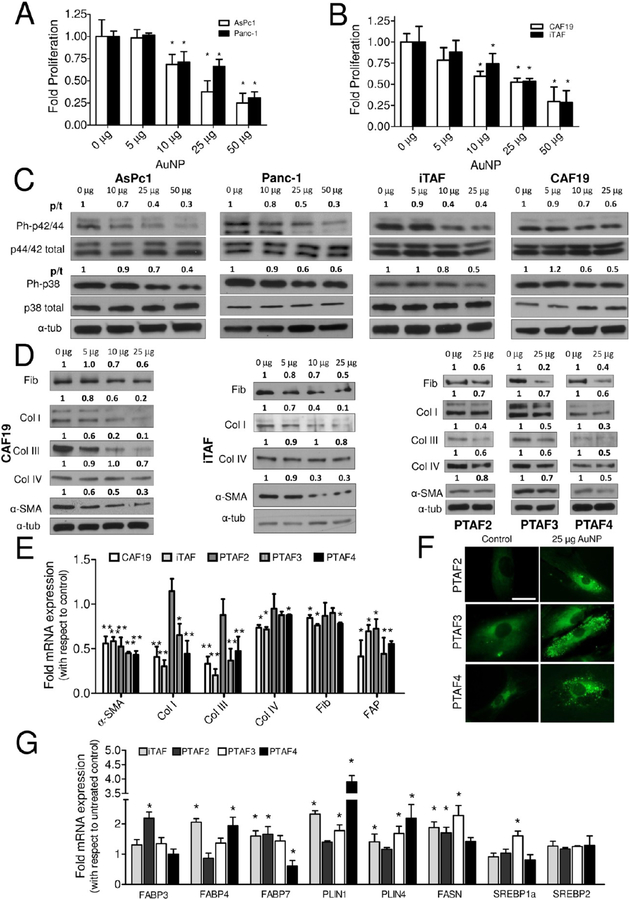
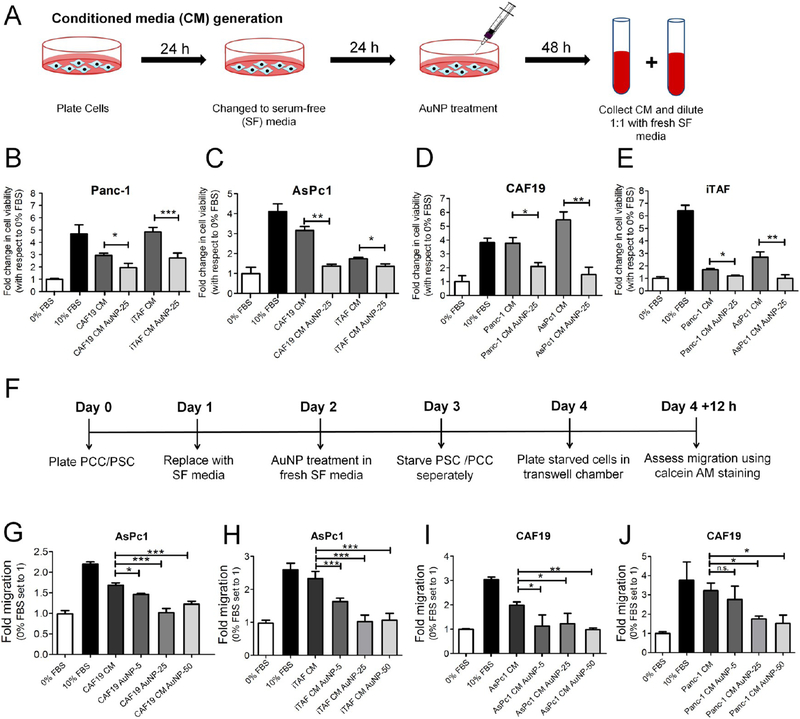
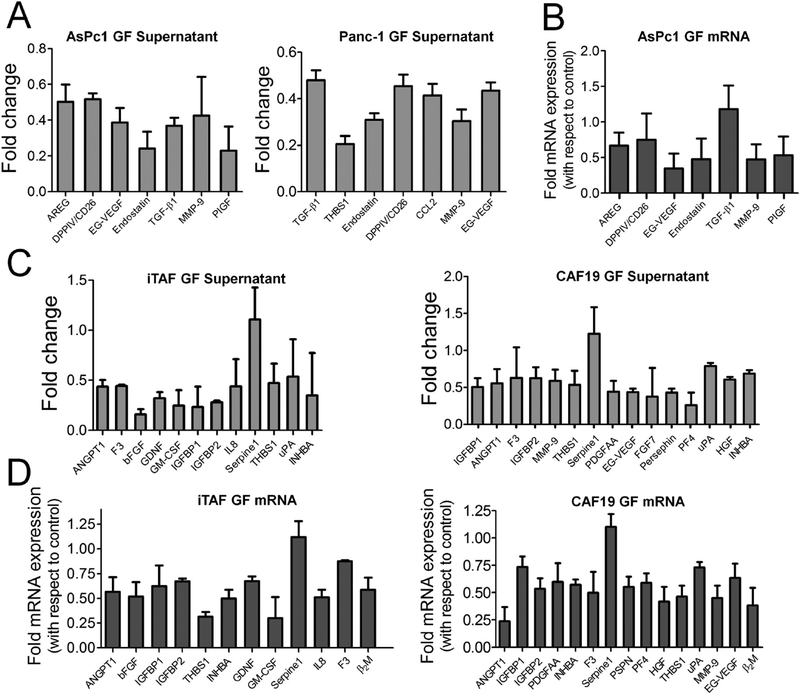
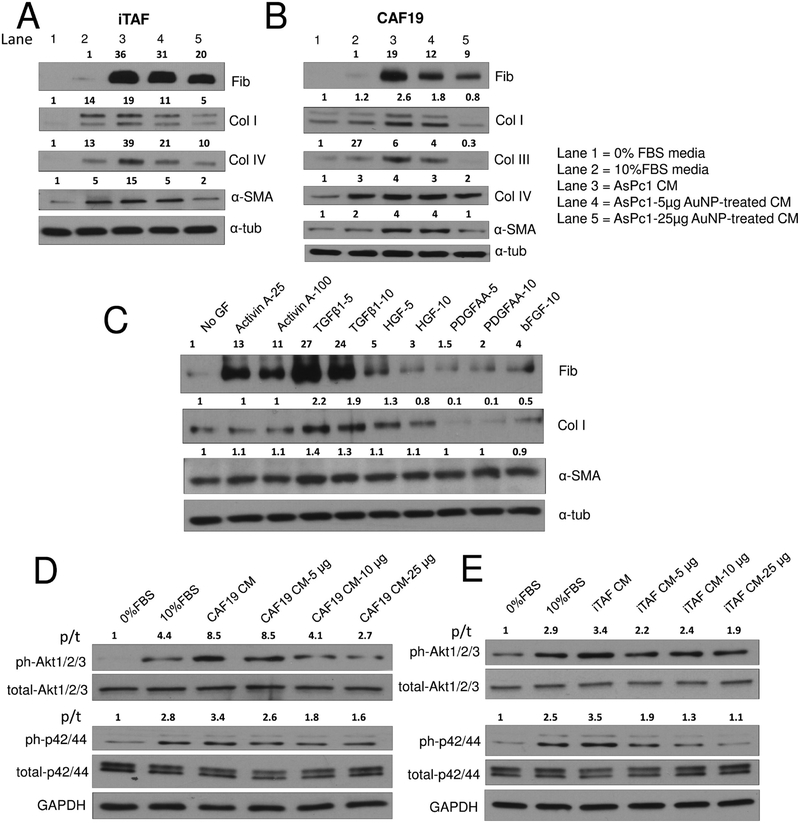
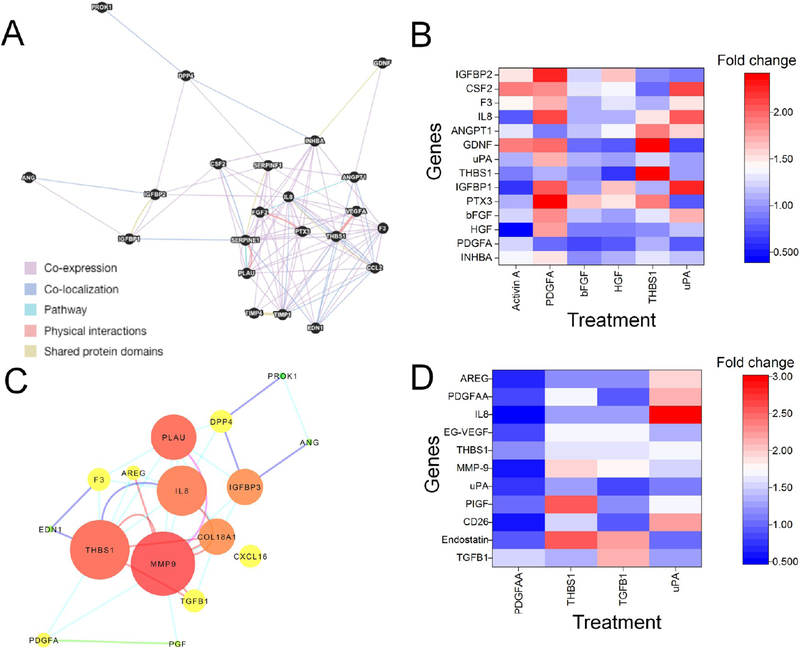
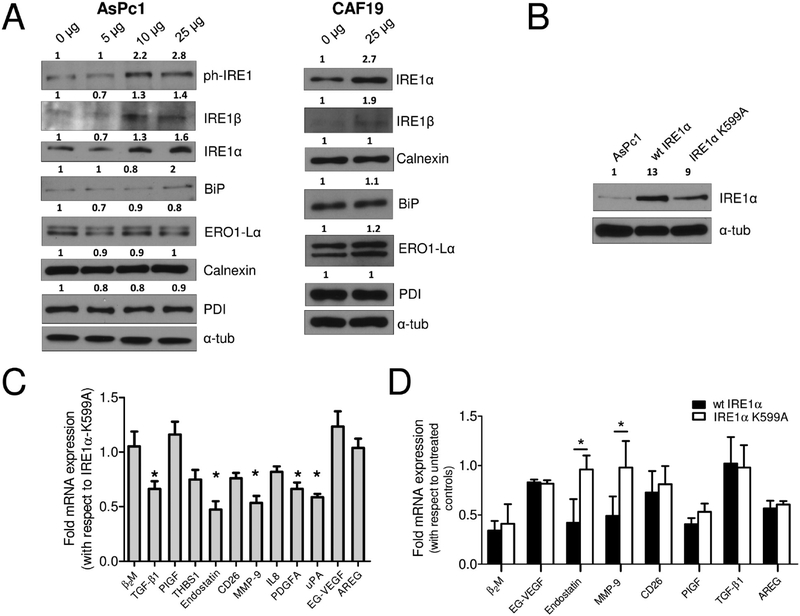
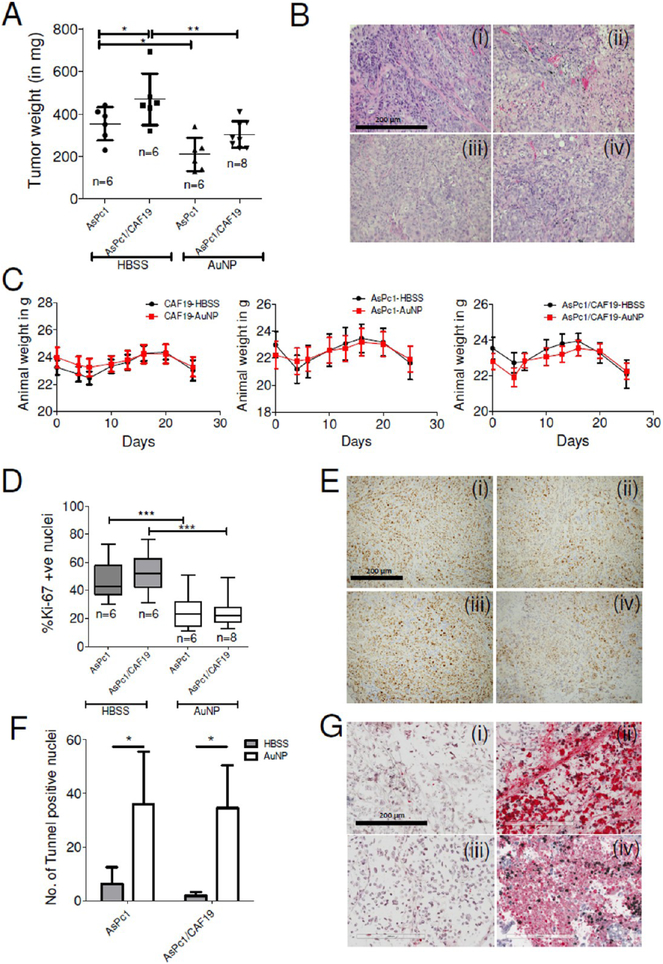
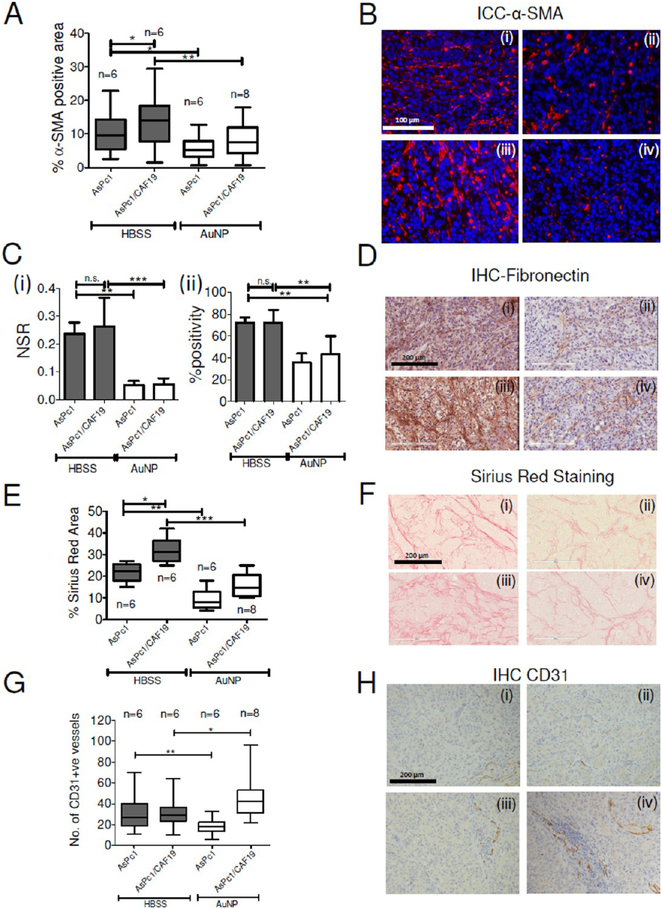
Altered tumor microenvironment (TME) arising from a bidirectional crosstalk between the pancreatic cancer cells (PCCs) and the pancreatic stellate cells (PSCs) is implicated in the dismal prognosis in pancreatic ductal adenocarcinoma (PDAC), yet effective strategies to disrupt the crosstalk is lacking. Here, we demonstrate that gold nanoparticles (AuNPs) inhibit proliferation and migration of both PCCs and PSCs by disrupting the bidirectional communication via alteration of the cell secretome. Analyzing the key proteins identified from a functional network of AuNP-altered secretome in PCCs and PSCs, we demonstrate that AuNPs impair secretions of major hub node proteins in both cell types and transform activated PSCs toward a lipid-rich quiescent phenotype. By reducing activation of PSCs, AuNPs inhibit matrix deposition, enhance angiogenesis, and inhibit tumor growth in an orthotopic co-implantation model in vivo. Auto- and heteroregulations of secretory growth factors/cytokines are disrupted by AuNPs resulting in reprogramming of the TME. By utilizing a kinase dead mutant of IRE1-α, we demonstrate that AuNPs alter the cellular secretome through the ER-stress-regulated IRE1-dependent decay pathway (RIDD) and identify endostatin and matrix metalloproteinase 9 as putative RIDD targets. Thus, AuNPs could potentially be utilized as a tool to effectively interrogate bidirectional communications in the tumor microenvironment, reprogram it, and inhibit tumor growth by its therapeutic function.

Keywords: gold nanoparticles; pancreatic cancer; stellate cells; tumor microenvironment.


Conflict of interest statement

The authors declare no competing financial interest.

Figures

Figure 1.
Figure 1.
Treatment with 20 nm AuNP affects growth of PCCs and PSCs and reprograms pancreatic stellate cells to quiescence. (A) Effect of various doses of 20 nm AuNP on the proliferation of PCCs (AsPc1 and Panc-1) ascertained through 3H-thymidine incorporation assay post 48 h treatment. (B) Effect of various doses of 20 nm AuNP on the proliferation of PSCs (CAF19 and iTAF) ascertained through 3H-thymidine incorporation assay post 48 h treatment. (C) Immunoblotting analysis showing dose-dependent inhibition of MAPK signaling by 20 nm AuNP in PCCs and PSCs after 48 h treatment. (D) Effect of 20 nm AuNP on the expression of various ECM components and activation marker, α-SMA, by immunoblotting in PSCs. (E) qRT-PCR analyses of mRNA levels of ECM components and activation markers, α-SMA and FAP, in PSCs after 48 h 20 nm AuNP (25 μg/mL) treatment. (F) BODIPY493/503 staining for neutral lipids in iTAF cells post 48 h treatment with 20 nm AuNP (25 μg/mL) treatment. Scale bar is 10 μm. (G) Effect of 48 h treatment with 20 nm AuNP on mRNA levels of important lipid metabolism genes in PSCs determined through qRT-PCR. Data represent mean ± s.d. of three individual experiments (n = 3) each time in triplicate, and statistical analyses were performed using two-tailed students t test * p ≤ 0.05, ** p ≤ 0.01; p/t indicates ratio of phosphorylated protein to total protein. All other densitometric analyses are with respect to loading control.
Figure 2.
Figure 2.
20 nm AuNPs disrupts PCC–PSC crosstalk in vitro. (A) Schematic representation of the method for generating CM from PCCs and PSCs. (B) and (C) Effect of 20 nm AuNP treatment on induction of proliferation in Panc-1 and AsPc1 cells by untreated and AuNP-treated (25 μg/mL) PSC CMs for 48 h determined through MTS assay. (D) and (E) Effect of 20 nm AuNP treatment on induction of proliferation in CAF19 and iTAF cells by untreated and AuNP-treated (25 μ/ml) PCC CMs for 48 h determined through MTS assay. (F) Schematic representation of the employed method for study of AuNP effects on induction of directed migration in indirect coculture between PCCs and PSCs. (G) and (H) Effect of various doses (0, 5, 25, and 50 μg/mL) of 20 nm AuNP treatment on PSCs to induce migration of AsPc1 cells. (I) and (J) Effect of various doses (0, 5, 25, and 50 μg/mL) of 20 nm AuNP on PCCs to induce migration of CAF19 cells. All experiments were performed in triplicate, and statistical analysis was done using One-Way ANOVA followed by Newman–Keuls post-test. Data represent mean ± s.d. of three individual experiments (n = 3), and statistical analyses were performed using One-Way Anova *p ≤ 0.05, **p ≤ 0.01, ***p ≤ 0.001.
Figure 3.
Figure 3.
Treatment with AuNPs alters secretory profile of pancreatic cancer and stellate cells. (A) Relative levels of significantly (*p ≤ 0.05) altered angiogenesis-related proteins in AsPc1 and Panc-1 conditioned media upon treatment with 25 μg/mL dose of 20 nm AuNP for 48 h. Folds are with respect to untreated controls. (B) qRT-PCR analysis of altered angiogenesis-related proteins in untreated and 25 μg/mL AuNP-treated AsPc1 cells analyzed 48 h post-treatment. GAPDH was used as an internal control. (C) Relative levels of significantly (p ≤ 0.05) altered angiogenesis-related proteins in iTAF and CAF19 conditioned media upon treatment with 25 μg/mL of 20 nm AuNPs for 48 h. Folds are with respect to untreated controls. (D) qRT-PCR analysis of altered angiogenesis-related proteins in untreated and 25 μg/mL AuNP-treated iTAF and CAF19 cells analyzed 48 h post-treatment. GAPDH was used as an internal control. Data represent mean ± s.d. of three individual experiments (n = 3).
Figure 4.
Figure 4.
AuNP treatment inhibits mounting of fibrogenic response in PSCs by PCCs and signaling in PCCs by PSCs. (A) and (B) Immunoblot analysis of CAF19 and iTAF cells for ECM markers and α-SMA upon treatment with serum-free media, serum-supplemented culture media, untreated/AuNP-treated (25 μg) AsPc1 conditioned media for 24 h. α-Tubulin was used as the loading control. (C) Effect of various growth factors on the ECM components and α-SMA protein levels determined by immunoblotting after 24 h of treatment in CAF19 cells. (D) and (E) Immunoblot analysis of AsPc1 cells (10 μg protein) to study Akt and MAPK signaling upon treatment with serum-free media, complete-10% FBS media, CAF19/iTAF CM, or various doses of AuNP-treated CAF19/iTAF CM for 24 h. GAPDH was used as the loading control; p/t indicates ratio of phosphorylated protein to total protein. All other densitometric analysis are with respect to loading control.
Figure 5.
Figure 5.
AuNPs alter the secretome through growth factor auto and heteroregulation. (A) Functional network of differentially secreted proteins from iTAF cells showing putative interactions generated using GeneMania. Highlighted nodes in black are proteins differentially secreted upon AuNP treatment; edge color indicates different types of interaction type. (B) Heatmap representing the effect of key growth factors/cytokines on the expression of differentially expressed genes in iTAF cells after 24 h of treatment determined by qRT-PCR. The mean values of three independent experiments were plotted in OriginPro 8.1 to generate the heatmap. (C) Functional network of differentially secreted proteins from AsPc1 cells showing putative interactions and results from network analysis visualized using Cytoscape. Node size corresponds to the degree of a node; node color corresponds to the radiality score (green-to-yellow-to-red). Edge color represents the evidence of interaction between the nodes (cyan: coexpression; blue: colocalization; pink: pathways; brown: physical protein–protein interactions; green: shared-protein domains; gray: text-mining) (D) Heatmap representing the effect of key growth factors/cytokines on the expression of differentially expressed genes in AsPc1 cells after 24 h of treatment determined by qRT-PCR. The mean values of three independent experiments were plotted in OriginPro 8.1 to generate the heatmap.
Figure 6.
Figure 6.
AuNP-induced ER-stress activates RIDD to alter the secretome. (A) Immunoblot analysis of AsPc1 cells (10 μg protein) 48 h post-treatment with various doses of AuNPs for markers of ER-Stress. (B) Immunoblot analysis to confirm overexpression of wt-IRE1α and IRE1α-K599A. α-Tubulin is used as the loading control. (C) qRT-PCR analysis of altered growth factors/cytokines in wt-IRE1α-expressing AsPc1 cells compared to RIDD-inactive IRE1α-K599A. (D) qRT-PCR analysis of altered mRNAs in stable wt-IRE1α and mutant IRE1α-K599A expressing AsPc1 cells upon treatment with 20 nm AuNP (25 μg/mL) for 48 h. Experiments were performed in triplicate, and two-tailed student t test was performed to determine statistical significance. *p ≤ 0.05, **p ≤ 0.01. Densitometric analysis are with respect to loading control.
Figure 7.
Figure 7.
Inhibition of tumor growth in orthotopic models of pancreatic cancer by AuNP. (A) Scattered plot of tumor weight in HBSS-treated (sham) or 100 μg/daily i.p. Twenty nm AuNP-treated animals post 21 days of treatment. Statistical analysis was performed using One-way ANOVA followed by Newman–Keuls multiple comparison test. (B) Representative H&E stained sections of (i) AsPc1-HBSS, (ii) AsPc1-AuNP, (iii) AsPc1/CAF19-HBSS, and (iv) AsPc1/CAF19-AuNP groups. Statistical analysis was performed using One-way ANOVA followed by Newman–Keuls multiple comparison test. (C) Animal body weight changes over time in CAF19 only, AsPc1 only, and AsPc1+CAF19 cells injected animals receiving HBSS or AuNP daily demonstrating apparent nontoxic behavior of AuNPs. (D) Whiskers min-to-max plot of Ki-67 stained nuclei in HBSS or AuNP-treated AsPc1 or AsPc1/CAF19 tumors. (E) Representative Ki-67 stained sections of tumors from (i) AsPc1-HBSS, (ii) AsPc1-AuNP, (iii) AsPc1/CAF19-HBSS, and (iv) AsPc1/CAF19-AuNP groups. Images were acquired using 4× objective and quantified using ImageJ (NIH). (F) Histograms representing number of tunnel stained nuclei in HBSS or AuNP-treated AsPc1 only or AsPc1/CAF19 tumors. (G) Representative tunnel stained sections of tumors from (i) AsPc1-HBSS, (ii) AsPc1-AuNP, (iii) AsPc1/CAF19-HBSS, and (iv) AsPc1/CAF19-AuNP groups. Images were acquired using 4× objective and quantified using ImageJ (NIH). Statistical analysis was performed using One-way ANOVA followed by Newman–Keuls multiple comparison test. *p ≤ 0.05, **p ≤ 0.01, ***p ≤ 0.001.
Figure 8.
Figure 8.
Inhibition of desmoplasia in orthotopic models of pancreatic cancer by AuNP. (A) Whiskers min-to-max plot of α-SMA positive area in HBSS or AuNP-treated AsPc1 or AsPc1/CAF19 tumors and their (B) representative α-SMA stained sections of (i) AsPc1-HBSS, (ii) AsPc1-AuNP, (iii) AsPc1/CAF19-HBSS, and (iv) AsPc1/CAF19-AuNP groups. Statistical analysis was performed using One-way ANOVA followed by Newman–Keuls multiple comparison test. (C) (i) NSR (ratio of strongly stained pixels to positive pixels) of fibronectin levels in HBSS and AuNP-treated AsPc1 only or AsPc1/CAF19 tumors. (ii) Percentage of positively stained pixels with fibronectin in HBSS and AuNP-treated AsPc1 only or AsPc1/CAF19 tumors. (D) Representative fibronectin stained sections of (i) AsPc1-HBSS, (ii) AsPc1-AuNP, (iii) AsPc1/CAF19-HBSS, and (iv) AsPc1/CAF19-AuNP groups. (E) Whiskers min-to-max plot showing percentage Sirius Red stained area in in HBSS or AuNP-treated AsPc1 or AsPc1+CAF19 tumors for determination of collagen levels. (F) Representative Sirius Red stained sections from (i) AsPc1-HBSS, (ii) AsPc1-AuNP, (iii) AsPc1+CAF19-HBSS, and (iv) AsPc1+CAF19-AuNP groups. (G) Whiskers min-to-max plot showing number of CD31-positive vessels per 4× field of view in HBSS or AuNP-treated AsPc1 or AsPc1+CAF19 tumors. (H) Representative CD31 stained sections of tumors from (i) AsPc1-HBSS, (ii) AsPc1-AuNP, (iii) AsPc1/CAF19-HBSS, and (iv) AsPc1/CAF19-AuNP groups.

References

    1. Erkan M; Hausmann S; Michalski CW; Schlitter M; Fingerle AA; Dobritz M; Friess H; Kleeff J How Fibrosis Influences Imaging and Surgical Decisions in Pancreatic Cancer. Front. Physiol 2012, 3, 389. - PMC - PubMed
    1. Erkan M; Hausmann S; Michalski CW; Fingerle AA; Dobritz M; Kleeff J; Friess H The Role of Stroma in Pancreatic Cancer: Diagnostic and Therapeutic Implications. Nat. Rev. Gastroenterol. Hepatol 2012, 9, 454–467. - PubMed
    1. Mahadevan D; Von Hoff DD Tumor-Stroma Interactions in Pancreatic Ductal Adenocarcinoma. Mol. Cancer Ther 2007, 6, 1186–1197. - PubMed
    1. Apte MV; Wilson JS Dangerous Liaisons: Pancreatic Stellate Cells and Pancreatic Cancer Cells. J. Gastroenterol. Hepatol 2012, 27, 69–74. - PubMed
    1. Omary MB; Lugea A; Lowe AW; Pandol SJ The Pancreatic Stellate Cell: A Star on the Rise in Pancreatic Diseases. J. Clin. Invest 2007, 117, 50–59. - PMC - PubMed

Publication types