Multicenter Study
. 2017 Feb;102(2):308-319.
doi: 10.3324/haematol.2016.147835. Epub 2016 Oct 6.

Immunophenotypic analysis of erythroid dysplasia in myelodysplastic syndromes. A report from the IMDSFlow working group

Affiliations
Multicenter Study

Immunophenotypic analysis of erythroid dysplasia in myelodysplastic syndromes. A report from the IMDSFlow working group

Theresia M Westers et al. Haematologica. 2017 Feb.

Abstract

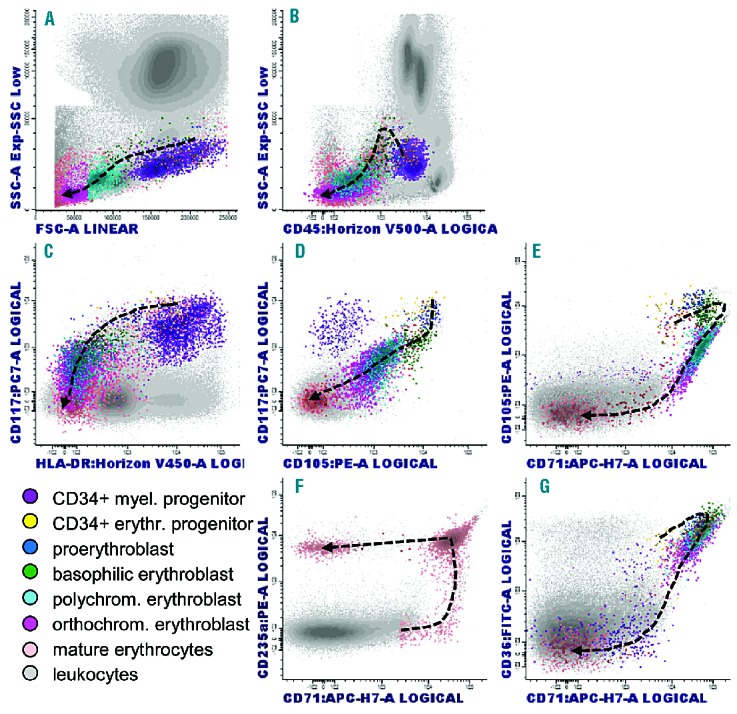
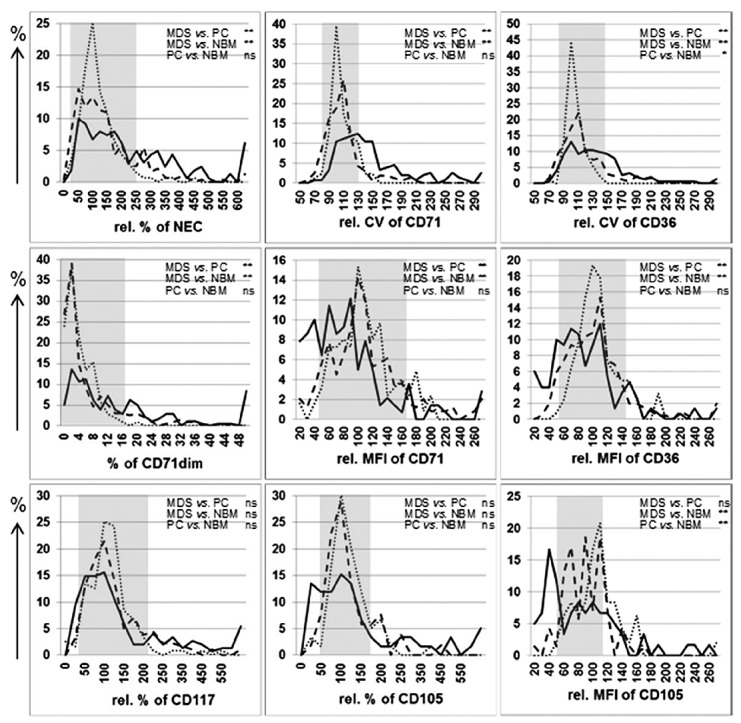
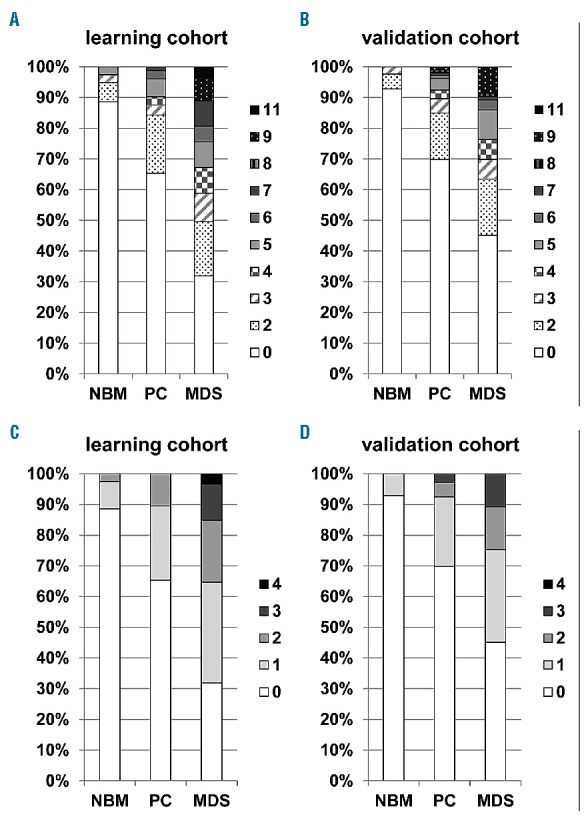
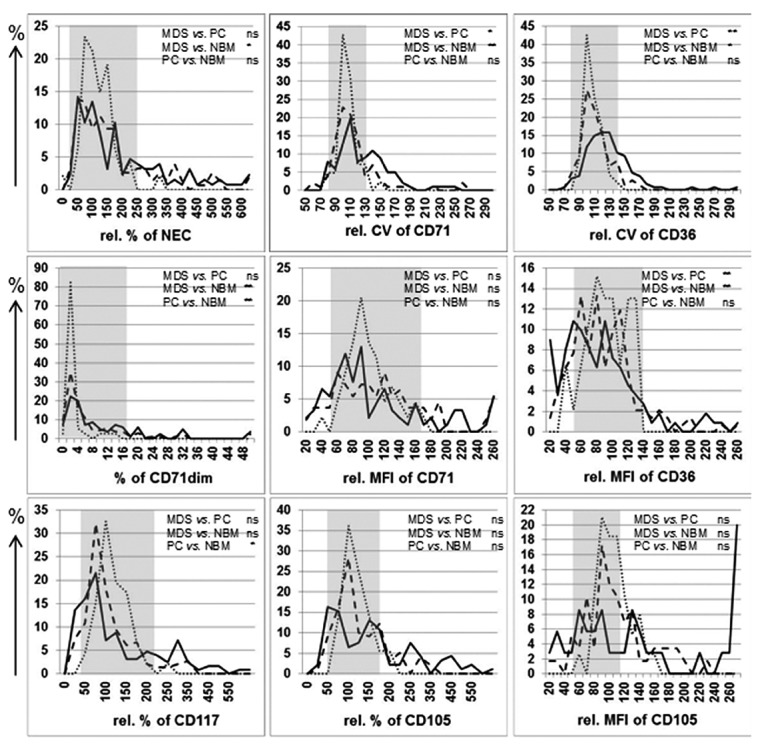
Current recommendations for diagnosing myelodysplastic syndromes endorse flow cytometry as an informative tool. Most flow cytometry protocols focus on the analysis of progenitor cells and the evaluation of the maturing myelomonocytic lineage. However, one of the most frequently observed features of myelodysplastic syndromes is anemia, which may be associated with dyserythropoiesis. Therefore, analysis of changes in flow cytometry features of nucleated erythroid cells may complement current flow cytometry tools. The multicenter study within the IMDSFlow Working Group, reported herein, focused on defining flow cytometry parameters that enable discrimination of dyserythropoiesis associated with myelodysplastic syndromes from non-clonal cytopenias. Data from a learning cohort were compared between myelodysplasia and controls, and results were validated in a separate cohort. The learning cohort comprised 245 myelodysplasia cases, 290 pathological, and 142 normal controls; the validation cohort comprised 129 myelodysplasia cases, 153 pathological, and 49 normal controls. Multivariate logistic regression analysis performed in the learning cohort revealed that analysis of expression of CD36 and CD71 (expressed as coefficient of variation), in combination with CD71 fluorescence intensity and the percentage of CD117+ erythroid progenitors provided the best discrimination between myelodysplastic syndromes and non-clonal cytopenias (specificity 90%; 95% confidence interval: 84-94%). The high specificity of this marker set was confirmed in the validation cohort (92%; 95% confidence interval: 86-97%). This erythroid flow cytometry marker combination may improve the evaluation of cytopenic cases with suspected myelodysplasia, particularly when combined with flow cytometry assessment of the myelomonocytic lineage.


Figures

Figure 1.
Figure 1.
Flow cytometric profiles of normal erythroid differentiation. Early erythroid precursors are defined as CD45dim/SSCint/CD34+/CD117+/CD105+/CD235a−, proerythroblasts as CD45dim//SSCint/CD34/CD117+/CD105+/CD36+/CD71+/CD235a+, basophilic erythroblasts as CD45dim/−/SSCint/CD117/CD105+/CD36++/CD71+/CD235a+, polychromatic erythroblasts as CD45/SSClow/FSCint/CD105/CD36+/CD71+/CD235a+ and orthochromatic erythroblasts CD45/SSClow/FSClow/CD36+/−/CD71+/CD235a+. Indicated colors reflecting erythroid subsets are not visible in the CD71 vs. CD235a plot (Fig 1F). Herein, pink colored cells represent the total erythroid lineage in this plot. Mature erythrocytes (CD45/CD36/CD71/CD235a++) can be seen in improperly lysed cell preparations (Figure 1F). Reticulocytes are not covered in these graphs, but they may appear as CD71dim-to-negative in non-lysed cell preparations. Myeloid progenitors are CD34+/CD117+/HLA-DR+/CD105 (Figure 1C and D.); these cells have slightly higher CD45 expression than erythroid precursors; moreover, in contrast to myeloid progenitors erythroid cells do not express HLA-DR (adapted from references).
Figure 2.
Figure 2.
Distribution of erythroid markers analyzed by flow cytometry among MDS patients and controls within the learning cohort. Results of the analysis of indicated markers of the erythroid lineage are plotted along the X-axes: relative (rel.) percentages of nucleated erythroid cells (NEC); rel. mean fluorescence intensity (MFI) for CD36, CD71, and CD105; rel. coefficient of variation (CV) of CD36 and CD71; and rel. percentages of CD117+ and CD105+ erythroid progenitors. Relative frequencies (as percentage of the MDS or control cohort for a particular marker) are depicted along the Y-axes. Dotted lines represent results for normal bone marrow (NBM) samples, dashed lines pathological controls (PC) and solid lines MDS cases. P-values of comparison between groups are depicted: **: <0.001, *: <0.05, ns: not significant (Kruskal Wallis test). Grey boxes indicate reference ranges for the analyzed markers as defined by 10th and 90th percentiles of pathological controls. Scatterplots of results for the markers (depicted here as frequency histograms) that were selected as FC-markers for erythroid dysplasia from the multivariate analysis are depicted in Online Supplementary Figure S3.
Figure 3.
Figure 3.
FC-erythroid dysplasia score in learning and validation cohorts. The weighted score consists of four parameters: increase in CD36 CV (4 points) and CD71 CV (3 points); decrease in CD71 MFI (2 points); and decrease or increase of CD117+ erythroid progenitors (2 points). A maximum score of 11 points can be reached. Data are grouped as normal bone marrow (NBM), pathological controls (PC) and MDS, relative distribution of the results for the score is displayed along the Y-axes. Panel A. represents the learning cohort consisting of 79 normal bone marrow samples (NBM), 153 pathological controls (PC) and 119 MDS cases. The FC-erythroid dysplasia score could only be calculated in the cases with data on all four defined parameters (351/670 cases). Panel B. represents the results in the validation cohort consisting of 42 NBM samples, 106 pathological controls and 93 MDS cases (241/320 cases). Clonal disorders as aplastic anemia and those within the category of essential thrombocythemia, polycythemia vera and primary myelofibrosis were excluded from both cohorts (two and nine cases for learning and validation cohorts, respectively). A cut-off of ≥5 points resulted in a specificity of 90% (95% CI: 84–94%) and a sensitivity of 33% (95% CI: 24–42) in the learning cohort; in the validation cohort, specificity was 92% (95% CI: 86–97%) and sensitivity 24% (95% CI: 15–34%). The numerical score, depicted in panels C and D, consists of four parameters: increase in CD36 CV and CD71 CV; decrease in CD71 MFI; and decrease or increase of CD117+ erythroid progenitors. A maximum score of 4 points can be reached. A cut-off of ≥2 points resulted in a specificity of 90% (95% CI: 84–94%) and a sensitivity of 35% (95% CI: 27–45) in the learning cohort; in the validation cohort, specificity and sensitivity were 92% (95% CI: 86–97%) and 25% (95% CI: 16–35%), respectively.
Figure 4.
Figure 4.
Distribution of erythroid markers analyzed by FC within subgroups of MDS patients and controls within the validation cohort. Results of the analysis of selected markers of the erythroid lineage in the validation cohort are plotted along the X-axes: relative coefficient of variation (CV) of CD36 and CD71, and relative percentages of CD117+ erythroid progenitors. Normalization was performed against results for the normal bone marrow (NBM) samples of the validation cohort per each individual center. Relative frequencies are depicted along the Y-axes. Dotted lines represent results for NBM samples, dashed lines pathological controls (PC), and solid lines MDS cases. Grey boxes indicate 10th and/or 90th percentiles of pathological controls defined in the learning cohort that were applied for evaluating aberrancies.

Similar articles

Cited by

References

    1. Brunning R, Orazi A, Germing U, et al. Myelodysplastic syndromes/neoplasms. In: Swerdlow, et al., ed. WHO classification of Tumours and Haematopoietic and Lymphoid Tissues. Lyon: IARC; 2008
    1. Malcovati L, Hellstrom-Lindberg E, Bowen D, et al. Diagnosis and treatment of primary myelodysplastic syndromes in adults: recommendations from the European LeukemiaNet. Blood. 2013;122(17):2943–2964. - PMC - PubMed
    1. van de Loosdrecht AA, Alhan C, Bene MC, et al. Standardization of flow cytometry in myelodysplastic syndromes: report from the first European LeukemiaNet working conference on flow cytometry in myelodysplastic syndromes. Haematologica. 2009;94(8):1124–1134. - PMC - PubMed
    1. Westers TM, Ireland R, Kern W, et al. Standardization of flow cytometry in myelodysplastic syndromes: a report from an international consortium and the European LeukemiaNet Working Group. Leukemia. 2012;26(7):1730–1741. - PubMed
    1. Wells DA, Benesch M, Loken MR, et al. Myeloid and monocytic dyspoiesis as determined by flow cytometric scoring in myelodysplastic syndrome correlates with the IPSS and with outcome after hematopoietic stem cell transplantation. Blood. 2003;102(1):394–403. - PubMed

Publication types