

doi: 10.3324/haematol.2016.154013.
Epub 2016 Oct 6.
CK2 inhibitor CX-4945 destabilizes NOTCH1 and synergizes with JQ1 against human T-acute lymphoblastic leukemic cells
Affiliations
- PMID: 27758824
- PMCID: PMC5210253
- DOI: 10.3324/haematol.2016.154013
Item in Clipboard
CK2 inhibitor CX-4945 destabilizes NOTCH1 and synergizes with JQ1 against human T-acute lymphoblastic leukemic cells
Haematologica.
2017 Jan.
No abstract available
Figures
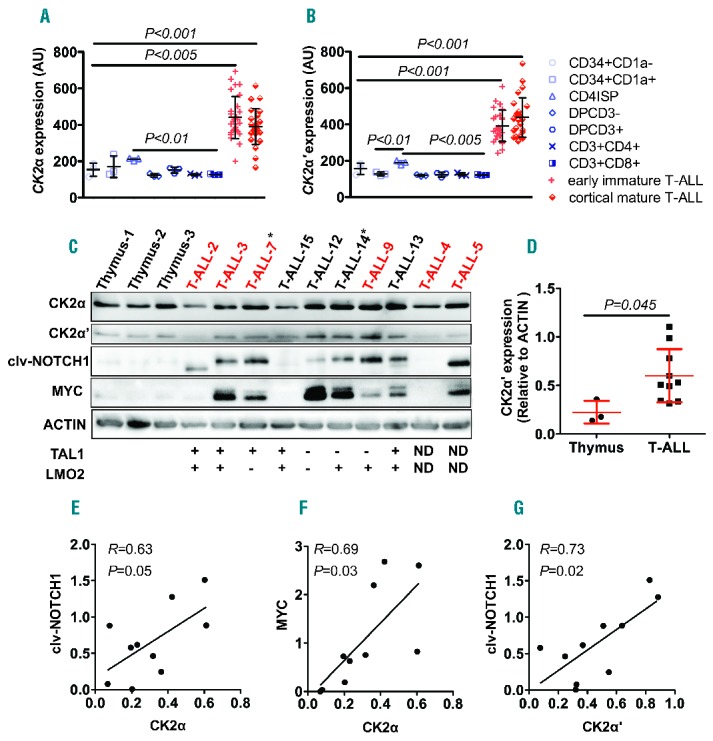
CK2 expression is elevated in human patient T-cell acute lymphoblastic leukemia (T-ALL) cells, and correlates with those of NOTCH1 and MYC. (A and B). Both CK2α (probe ID: ILMN_2386355) (A) and CK2α′ (probe ID: ILMN_1723843) (B) transcripts are elevated in early immature and mature T-ALL patient samples, compared with different subsets of T cells. Mean±SD of CK2α: 440.6±21.9 for early immature T-ALL and 391.1±19.6 for cortical/mature T-ALL versus 154±21.1 for CD34+CD1a−, 170.1±34.35 for CD34+CD1a+, 211.1±4.55 for CD4ISP, 122.3±5.49 for DPCD3−, 151.5±9.28 for DPCD3+, 126.3±3.19 for CD3+CD4+, 127.1±2 for CD3+CD8+; P<0.005 and P<0.001; and CK2α′: 392.2±16.3 for early immature T-ALL and 438.1±21.74 for cortical/mature T-ALL versus 156.8±17.89 for CD34+CD1a−, 128.1±5.5 for CD34+CD1a+, 190±6.81 for CD4ISP, 119.4±2.61 for DPCD3−, 124.1±7.54 for DPCD3+, 124.6±5.18 for CD3+CD4+, 122.4±1.94 for CD3+CD8+. P<0.001 for all comparisons; n=28 for early immature T-ALL, 25 for cortical/mature T-ALL and 3 for subsets of T cells, respectively. Among the different T-cell subsets, the expression of CK2α (A) and CK2α′ (B) is slightly but significantly higher in CD4ISP cells, compared to double-positive or single-positive subsets of T cells (P<0.01 and P<0.005, respectively). (C) Western blotting analysis of CK2α, CK2α′, cleaved-NOTCH1 (clv-NOTCH1) and MYC in patient T-ALL samples, compared with normal thymus. ACTIN serves as a loading control. Patient sample number marked in red indicates NOTCH1 mutations and asterisk (*) denotes FBW7 mutations. (D) CK2α′ versus ACTIN protein ratios demonstrating that CK2α′ levels are significantly higher in primary T-ALL patient samples, compared with those in control thymocytes (mean±SD of CK2α′ to ACTIN ratio: 0.60±0.09 versus 0.22± 0.07; P=0.045; n=10 and 3, respectively). (E–G) Pearson correlation tests reveal that CK2α (E and F) and CK2α′ (G) protein levels significantly correlate with those of NOTCH1 and MYC, or NOTCH1 alone (n=10; P=0.05, 0.03 and 0.02, respectively). AU: arbitrary unit. All human samples were collected and analyzed after informed consent and with approval of the Institutional Review Board and the Ethics Committee without linked identifiers.
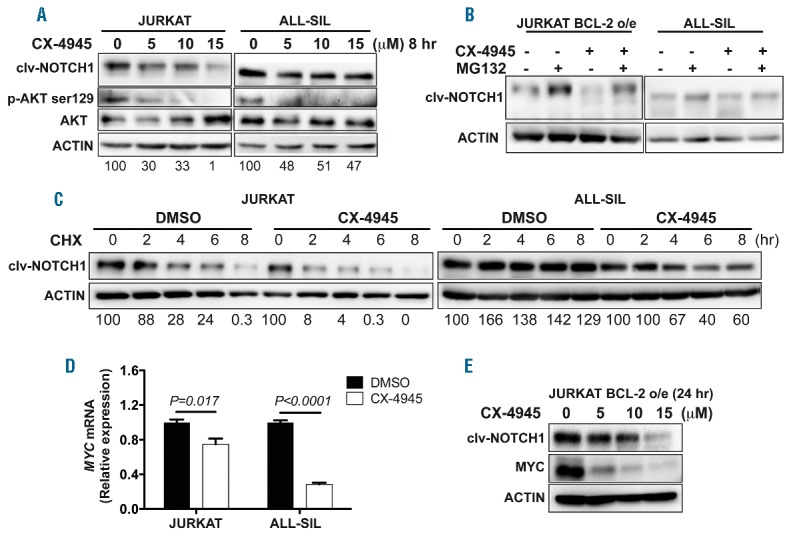
CK2 inhibition by CX-4945 decreases NOTCH1 and MYC levels in human T-cell acute lymphoblastic leukemia (T-ALL) cells by destabilizing NOTCH1. (A) CX-4945 treatment in both human JURKAT and ALL-SIL T-ALL cells for 8 hours leads to decreased expression of cleaved-NOTCH1 (clv-NOTCH1) and phospho-AKT at Serine 129 site (P-AKT ser129). (B) Blocking proteasome-mediated degradation by MG132 for 8 hours rescues the decreased levels of clv-NOTCH1 in JURKAT and ALL-SIL T-ALL cells upon CX-4945 treatment. (C) Pulse-chase analysis of the half-life for clv-NOTCH1 reveals a less stable NOTCH1 upon CX-4945 (5 μM) treatment, compared with those treated with DMSO (3.96±0.45 hours vs. 1.59±1.54 hours in JURKAT cells and more than 8 hours vs. 5.75±1.77 hours in ALL-SIL cells; n=3 per group). CHX: cycloheximide. Data from one out of three biological repeats are shown. (D) qRT-PCR analysis revealing significantly decreased transcript levels of MYC in both JURKAT (P=0.017) and ALL-SIL (P<0.0001) T-ALL cells treated with CX-4945, compared with those in DMSO-treated cells. Data from one out of two biological repeats are shown. (E) CX-4945 treatment for 24 hours leads to decreased protein levels of both clv-NOTCH1 and MYC in JURKAT-BCL-2 over-expressing (o/e) T-ALL cells that are resistant to apoptosis. Clv-NOTCH1 protein amounts (relative to ACTIN) are shown in the bottom of panels (A) and (C). hr: hours.

JQ1 synergizes with CX-4945 in killing T-cell acute lymphoblastic leukemia (T-ALL) cells. (A) Combination treatment of CX-4945 and JQ1 depicted as normalized isobolograms shows strong synergism between the two drugs in JURKAT and ALL-SIL cell lines [combination index (CI)=0.31 and 0.16, respectively] but weaker synergism in RPMI-8402 and MOLT-3 cell lines (CI=0.49 and 0.75, respectively). CalcuSyn software was used to analyze combination data to produce the isobolograms normalized to the IC50 of each drug. The black diagonal line connects x- and y-axes of the normalized isobologram. Red dots on the black line represent additive dose combinations. Red dots below the black line represent synergistic drug combinations. Red dots above the black line represent antagonism. The T-ALL cell lines were treated with the following combination doses of CX-4945 and JQ1 for 72 hours, respectively: CX-4945 from 1.0 to 10 μM and JQ1 from 0.1 to 10 μM. (B) Cell viability upon combination treatment with CX-4945 2.5 μM and JQ1 1 μM is significantly reduced in all cell lines (except in MOLT-3 for JQ1 treatment vs. combination treatment), compared with those by single-agent treatment. Cell viability was determined with CellTiter-Blue after 72 hours of treatment for all four T-ALL cell lines treated with DMSO, CX-4945 (2.5 μM), JQ1 (1 μM) and both drugs in combination (CX-4945: 2.5 μM; JQ1: 1 μM). (C) Apoptosis analysis was performed on JURKAT, ALL-SIL, RPMI-8402 and MOLT-3 cells stained with Annexin V and PI after 48 hours of treatment with DMSO, CX-4945 (2.5 μM), JQ1 (1 μM) and both drugs in combination (CX-4945: 2.5 μM; JQ1: 1 μM). Cells were examined by flow cytometry to determine early apoptosis (PI-, Annexin V+) and late apoptosis (PI+, Annexin V+). Values in (B and C) are means±standard deviation (SD), and represent three biological replicates. Statistical significance was determined by two-tailed t-test.
References
Publication types
MeSH terms
Substances
Grants and funding
LinkOut - more resources
Full Text Sources
Other Literature Sources
