. 2016 Nov;172(3):2057-2078.
doi: 10.1104/pp.16.01318. Epub 2016 Oct 6.

Central Metabolic Responses to Ozone and Herbivory Affect Photosynthesis and Stomatal Closure

Affiliations

Central Metabolic Responses to Ozone and Herbivory Affect Photosynthesis and Stomatal Closure

Stefano Papazian et al. Plant Physiol. 2016 Nov.

Abstract

Plants have evolved adaptive mechanisms that allow them to tolerate a continuous range of abiotic and biotic stressors. Tropospheric ozone (O3), a global anthropogenic pollutant, directly affects living organisms and ecosystems, including plant-herbivore interactions. In this study, we investigate the stress responses of Brassica nigra (wild black mustard) exposed consecutively to O3 and the specialist herbivore Pieris brassicae Transcriptomics and metabolomics data were evaluated using multivariate, correlation, and network analyses for the O3 and herbivory responses. O3 stress symptoms resembled those of senescence and phosphate starvation, while a sequential shift from O3 to herbivory induced characteristic plant defense responses, including a decrease in central metabolism, induction of the jasmonic acid/ethylene pathways, and emission of volatiles. Omics network and pathway analyses predicted a link between glycerol and central energy metabolism that influences the osmotic stress response and stomatal closure. Further physiological measurements confirmed that while O3 stress inhibited photosynthesis and carbon assimilation, sequential herbivory counteracted the initial responses induced by O3, resulting in a phenotype similar to that observed after herbivory alone. This study clarifies the consequences of multiple stress interactions on a plant metabolic system and also illustrates how omics data can be integrated to generate new hypotheses in ecology and plant physiology.


Figures

Figure 1.
Figure 1.
Design of omics experiments, hypothesis generation, and validation via physiological evidence. For experiment 1, 5-week-old B. nigra plants were exposed to abiotic and/or biotic stresses: O3 fumigation at 70 nL L−1 for 5 d (O), herbivore feeding with 30 first instar P. brassicae caterpillars for 24 h (P), sequential stress of O3 followed by herbivore feeding (OP), or no treatment as controls (C). To obtain a comprehensive understanding of metabolome and transcriptome responses to the treatments, leaves of equal developmental stage were sampled from the same plants from which volatile emissions (VOCs) had been obtained. Statistical and network analyses combined omics data in a model that connected the metabolic responses with physiological adaptation to the multiple stress condition. B. nigra responses were further evaluated in experiment 2, where physiological parameters were measured for the same stress treatments (O, P, and OP) and for a long-term exposure to O3 at 70 nL L−1 for 16 d (OL). The initial hypothesis was thus verified through validation of the omics model, which predicted differential physiological responses of photosynthesis, carbon assimilation, and stomatal regulation.
Figure 2.
Figure 2.
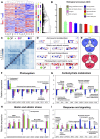
Transcriptome responses in B. nigra under multiple O3 and herbivory stress treatments: O3 stress (O), herbivory by P. brassicae (P), and both stresses sequentially (OP). A, Heat map showing statistically significant (P ≤ 0.05) changes in the expression of 970 genes in different samples from the O, P, and OP treatments, relative to control plants. Red and blue indicate up- and down-regulation, respectively. The subfigure at right shows the GO enrichment of specific biological processes in each cluster visible in the heat map, ranked (I–III) according to the relative abundance of genes associated with the biological process in question within the cluster. The color scheme used here matches that used in B. B, All of the GO processes that were significantly enriched in all the gene clusters, ordered by their relative abundance (for all 970 genes). C, Heat map of ρ as calculated for each sample pair from the corresponding hierarchical clustering; darker shades of blue indicate stronger correlations. D, MapMan biological functions (bins) showing the effect of the stress treatments on gene expression relative to amino acid metabolism, biotic and abiotic stress, cell wall biosynthesis, photosynthesis, and the Calvin cycle. E, Venn diagrams (MapMan generated) comparing genes up- and down-regulated in response to the treatments for log2 fold-change thresholds greater than 0.585 (corresponding to P ≤ 0.05). F to I, Univariate analysis relevant to the regulation of central metabolism and stress responses: processes of photosynthesis and light harvesting (F), carbohydrate metabolism (G), biotic and abiotic stress (H), and response and signaling (I). Relative transcript accumulation is reported as log2 values. Significance relative to the controls (zero level) is reported as Student’s t test values as follows: *, P ≤ 0.05; **, P ≤ 0.01; ***, P ≤ 0.001; and ****, P ≤ 0.0001. Error bars indicate se. Treatments are indicated by color: O3 (O) in white, herbivory by P. brassicae (P) in gray, and sequential treatment (OP) in black.
Figure 3.
Figure 3.
Metabolome responses in B. nigra under multiple O3 and herbivory stress treatments: O3 stress (O), herbivory by P. brassicae (P), sequential treatment (OP), and untreated plants (C). Leaf-bound metabolites were analyzed by LC-MS and GC-MS, while VOCs were collected via headspace and analyzed by GC-MS. Five latent variables (LVs) cumulatively explained 65% of the total variation in X (R2X[c]) and 95% of the treatment response (R2Y[c]), with 44% total model predictability (Q2[c]). Model statistics and metabolite identities are presented in Supplemental Tables S1 and S2. A, PLS-DA score plot of first and second LVs, LV[1] versus LV[2]. For score plots relative to LV[3], see Supplemental Figure S1. B, PLS-DA loading plot showing important metabolites for the model (VIP score > 1). α-KG, α-Ketoglutarate; TCA, trichloroacetic acid. C, ANOVAs with posthoc Tukey’s comparisons to test treatment effects for selected compounds (different letters indicate different response means). n.d., Not detected. Error bars indicate se.
Figure 4.
Figure 4.
Omics integrative network correlation analysis for multiple stress responses in B. nigra. Gene expression profiles for 970 genes (P < 0.05) were correlated with the metabolome profile (156 compounds) for all the experimental treatments involving O3 stress and P. brassicae herbivory. The resulting graph was rendered as a network using Cytoscape. Edges connect nodes linked by ρ values of 0.85 or greater; positive and negative correlations are represented by blue and red lines, respectively. Nodes correspond to genes (white squares/diamonds) and metabolites (colored circles). The herbivore variable for the effect of P. brassicae treatment is indicated by the boldface letter P inside a white square. A, Network of gene-to-gene, gene-to-metabolite, and metabolite-to-metabolite correlations. B, Expansion of the gene-to-metabolite subnet highlighting the effect of P on glycerol and coexpressed genes (MYB44, the flavin monoxygenases NOGC1 and FMO, an LRR-RK receptor, and a SecY protein). C, VOCs subnet, connecting central metabolism to secondary metabolism (glucosinolates, hydroxycinnamic acid derivatives, and flavonol glucosides) via WRK40, WRK46, and CYP707A3.
Figure 5.
Figure 5.
Regulation of energy metabolic networks in B. nigra under multiple O3 and herbivory stress treatments. A, Network model (AraNet) assessing gene connectivity between the 85 genes enriched in energy metabolic processes. Model fitness was calculated based on the gene interconnectivity of the receiver operating characteristic (ROC) for the true-positive and false-positive rates between the entry genes (red curve) and a randomly generated gene set (green curve). The network achieved a high area under the curve score (0.89; P = 1.82 E-62). B and C, Multivariate analysis evaluating the change in expression of energy genes in the network during the multiple stress treatments: O3 (O), herbivory by P. brassicae (P), and sequential treatment (OP). PLS-DA scores and loading plots of first and second latent variables, LV[1] versus LV[2], are shown. Five LVs cumulatively explained 54% of the variation in X (R2X[c]) and 99% of the treatment response (R2Y[c]), with 67% total model predictability (Q2[c]). The importance of mitochondrial genes SDH1-1 and MSD1 in the model is highlighted in red (VIP score = 1.40 and 1.34; Supplemental Tables S4 and S5). D and E, Multivariate analysis for the general model (970 genes; P ≤ 0.05). PLS-DA scores and loading plots of first and second latent variables, LV[1] versus LV[2], are shown (Supplemental Tables S6 and S7). SDH1-1 (VIP score = 1.57) and ALDH7B4 (VIP score = 1.45), in red, are important for O3 treatments (O and OP). F, Distribution of VIP values for all 970 genes and correlation between the expression of SDH1-1 and ALDH7B4 throughout all treatment conditions (ρ = 0.65, P = 0.005).
Figure 6.
Figure 6.
Regulation of glycerol metabolic networks in B. nigra under multiple O3 and herbivory stress treatments. A, Network model (AraNet) assessing gene connectivity between the 78 genes enriched in glycerol metabolic processes. The network interconnectivity scored high model fitness (area under the curve score = 0.99; P = 9.3 E-57) for true-positive and false-positive rates between the entry genes (red curve) and a randomly generated gene set (green curve). B, Multivariate analysis (PLS-DA) evaluating the change in expression of glycerol genes in the network during the multiple stress treatments: O3 (O), herbivory by P. brassicae (P), and sequential treatment (OP). Five latent variables (LVs) cumulatively explained 74% variation in X (R2X[c]) and 100% of the treatment response (R2Y[c]), with 78% total model predictability (Q2[c]; Supplemental Tables S8 and S9). C, OPLS-DA modeling differences for glycerol genes between O and OP (Supplemental Table S10). D, OPLS-DA loading plot related to C (VIP score > 1), colored in blue and green, respectively for their abundance in O and OP. E, Univariate analysis of genes selected from the OPLS-DA model. Asterisks indicate two-tailed Student’s t test significance of P < 0.05 between O and OP. Error bars indicate se. F, Pathway analysis in KaPPA-View4 for glycerol metabolism highlighting the two G3P dehydrogenases GDPDHc1 (cytosolic) and SDP6 (mitochondrial) of the mitochondrial G3P shuttle. The color code indicates up-regulation (red) and down-regulation (green; log expression).
Figure 7.
Figure 7.
Components of the glycerol metabolic network and mitochondrial ETC under multiple O3 and herbivory stress treatments. Comparative correlation analysis and predictive GO network interactions (AraNet and GeneMANIA) are shown. A, Comparative correlation analysis between glycerol, components of the G3P shuttle (GPDHC1 and SDP6), mitochondrial ETC complex II (SDH1-1), and flavin monoxygenases (NOGC1 and FMO). Treatments are O, P, and OP. Edges indicate ρ for positive (blue) and negative (red) correlations. All correlation values reported were significant (between P < 0.05 and P < 0.001), except the two correlations in the sequential (OP) treatment of glycerol/FMO (ρ = 0.85) and SDP6/SDH1 (ρ = 0.48), which were not significant. B, Average relative gene expression (log2) and glycerol abundance for each treatment (O, P, and OP) and corresponding Student’s t test significance (*, P < 0.05 and **, P < 0.01) compared with the control conditions. C, Gene interactions predicted in AraNet for the glycerol metabolic network. Entry genes (in black squares) and emerging new members of a pathway are colored by GO categories after enrichment analysis (GOlorize/Cytoscape). Predicted interactions with members of the mitochondrial ETC complex II, SDH, are highlighted in the box. D, Gene interactions generated in GeneMANIA between query genes SDH1-1, SDP6, GPDHc1, NOGC1, and FMO. Node functions related the genes to processes of energy and mitchonodria metabolism. Functional links indicated coexpression (purple), colocalization (blue), predicted interaction (orange), and shared protein domains (brown) between the network components.
Figure 8.
Figure 8.
Physiological responses in B. nigra under multiple O3 and herbivory stress treatments. A, Leaf phenotypes of 5-week-old B. nigra exposed to O3 fumigation at 70 nL L−1 for 5 d (O), herbivore feeding with 30 first instar P. brassicae caterpillars for 24 h (P), sequential stress of O3 followed by herbivore feeding (OP), long-term exposure to O3 at 70 nL L−1 for 16 d (OL), or no treatment as controls (C). B, Relative chlorophyll content in leaf tissues determined by optical A653 for the three youngest fully expanded leaves (L5–L7). Student’s t test values are shown between C and O (*, P < 0.05; n = 20), P and OP (*, P < 0.05; n = 10), and C and OL (***, P < 0.001; n = 10). C to E, Stomatal conductance (µmol water m−2 s−1) of fully expanded leaves (L6) measured via steady-state porometry for three experimental setups on separate days (n = 10 per treatment per day). F, Differences in stomatal conductance between the treatments and their controls measured simultaneously. A one-tailed Student’s t test evaluated if the mean differences between treatment responses were larger than zero: C versus O (P = 0.07), C versus P (P < 0.05), and O versus OP (**, P < 0.01). Error bars indicate se.
Figure 9.
Figure 9.
Summary of omics and physiological responses in B. nigra during sequential O3 and herbivory stress treatments. The model links metabolome and transcriptome fluctuations to physiological responses of photosynthesis, CO2 assimilation, and stomatal opening. Stress adaptation mechanisms are proposed (1–5). Blue, O3 fumigation (5 d at 70 nL L−1, 16 h per day); red, O3 followed by P. brassicae (24 h, 30 first instar caterpillars). Up arrows indicate up-regulation (genes) or increase (metabolites), and down arrows indicate the opposite. 1 and 2, O3 induces the abiotic stress responses of senescence (EIN3 and ERF2) and stomatal closure (MYB44), with feedback on NOGC1 and FMO. ABA and JA/ET cross talk integrates responses between O3 and sequential herbivory (MYC2 and ERF2), with opposite effects on stomatal closure. 3 and 4, Photosystem suppression (LHCs) and nonphotochemical quenching (NPQ1) in response to O3 are linked to the regulation of glycerolipid metabolism (LPTs, LIP1, and SQD2). Glycerol derived from degraded chloroplast membranes enters the G3P shuttle (GPDHc1/SDP6) to sustain NAD+ recycling and mitochondrial activity (SDH1-1, MSD1, and GABA) as antioxidative stress mechanisms. A possible role of glycerol and sugars as osmolytes also is suggested. Sequential herbivory restores the glycerolipid pathway for alternative source-sink priorities (e.g. JA responses [LOXs/MYC2]). 5, GABA plays multiple roles in plant stress adaptation, regulating Ca2+ homeostasis, carbon-nitrogen metabolism, leaf senescence, ROS scavenging, and signaling of plant-insect interactions.

Similar articles

Cited by

References

    1. Abe H, Urao T, Ito T, Seki M, Shinozaki K, Yamaguchi-Shinozaki K (2003) Arabidopsis AtMYC2 (bHLH) and AtMYB2 (MYB) function as transcriptional activators in abscisic acid signaling. Plant Cell 15: 63–78 - PMC - PubMed
    1. Anderson JP, Badruzsaufari E, Schenk PM, Manners JM, Desmond OJ, Ehlert C, Maclean DJ, Ebert PR, Kazan K (2004) Antagonistic interaction between abscisic acid and jasmonate-ethylene signaling pathways modulates defense gene expression and disease resistance in Arabidopsis. Plant Cell 16: 3460–3479 - PMC - PubMed
    1. Ansari M, Lee RH, Chen SC (2005) A novel senescence‐associated gene encoding γ‐aminobutyric acid (GABA):pyruvate transaminase is upregulated during rice leaf senescence. Physiol Plant 123: 1–8
    1. Ashmore MR. (2005) Assessing the future global impacts of ozone on vegetation. Plant Cell Environ 28: 949–964
    1. Assenov Y, Ramírez F, Schelhorn SE, Lengauer T, Albrecht M (2008) Computing topological parameters of biological networks. Bioinformatics 24: 282–284 - PubMed

Publication types

MeSH terms

LinkOut - more resources