. 2016 Nov 25;291(48):24866-24879.
doi: 10.1074/jbc.M116.746156. Epub 2016 Oct 7.

Characterization of Transient Receptor Potential Vanilloid-1 (TRPV1) Variant Activation by Coal Fly Ash Particles and Associations with Altered Transient Receptor Potential Ankyrin-1 (TRPA1) Expression and Asthma

Affiliations

Characterization of Transient Receptor Potential Vanilloid-1 (TRPV1) Variant Activation by Coal Fly Ash Particles and Associations with Altered Transient Receptor Potential Ankyrin-1 (TRPA1) Expression and Asthma

Cassandra E Deering-Rice et al. J Biol Chem. .

Abstract

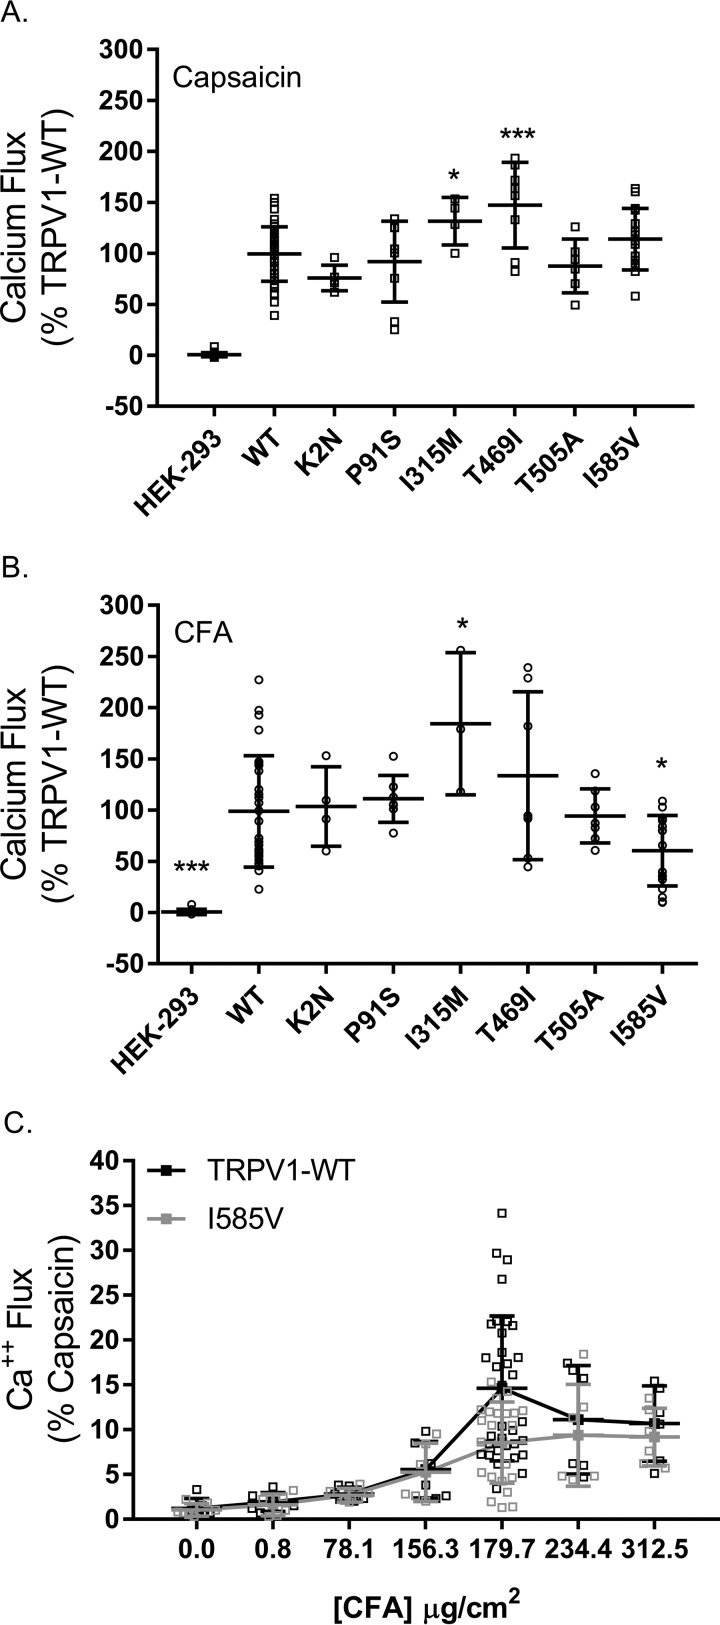
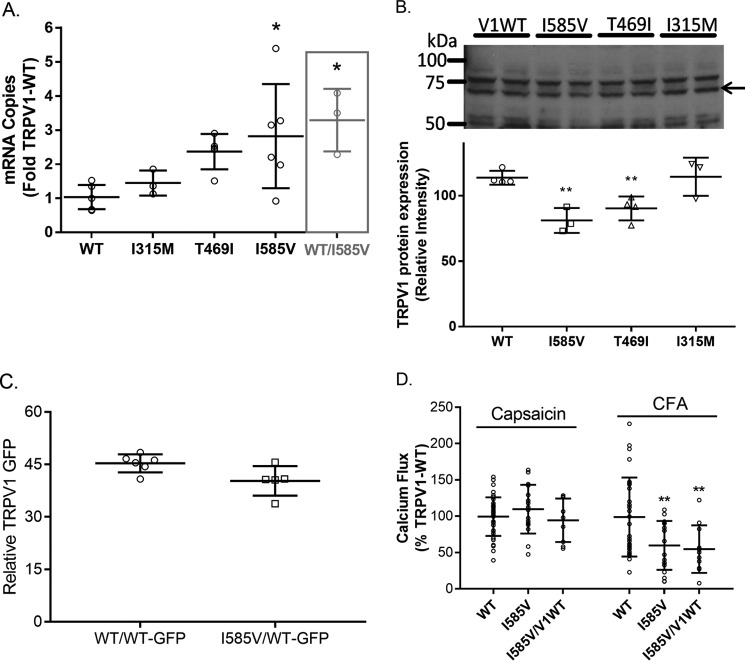
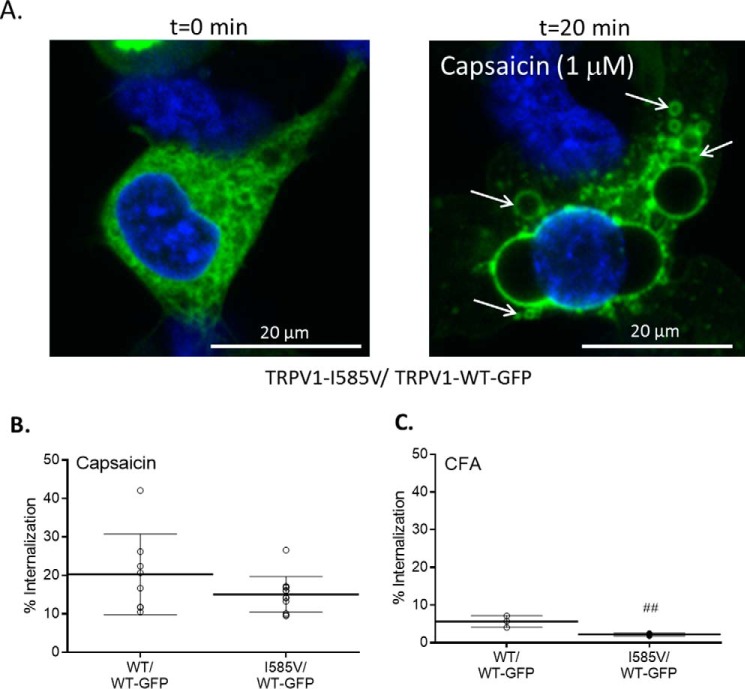
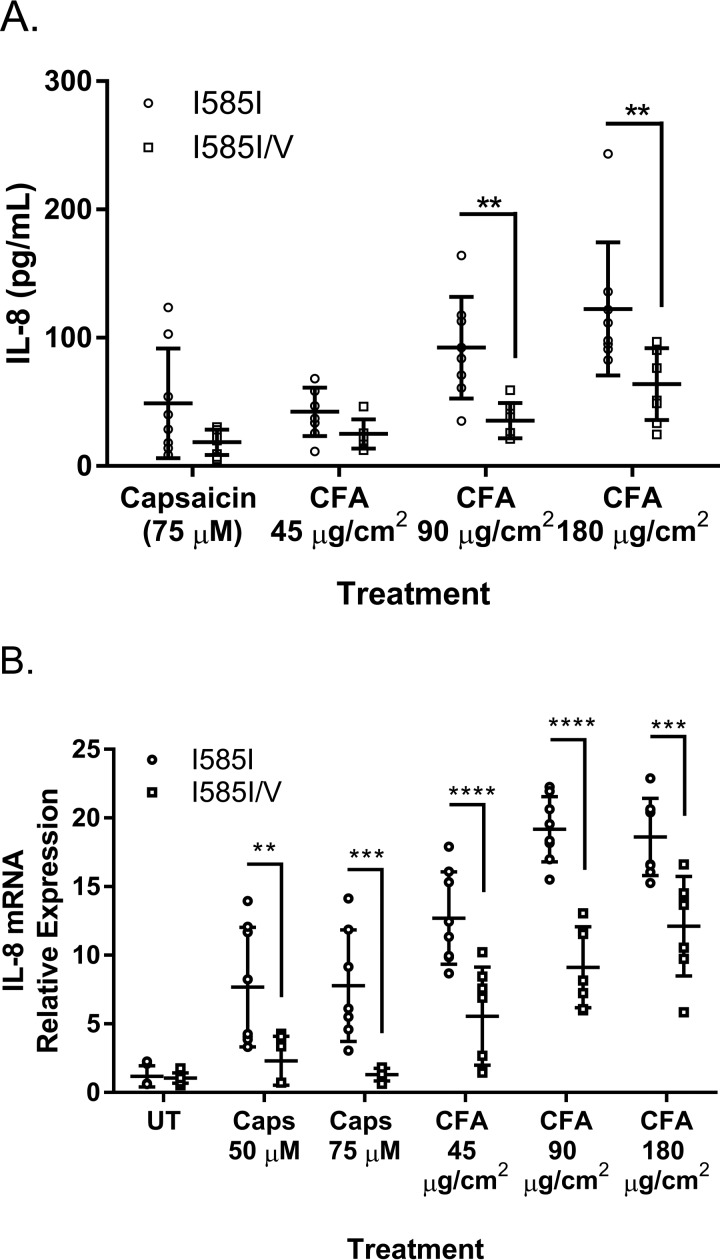
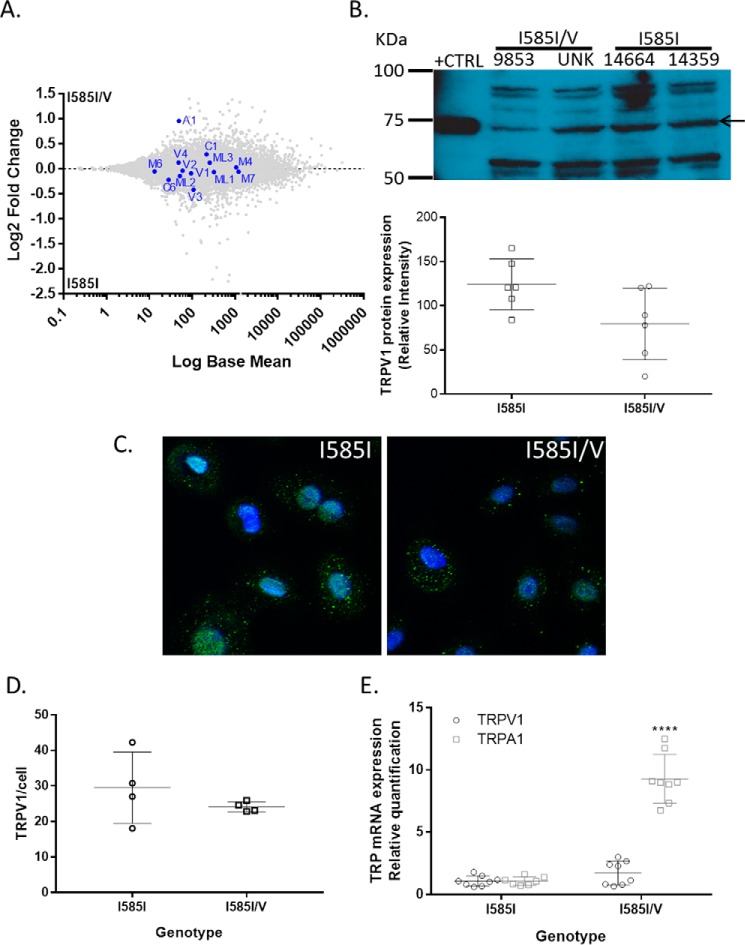
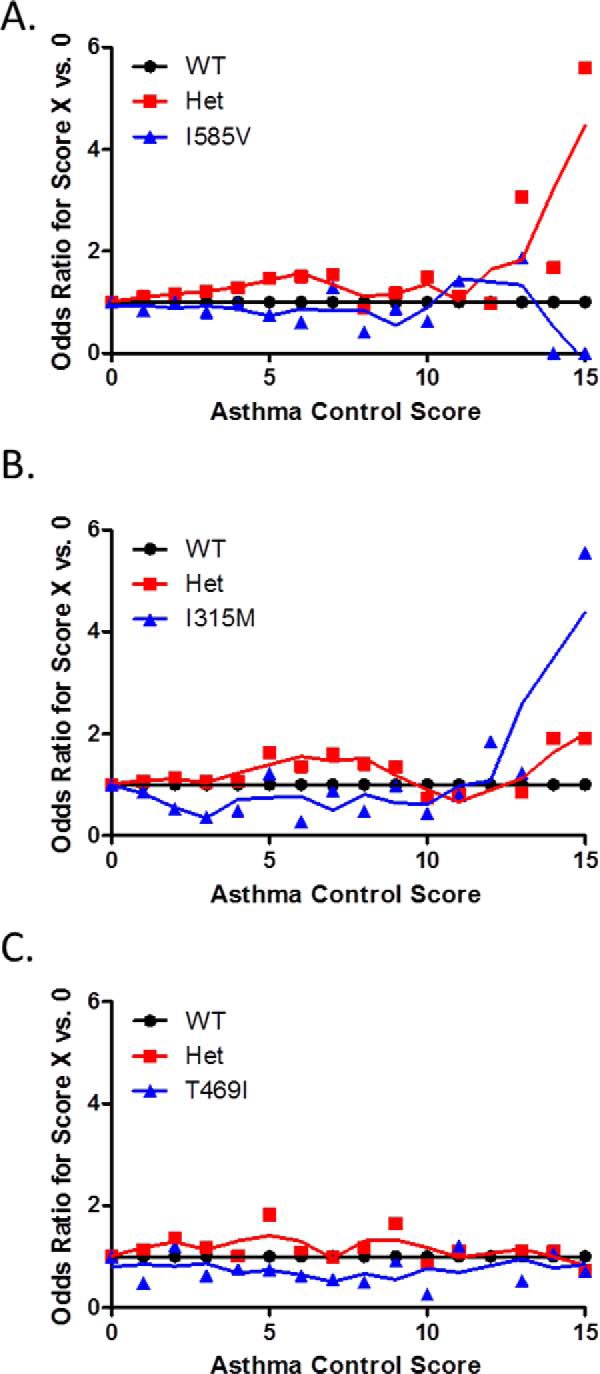
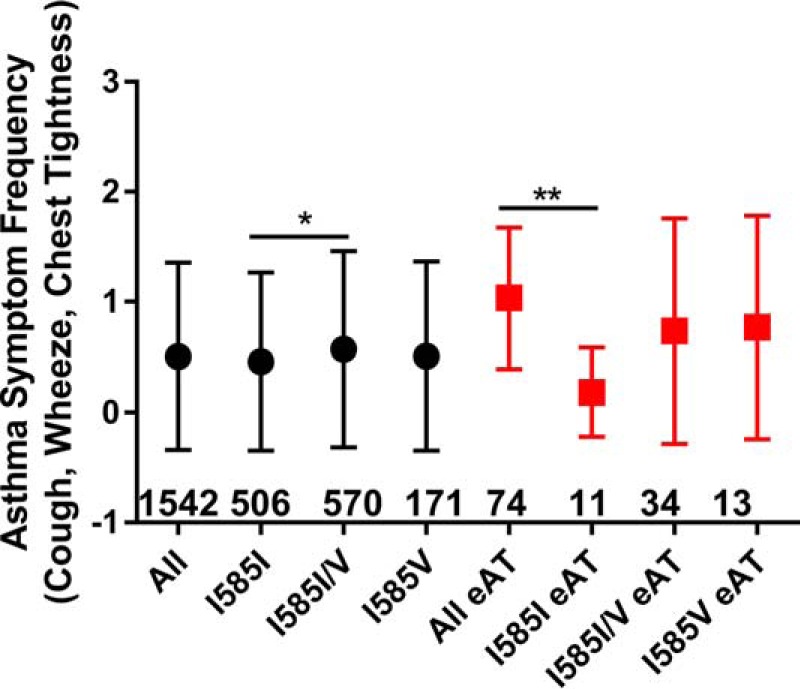
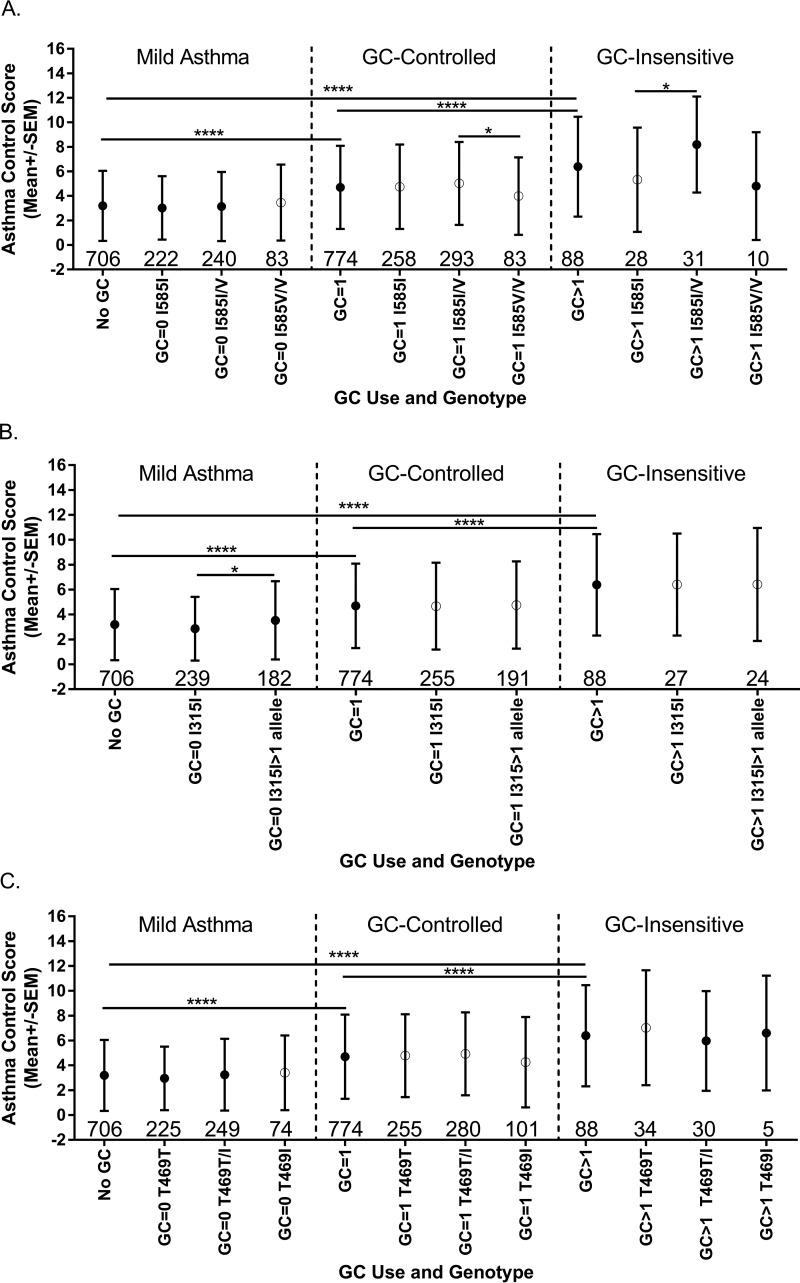
Transient receptor potential (TRP) channels are activated by environmental particulate materials. We hypothesized that polymorphic variants of transient receptor potential vanilloid-1 (TRPV1) would be uniquely responsive to insoluble coal fly ash compared with the prototypical soluble agonist capsaicin. Furthermore, these changes would manifest as differences in lung cell responses to these agonists and perhaps correlate with changes in asthma symptom control. The TRPV1-I315M and -T469I variants were more responsive to capsaicin and coal fly ash. The I585V variant was less responsive to coal fly ash particles due to reduced translation of protein and an apparent role for Ile-585 in activation by particles. In HEK-293 cells, I585V had an inhibitory effect on wild-type TRPV1 expression, activation, and internalization/agonist-induced desensitization. In normal human bronchial epithelial cells, IL-8 secretion in response to coal fly ash treatment was reduced for cells heterozygous for TRPV1-I585V. Finally, both the I315M and I585V variants were associated with worse asthma symptom control with the effects of I315M manifesting in mild asthma and those of the I585V variant manifesting in severe, steroid-insensitive individuals. This effect may be due in part to increased transient receptor potential ankyrin-1 (TRPA1) expression by lung epithelial cells expressing the TRPV1-I585V variant. These findings suggest that specific molecular interactions control TRPV1 activation by particles, differential activation, and desensitization of TRPV1 by particles and/or other agonists, and cellular changes in the expression of TRPA1 as a result of I585V expression could contribute to variations in asthma symptom control.

Keywords: Western blot; asthma; inflammation; single nucleotide polymorphism (SNP); transient receptor potential channels (TRP channels).


Figures

FIGURE 1.
FIGURE 1.
A and B, comparison of TRPV1 and TRPV1 variant activation by capsaicin (A) and CFA (B) is shown. C, dose response for activation of TRPV1-WT and TRPV1-I585V in transfected HEK-293 cells. Data are the mean ± S.D. (error bars) for n ≥ 3 independent assays. * represents p < 0.05, and *** represents p < 0.001 using one-way ANOVA and Dunnett's post hoc test for significant changes relative to wild-type TRPV1-transfected cells.
FIGURE 2.
FIGURE 2.
A, comparison of TRPV1 mRNA expression levels in HEK-293 cells transiently transfected with expression plasmids for wild-type TRPV1 (I585I), I315M, T469I, I585V, or a 1:1 mixture (same total plasmid amount as the individual plasmids) of wild-type TRPV1 and I585V expression plasmids (gray bar). Data represent the mean ± S.D. (error bars) of the ratio of TRPV1 mRNA to β2-microglobulin mRNA normalized to wild-type TRPV1. B, comparison of TRPV1 protein expression by Western blotting. Data represent the mean ± S.D. (error bars) relative to total protein determined by Amido Black staining of PVDF membranes. The arrow represents the TRPV1 protein. C, comparison of TRPV1 variant protein expression in HEK-293 cells co-transfected with TRPV1-WT/TRPV1-WT-GFP or TRPV1-I585V/TRPV1-WT-GFP by flow cytometry. D, comparison of TRPV1 activation (calcium flux) by capsaicin and coal fly ash in HEK-293 cells transfected with wild-type TRPV1, I585V, or a 1:1 mixture of expression plasmids. Data in C and D were analyzed for significant differences from the wild-type control group using one- or two-way ANOVA using Dunnett's post hoc test or Bonferroni's multiple comparisons test to assess changes relative to wild-type TRPV1. * represents p < 0.05, and ** represents p < 0.01.
FIGURE 3.
FIGURE 3.
A, representative images demonstrating TRPV1-GFP internalization elicited by 1 μm capsaicin (arrows). B and C, quantification of TRPV1 internalization induced by capsaicin (1 μm) (B) and CFA (180 μg/cm2) (C). Internalization was quantified by counting any cell exhibiting a time-dependent increase in intracellular GFP-stained vesicles and normalizing to the total cell count (i.e. Hoechst 33342-stained nuclei). Data are represented as the percentage of cells showing TRPV1-WT-GFP internalization relative to the total number of cells in the field. Data represent the mean ± S.D. (error bars). # represents a difference relative to wild-type TRPV1 (p < 0.01).
FIGURE 4.
FIGURE 4.
Comparison of IL-8 protein secretion by ELISA (A) and mRNA expression by quantitative PCR (B) by primary normal NHBE cells from four donor samples expressing either wild-type TRPV1 (I585I) or TRPV1-I585I/V (heterozygotes) following 24-h treatment with either capsaicin (Caps) (50 and 75 μm) or CFA (45, 90, and 180 μg/cm2). Data represent the mean ± S.D. (error bars) of six to eight biological replicates using two separate donor cell lines for wild-type TRPV1 (I585I) and TRPV1-I585I/V. ** indicates statistical significance (p < 0.01), *** represents p < 0.0005, and **** represents p < 0.0001 by two-way ANOVA with Bonferroni's multiple comparisons post hoc testing. UT, untreated.
FIGURE 5.
FIGURE 5.
Comparison of TRP channel expression in primary NHBE cells expressing either wild-type TRPV1 (I585I; donors 9853 and unknown (UNK)) or I585I/V (donors 14664 and 14359). A, log ratio/mean average plot of RNA sequencing data comparing TRP channel gene expression as a function of TRPV1-I585 genotype. B–D, comparison of TRPV1 protein expression by Western blotting (B) and immunocytochemistry (C and D). E, confirmation of increased TRPA1 mRNA expression by quantitative PCR. Western blotting data represent the mean ± S.D. (error bars) relative to total protein. Blue (Hoechst 33342), nuclei; green (Alexa Fluor 488-conjugated antibody), TRPV1. Immunostaining was quantified in ImageJ by counting the number of green punctate foci per cell, representing TRPV1, and normalizing to the number of cells/nuclei, providing the number of TRPV1-positive foci/cell. Data were analyzed for significant differences from the I585I wild-type control group using a t test. **** represents p < 0.0001.
FIGURE 6.
FIGURE 6.
Simple OR values for subjects having an aggregate asthma control score of “X” versus 0, representing ideal asthma symptom control, as a function of TRPV1 genotype. A, I585V; B, I315M; C, T469I. OR calculations were performed using MedCalc. Het, heterozygote.
FIGURE 7.
FIGURE 7.
Comparison of asthma symptom frequency among subjects with wild-type TRPV1 versus I585V in a population of children with asthma (black circles) or subclassified by enrollment in the eAT tracking program (red squares) with the number of subjects in each group provided below or adjacent to the data point. Data are shown as the mean ± S.D. (error bars) and were analyzed for significant differences by one-way ANOVA using either Dunnett's or Bonferroni's multiple comparisons post hoc tests for changes relative to wild-type TRPV1. * represents p < 0.05, and ** represents p < 0.01. Subject numbers for each group are shown above the x axis within the figures.
FIGURE 8.
FIGURE 8.
Comparison of aggregate asthma control scores among asthmatic subjects as a function of asthma (GC) controller medication use and TRPV1 genotype, I585V (A), I315M (B), or I585V (C). Mild asthma is defined as a lack of GC medication use (GC = 0). GC-controlled is based on the use of one GC medication (GC = 1), whereas GC-insensitive is defined by the use of >1 GC medication (GC > 1). Data are shown as the mean ± S.D. (error bars) and were analyzed for significant differences by one-way ANOVA using Bonferroni's multiple comparisons post hoc tests. * represents p < 0.05, and **** represents p < 0.0001. Subject numbers for each group are shown above the x axis within the figures.

Similar articles

Cited by

References

    1. Allen R. W., Mar T., Koenig J., Liu L. J., Gould T., Simpson C., and Larson T. (2008) Changes in lung function and airway inflammation among asthmatic children residing in a woodsmoke-impacted urban area. Inhal. Toxicol. 20, 423–433 - PubMed
    1. Epton M. J., Dawson R. D., Brooks W. M., Kingham S., Aberkane T., Cavanagh J. A., Frampton C. M., Hewitt T., Cook J. M., McLeod S., McCartin F., Trought K., and Brown L. (2008) The effect of ambient air pollution on respiratory health of school children: a panel study. Environ. Health. 7, 16. - PMC - PubMed
    1. Iskandar A., Andersen Z. J., Bønnelykke K., Ellermann T., Andersen K. K., and Bisgaard H. (2012) Coarse and fine particles but not ultrafine particles in urban air trigger hospital admission for asthma in children. Thorax 67, 252–257 - PubMed
    1. Jacquemin B., Sunyer J., Forsberg B., Aguilera I., Bouso L., Briggs D., de Marco R., García-Esteban R., Heinrich J., Jarvis D., Maldonado J. A., Payo F., Rage E., Vienneau D., and Künzli N. (2009) Association between modelled traffic-related air pollution and asthma score in the ECRHS. Eur. Respir. J. 34, 834–842 - PubMed
    1. McConnell R., Islam T., Shankardass K., Jerrett M., Lurmann F., Gilliland F., Gauderman J., Avol E., Künzli N., Yao L., Peters J., and Berhane K. (2010) Childhood incident asthma and traffic-related air pollution at home and school. Environ. Health Perspect. 118, 1021–1026 - PMC - PubMed

MeSH terms