. 2016 Nov 24;128(21):2568-2579.
doi: 10.1182/blood-2016-07-726547. Epub 2016 Oct 6.

Systems analysis uncovers inflammatory Th/Tc17-driven modules during acute GVHD in monkey and human T cells

Affiliations

Systems analysis uncovers inflammatory Th/Tc17-driven modules during acute GVHD in monkey and human T cells

Scott N Furlan et al. Blood. .

Abstract

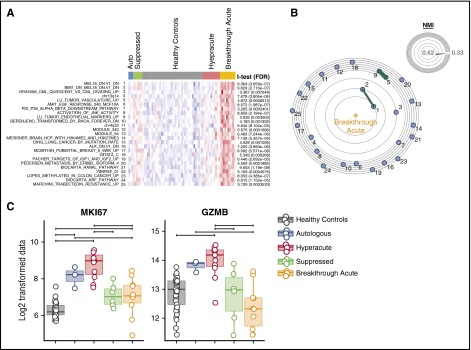
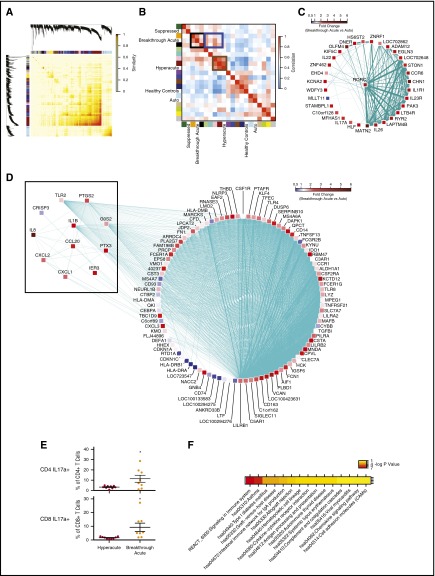
One of the central challenges of transplantation is the development of alloreactivity despite the use of multiagent immunoprophylaxis. Effective control of this immune suppression-resistant T-cell activation represents one of the key unmet needs in the fields of both solid-organ and hematopoietic stem cell transplant (HCT). To address this unmet need, we have used a highly translational nonhuman primate (NHP) model to interrogate the transcriptional signature of T cells during breakthrough acute graft-versus-host disease (GVHD) that occurs in the setting of clinically relevant immune suppression and compared this to the hyperacute GVHD, which develops in unprophylaxed or suboptimally prophylaxed transplant recipients. Our results demonstrate the complex character of the alloreactivity that develops during ongoing immunoprophylaxis and identify 3 key transcriptional hallmarks of breakthrough acute GVHD that are not observed in hyperacute GVHD: (1) T-cell persistence rather than proliferation, (2) evidence for highly inflammatory transcriptional programming, and (3) skewing toward a T helper (Th)/T cytotoxic (Tc)17 transcriptional program. Importantly, the gene coexpression profiles from human HCT recipients who developed GVHD while on immunosuppressive prophylactic agents recapitulated the patterns observed in NHP, and demonstrated an evolution toward a more inflammatory signature as time posttransplant progressed. These results strongly implicate the evolution of both inflammatory and interleukin 17-based immune pathogenesis in GVHD, and provide the first map of this evolving process in primates in the setting of clinically relevant immunomodulation. This map represents a novel transcriptomic resource for further systems-based efforts to study the breakthrough alloresponse that occurs posttransplant despite immunoprophylaxis and to develop evidence-based strategies for effective treatment of this disease.


Figures

Figure 1.
Figure 1.
Immunoprophylactic strategies used in a NHP model of acute GVHD result in a clinical picture that can be categorized as hyperacute, suppressed, or breakthrough acute GVHD. (A) Experimental schema detailing the transplant protocol and immunoprophylaxis regimens used throughout this study. (B) Clinical score based on our previously described NHP GVHD clinical scoring system. Colored circles represent the clinical categories of hyperacute (red), suppressed (green) and breakthrough acute (orange) disease. (C) Comparison of survival curves between hyperacute and breakthrough acute cohorts. The Kaplan-Meier product-limit method was used to calculate survival. Significance was determined using log-rank statistics. aGVHD, acute GVHD; GCSF, granulocyte colony-stimulating factor; TBI, total body irradiation.
Figure 2.
Figure 2.
Animals with breakthrough acute GVHD develop clinical and pathological evidence of disease without the specific T-cell signatures that develop during hyperacute GVHD. (A) Expression of Ki67 and granzyme B (GrmB) in T cells from peripheral blood, measured longitudinally posttransplant. Colored circles represent the clinical categories of hyperacute (red), suppressed (green), and breakthrough acute (orange) disease. Statistical differences between the hyperacute and suppressed cohorts were evaluated at days 2, 5, 8, 12, 18, and 25 posttransplant using an unpaired Student t test, and significant differences of the mean percentage of either CD4 (*) or CD8 (†) cell subtypes were determined using an unpaired Student t test. All other time-point comparisons were not significant. (B) Engraftment/expansion of CD4 and CD8 TCM and TEM from peripheral blood, measured longitudinally posttransplant. Colored circles represent the clinical categories of hyperacute (red), suppressed (green), and breakthrough acute (orange) disease. Statistical differences between the hyperacute and suppressed cohorts were evaluated at days −7, 2, 5, 8, 12, 18, and 25 posttransplant using an unpaired Student t test. *Significant differences of the absolute numbers of the CD4 and CD8 T-cell subpopulations. All other time-point comparisons were not significant. (C) The combined GVHD pathology score (summarizing liver, colon, skin, and lung scores [top panel]) and combined upper GI GVHD score (summarizing esophagus, stomach, and duodenum [Duod.]; [bottom panel]) of recipients from hyperacute (MST = 12 days) and breakthrough acute (MST = 34.5 days) cohorts. Histopathologic analysis was performed at the time of terminal analysis and analyzed by a pathologist (A.P.-M.) in a blinded manner. *P < .05 using the Mann-Whitney test on composite scores. NS, not significant. (D) Flow cytometric analysis of mononuclear cells isolated from peripheral blood, lymphoid, and nonlymphoid GVHD-target organs at the time of terminal analysis from animals from hyperacute and breakthrough acute cohorts and stained for Ki-67 (top and middle panel) and for granzyme B (bottom panel). Plots depict the percentages of CD4 and CD8 T cells expressing Ki-67 and the percentage of CD8 T cells expressing high levels of granzyme B (mean fluorescence intensity [MFI] ≥ 105). *P < .05 using the Mann-Whitney test. LN, lymph node.
Figure 3.
Figure 3.
T-cell profiles from animals with hyperacute GVHD contain an abundance of transcripts associated with proliferation, and exhibit Th1 skewing. (A) First and third principal component projections reveal clustering of transplanted animals by immunoprophylactic strategy. Each dot represents an array sample. The center of inertia ellipses corresponds to the mean projections of the group (P < .05). (B) The first principal component shows a significant correlation with survival in a linear regression model (adjusted [Adj.], R2 = 0.3299; P < .004). (C) Heatmap of the top 25 gene sets enriched in the hyperacute cohort using ssGSEA. The constellation map to the right of the heatmap allows for the identification of clusters of these gene sets. Those gene sets plotted closer to the center have a greater degree of similarity to the phenotype of interest (measured by the normalized mutual information [NMI] score) whereas the angular distance corresponds to gene-set similarity with one another. A dark-green edge further indicates gene-set similarity with the thickness of the line proportional to the Jaccard index., (D) GSEA of transcripts previously shown to differentiate Th1 from Th17 cells. These molecules were found to be overrepresented in T cells from animals with hyperacute GVHD compared with healthy controls and the breakthrough acute cohort. *False discovery rate [FDR] < 0.01. (E) Flow cytometric analysis of PBMCs at the time of terminal analysis stimulated with phorbol myristate acetate (PMA)/ionomycin and measured for the production of IFNγ. *P < .05 using an unpaired t test.
Figure 4.
Figure 4.
The T-cell transcriptome of breakthrough acute GVHD. (A) Heatmap of the top 25 gene sets enriched in the breakthrough acute cohort using ssGSEA and (B) constellation map visualization. (C) Box plots of expression data (Log2 normalized fluorescent intensity signal) for MKI67 and granzyme B (GZMB). Horizontal significance bars denote comparisons with a moderated t statistic < 0.05 corrected for multiple hypothesis testing.
Figure 5.
Figure 5.
T cells during breakthrough acute GVHD display a prosurvival and Th17-skewed phenotype. (A) Flow cytometric analysis of PBMCs measured for the expression of Bcl-2. Plots depict the percentages of CD4 and CD8 T cells expressing Bcl-2. *P < .05 using analysis of variance (ANOVA) with Tukey multiple comparison test. (B) Bar plot of fold-change expression values (log2 normalized) for transcripts in breakthrough acute vs suppressed samples that meet differential expression cutoffs (fold change > 1.3 and P < .05 using a moderated t statistic corrected using the Benjamini procedure.) Red bars, Antiapoptotic transcripts. Blue bars, Proapoptotic transcripts. Gray bars, Genes with other functional attributes. (C) Scatter plot of fold-change expression values (log2 normalized) of breakthrough acute vs healthy controls (HCs) (x-axis) and hyperacute vs healthy controls (y-axis). Blue points denote those transcripts whose expression is above threshold values (log2 fold change < 0.5, and P < .05 using a moderated t statistic corrected using the Benjamini procedure) and whose expression in both breakthrough acute and hyperacute samples is overrepresented or underrepresented relative to healthy controls. Red points denote pivot transcripts, whose expression meets cutoffs noted above, and whose differential expression in breakthrough acute and hyperacute samples compared with healthy controls are in opposite directions. (D) Heatmap showing the expression levels of inflammatory Tc17-related genes identified in a study of fate-mapped murine Tc17 cells in the NHP breakthrough acute GVHD arrays compared with either autologous controls (Auto, left column) or healthy controls (HC, right column). The rows in the heatmap contain 24 genes previously identified as overrepresented (n = 12, top half of heatmap) and underrepresented (n = 12, bottom half of heatmap) in murine Tc17 cells during GVHD relative to controls. One gene (Ly6c1) identified in the murine study was not included in this analysis, as it has no human/NHP ortholog. The columns reveal the expression of these genes in the breakthrough acute cohort vs either autologous (left) or healthy controls (right). The column to the right of the gene names designates whether the direction of expression in breakthrough acute vs autologous or healthy controls is concordant (gray boxes) or not (white boxes) with the expression in murine Tc17 cells.
Figure 6.
Figure 6.
WGCNA reveals a Th/Tc17 transcriptional program mediating breakthrough acute GVHD in NHP. (A) Topological overlap matrix plot with hierarchical clustering tree and the resulting gene modules from a weighted network of T-cell transcripts. (B) Eigengene adjacency heatmap showing module eigengene similarity to NHP clinical cohorts. (C) Visualization of gene coexpression network connections between the most connected genes in the orange module using Cytoscape. Shown are nodes and network connections with topological overlap above a threshold of 0.05. Mean expression fold-change values of breakthrough acute vs autologous cohorts for each gene is visualized using a false-color scale. (D) Visualization of gene coexpression network connections between the most connected genes in the black module using Cytoscape. Shown are nodes with network connections whose topological overlap is above a threshold of 0.05. Edges with network connections above the threshold of 0.07 are shown. Mean expression fold change values of breakthrough acute vs autologous cohorts for each gene are visualized using a false-color scale. (E) Flow cytometric analysis of PBMCs at the time of terminal analysis stimulated with PMA/ionomycin and measured for the production of IL17a. *P < .05 using an unpaired t test. (F) Pathway enrichment for genes in the black WGCNA module performed using DAVID. Shown are those terms with a P < .05 (corrected for multiple hypothesis testing using the Benjamini procedure). Significance values are displayed using a false-color scale and are given in units of −log10 of the corrected P value.
Figure 7.
Figure 7.
Evolution of module enrichment in T cells from patients with GVHD. (A) Gene-set enrichment plot of selected NHP-WGCNA modules in patients who were diagnosed with GVHD at day 28 ± 7 posttransplant. Significant running enrichment scores were found in the dark-red and pink modules, but not for the orange and black modules for the day 28 samples. *FDR < 0.01. (B) Gene-set enrichment plot of selected NHP-WGCNA modules in patients who were diagnosed with GVHD day 60 ± 7 posttransplant. Significant running enrichment scores were found for both orange and black NHP gene modules at day 60 in patients with GVHD. Enrichment was also noted for the dark-red module, but not the pink module in the day 60 samples. *FDR < 0.01. (C) Heatmap showing the evolution of enrichment of the black module in patients diagnosed with GVHD at day 28 compared with day 60. Patients with GVHD were dichotomized into early GVHD (either at day 28 ± 7 posttransplant) or late GVHD (day 60 ± 7 posttransplant). Genes shown are those from the black NHP module exhibiting leading edge enrichment in patients at day 60 and their expression in either day 28 or day 60 GVHD patients relative to GVHD-negative controls.

Similar articles

Cited by

References

    1. McDonald-Hyman C, Turka LA, Blazar BR. Advances and challenges in immunotherapy for solid organ and hematopoietic stem cell transplantation. Sci Transl Med. 2015;7(280):280rv2. - PMC - PubMed
    1. Organ Procurement and Transplantation Network. Available at: http://optn.transplant.hrsa.gov/.
    1. Blazar BR, Murphy WJ, Abedi M. Advances in graft-versus-host disease biology and therapy. Nat Rev Immunol. 2012;12(6):443-458. - PMC - PubMed
    1. Miller WP, Srinivasan S, Panoskaltsis-Mortari A, et al. . GVHD after haploidentical transplantation: a novel, MHC-defined rhesus macaque model identifies CD28- CD8+ T cells as a reservoir of breakthrough T-cell proliferation during costimulation blockade and sirolimus-based immunosuppression. Blood. 2010;116(24):5403-5418. - PMC - PubMed
    1. Kaliyaperumal S, Watkins B, Sharma P, et al. . CD8-predominant T-cell CNS infiltration accompanies GVHD in primates and is improved with immunoprophylaxis. Blood. 2014;123(12):1967-1969. - PMC - PubMed

Publication types

MeSH terms