. 2016 Dec 1;76(23):7049-7058.
doi: 10.1158/0008-5472.CAN-16-0715. Epub 2016 Oct 6.

Oncogenic Functions of Gli1 in Pancreatic Adenocarcinoma Are Supported by Its PRMT1-Mediated Methylation

Affiliations

Oncogenic Functions of Gli1 in Pancreatic Adenocarcinoma Are Supported by Its PRMT1-Mediated Methylation

Yan Wang et al. Cancer Res. .

Abstract

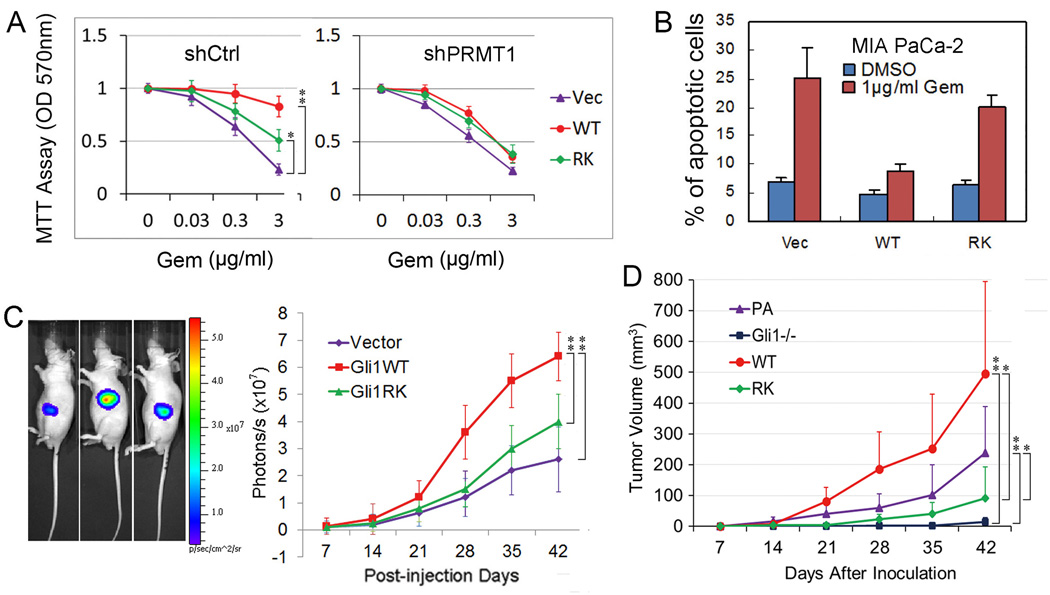
The oncogenic transcription factor Gli1 is a critical effector in the Hedgehog (Hh) pathway, which is necessary for the development and progression of pancreatic ductal adenocarcinoma (PDAC). Although TGFβ and K-Ras are known regulators of Gli1 gene transcription in this setting, it is not understood how Gli1 functional activity is regulated. Here, we report the identification of Gli1 as a substrate for the protein arginine N-methyltransferase PRMT1 in PDAC. We found that PRMT1 methylates Gli1 at R597, promoting its transcriptional activity by enhancing the binding of Gli1 to its target gene promoters. Interruption of Gli1 methylation attenuates oncogenic functions of Gli1 and sensitizes PDAC cells to gemcitabine treatment. In human PDAC specimens, the levels of both total Gli1 and methylated Gli1 were correlated positively with PRMT1 protein levels. Notably, PRMT1 regulated Gli1 independently of the canonical Hh pathway as well as the TGFβ/Kras-mediated noncanonical Hh pathway, thereby signifying a novel regulatory mechanism for Gli1 transcriptional activity. Taken together, our results identified a new posttranslational modification of Gli1 that underlies its pivotal oncogenic functions in PDAC. Cancer Res; 76(23); 7049-58. ©2016 AACR.


Conflict of interest statement

The authors have declared that no conflict of interest exists.

Figures

Figure 1
Figure 1. Correlation between the Expression Levels of Gli1 and PRMT1 in PDAC Cells
(A) GLI1 mRNA levels according to TCGA data for patients with the seven deadliest cancers in the United States in 2014. The data are medians with the 5th and 95th percentiles and standard deviations (error bars). (B) Western blot analysis of immunoprecipitation (IP) of endogenous Gli1 and PRMT1 in AsPC-1 cells. IgG, immunoglobulin G. (C) AsPC-1 cells expressing scrambled shRNA (sh-Ctrl), PRMT1-targeting shRNA (sh-PRMT1 #1, 2, or 3), or PRMT1-targeting shRNA (sh-PRMT1 #1) with reconstituted shRNA-resistant PRMT1. (D) Western blot analysis of Gli1 and PRMT1 in three PDAC cell lines infected with control (Ct) or PRMT1 (Pr) shRNA. The results were quantified using ImageJ software, and normalized to the values for tubulin. The experiments were performed at least two times to assure reproducibility of the results. (E) mRNA expression of endogenous Gli1 and PRMT1 measured by quantitative real-time PCR in the indicated cell lines transfected with control shRNA or sh-PRMT1. The data are means with standard deviations (n = 3). *P< 0.05, **P< 0.01 (paired two-tailed Student’s t-test). (F) Representative immunohistochemistry staining of Gli1 and PRMT1 in human PDAC tissues. All immunostained slides were scanned on the ACIS III automated cellular image system for quantification by digital image analysis. The percentage of positive cells (X) and signal intensity (Y) are shown. The number from X × Y represents an arbitrary quantitative score. Tumor (T) area was labeled with dash line. The positive staining in stroma is labeled with arrowhead. (G) Analysis of correlation between Gli1 and PRMT1 levels on the basis of immunohistochemistry results for 122 human PDAC tissue samples. Protein expression was calculated from both the percentage of stained cells and the immunostaining intensity. Protein expression levels above and below the mean for all samples were categorized as high and low, respectively. There are 4 categories based on the Gli1 and PRMT1 scores on all of the immunostained slides: 1) Gli1 and PRMT1 high; 2) Gli1 and PRMT1 low; 3) Gli1 high and PRMT1 low; 4) Gli1 low and PRMT1 high. Fisher’s exact test was used to evaluate the correlation between Gli1 and PRMT1 in the 122 human tissue slides (P < 0.05).
Figure 2
Figure 2. Methylation of Gli1 by PRMT1
(A) In vitro methylation assay with PRMT1 and wild-type (WT) or R597K-mutant Gli1. Left panel, Coomassie Blue staining. Right panel, fluorography. (B) Western blot analysis of immunoprecipitation (IP) with antibody specific to meGli1R597 (meGli1), antibody to total Gli1, and other antibodies as indicated in MIA PaCa-2 cells transfected with a plasmid carrying Flag (FL)-tagged WT Gli1 or R597K-mutant Gli1 (RK). (C) Western blot analysis of meGli1, Gli1, and PRMT1 in MIA PaCa-2 cells transfected with an empty vector or a hemagglutinin (HA)-tagged PRMT1 plasmid. (D) Western blot and correlation analysis of meGli1 and PRMT1 in human PDAC xenografts maintained in mice. Each set of samples was subjected to two independent Western blotting (upper panels), and the bands were quantified using ImageJ software. Mean expression levels were used to determine Pearson coefficients for correlation between PRMT1 and meGli1, between PRMT1 and Gli1, and between Gli1 and meGli1 (lower panels).
Figure 3
Figure 3. R597 Methylation Positively RegulatesGli1 Transcriptional Activity
(A) Left panel, Western blot analysis of meGli1 and total Gli1 in MIA PaCa-2 luciferase cells stably transfected with an empty vector (Vec), wild-type Gli1 (Gli1WT), or R597K-mutant Gli1 (Gli1RK). Right panel, mRNA expression levels, measured by quantitative real-time PCR, of Gli1 target genes in Vec-, Gli1WT (WT)-, and Gli1RK (RK)-transfected MIA PaCa-2 cells. Error bars represent SD (n = 3). *P < 0.05, **P < 0.01 (paired two-tailed Student’s t-test). (B) Left panel, Western blotting of Gli1 protein levels in AsPC-1 parental cells (PA), AsPC-1 cells with Gli1 knockout (Gli1−/−), and Gli1−/− AsPC-1 cells reconstituted with Gli1 (WT) or Gli1 RK mutant (RK). The intensity of the bands was quantified and normalized to that of tubulin. Right panel, mRNA expression of Gli1 target genes by qRT-PCR in PA, Gli1−/−, WT, and RK cells. The expression levels of target genes were normalized to that of ACTIN. Statistical significance was determined by paired, two-tailed Student’s t-test. Error bars represent SD (n = 3). *P < 0.05, **P < 0.01. (C) mRNA levels of IGFBP6 and BCL2 in MIA PaCa-2 cells transfected with wild-type Gli1 and an empty vector (WT/Vec), wild-type Gli1 and PRMT1 (WT/Prm), R597K-mutant Gli1 and an empty vector (RK/Vec), or R597K-mutant Gli1 and PRMT1 (RK/Prm). The value of WT/Prm was normalized to that of WT/Vec. The value of RK/Prm was normalized to that of RK/Vec. Error bars represent SD (n = 3). *P < 0.05 (paired two-tailed Student’s t-test). (D) Left panel, ChIP assay using Gli1 antibody for immunoprecipitation (IP) and promoter-specific primers for quantitative qRT-PCR to confirm Gli1 binding regions in promoters. IgG, immunoglobulin G; SP, primers specific to Gli1 binding regions; NSP, primers not specific to Gli1 binding regions. Middle panel, protein expression of hemagglutinin-tagged wild-type Gli1 (HA-WT) and Flag-tagged R597K-mutant Gli1 (Flag-RK) in 293T cells. Right panel, quantitative results of ChIP assay. WT, wild-type Gli1; RK, R597K-mutant Gli1. Error bars represent SD. (E) Quantitative results of ChIP assay for Gli1-bound promoters of IGFBP6 and BCL2 from qRT-PCR analyses in MIA PaCa-2 cells carrying wild-type (WT) or R597K-mutant (RK) Gli1 and infected with virus carrying control shRNA (shC) or shRNA targeting PRMT1 (shP). Error bars represent SD (n = 3). *P < 0.05, **P < 0.01 (paired two-tailed Student’s t-test). (F) Analysis of IGFBP6 and BCL2 promoters bound by Gli1 by ChIP-qPCR in AsPC-1 cells expression scrambled (sh-Ctrl) shRNA, PRMT1-targeting (sh-PRMT1 #1 and #2) shRNA, or PRMT1-targeting shRNA with reconstituted wild type PRMT1 (sh#1-Rsc). Statistical significance was determined by paired, two-tailed Student’s t-test. Error bars represent SD from triplicate experiments. *P < 0.05, **P < 0.01.
Figure 4
Figure 4. R597 methylation positively regulates Gli1 oncogenic functions
(A) Responses of MIA PaCa-2 stable clones to gemcitabine with or without PRMT1 depletion. shCtrl: control shRNA; shPRMT1: PRMT1 shRNA; Vec: MIA PaCa-2 stable clone with empty vector; WT: stable clone with wild-type Gli1; RK: stable clone with Gli1R597 mutant. Error bars represent SD (n = 4). (B) Propidium iodide staining by fluorescence-activated cell sorting to determine the percentage of apoptosis in different stale clones with or without gemcitabine. Error bars represent SD (n = 3). (C) The indicated MIA PaCa-2 stable clones were inoculated into the pancreas of 6-week nude mice. Tumor volume was measured at the indicated time points using the formula (Length) × (Width)2. Vector: MIA PaCa-2-Luc stable cells; Gli1WT: MIA PaCa-2-Luc Gli1WT stable cells; Gli1RK: MIA PaCa-2-Luc Gli1R597K stable cells. Error bars represent SD (n = 5). (D) AsPC-1 parental cells (PA), AsPC-1 cells with Gli1 knockout (Gli1−/−), or Gli1−/− AsPC-1 cells reconstituted with Gli1 (WT) or Gli1 RK mutant were subcutaneously injected into the right flank of nude mice (n = 7). Tumor volume was measured once a week. Statistical significance was determined by paired, two-tailed Student’s t-test. Error bars represent SD. *P < 0.05, **P < 0.01.
Figure 5
Figure 5. PRMT1Regulates Gli1 via a Novel Non-Canonical Hh Pathway
(A) MTT assay of the indicated MIA PaCa-2 stable cells treated with GANT58 or GANT61. The data are means (relative to the value for day 1) with standard deviations (n = 3). *P < 0.05, **P < 0.01 (paired two-tailed Student’s t-test). (B) A schematic diagram illustrating the regulation of Gli1 via SMO-dependent (cHh) or SMO-independent (non-canonical Hh) pathways in PDAC.

Similar articles

Cited by

References

    1. Barakat MT, Humke EW, Scott MP. Learning from Jekyll to control Hyde: Hedgehog signaling in development and cancer. Trends in molecular medicine. 2010;16(8):337–348. - PMC - PubMed
    1. Ng JM, Curran T. The Hedgehog's tale: developing strategies for targeting cancer. Nat Rev Cancer. 2011;11(7):493–501. - PMC - PubMed
    1. Robbins DJ, Fei DL, Riobo NA. The Hedgehog signal transduction network. Science signaling. 2012;5(246):re6. - PMC - PubMed
    1. Wang Y, Ding Q, Yen CJ, Xia W, Izzo JG, Lang JY, et al. The crosstalk of mTOR/S6K1 and Hedgehog pathways. Cancer cell. 2012;21(3):374–387. - PMC - PubMed
    1. Mao J, Maye P, Kogerman P, Tejedor FJ, Toftgard R, Xie W, et al. Regulation of Gli1 transcriptional activity in the nucleus by Dyrk1. The Journal of biological chemistry. 2002;277(38):35156–35161. - PubMed

Publication types

Substances

LinkOut - more resources