. 2016 Dec 1;76(23):6937-6949.
doi: 10.1158/0008-5472.CAN-16-1899. Epub 2016 Oct 7.

E2A-PBX1 Remodels Oncogenic Signaling Networks in B-cell Precursor Acute Lymphoid Leukemia

Affiliations

E2A-PBX1 Remodels Oncogenic Signaling Networks in B-cell Precursor Acute Lymphoid Leukemia

Jesús Duque-Afonso et al. Cancer Res. .

Abstract

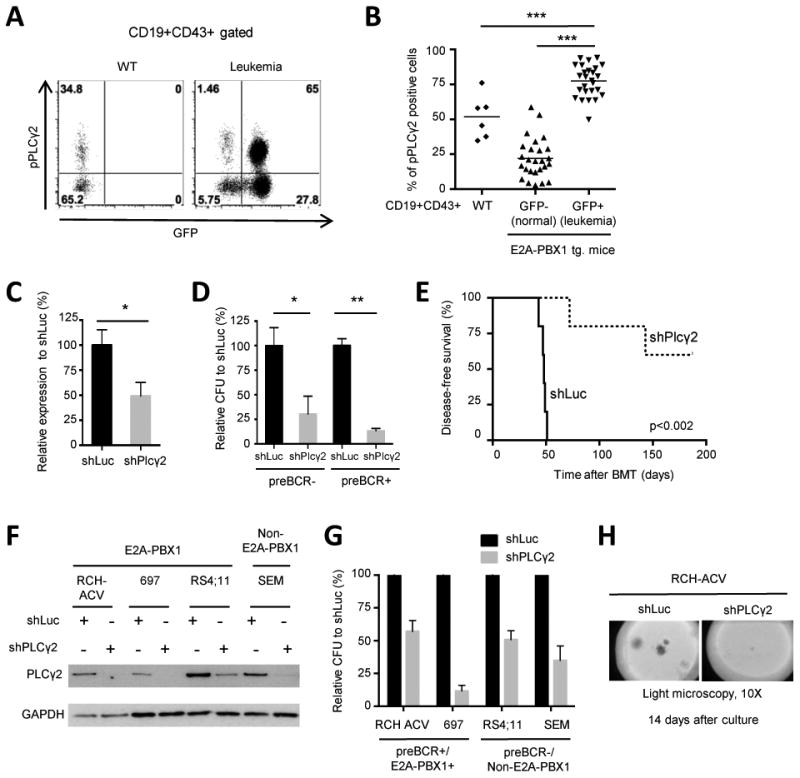
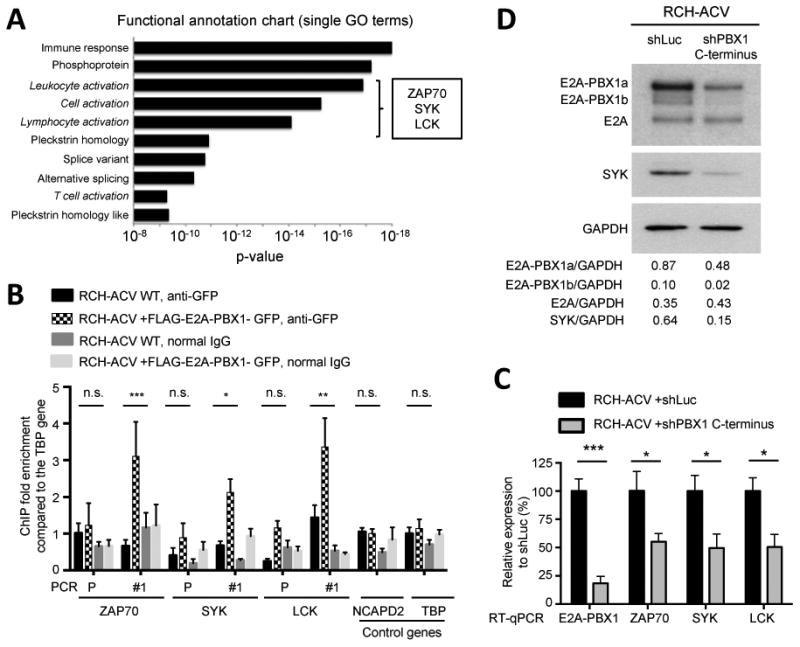
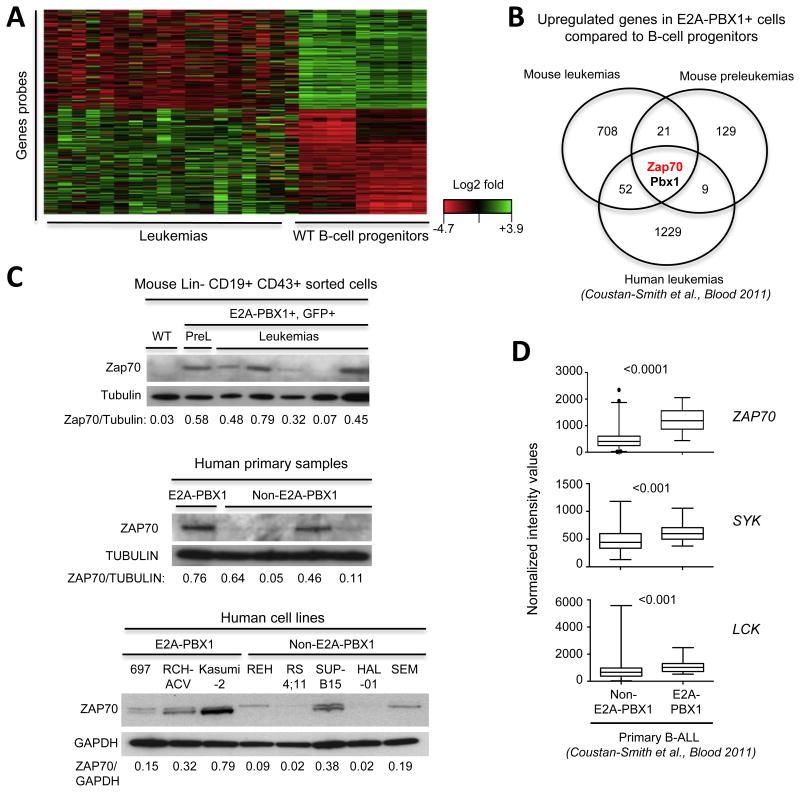
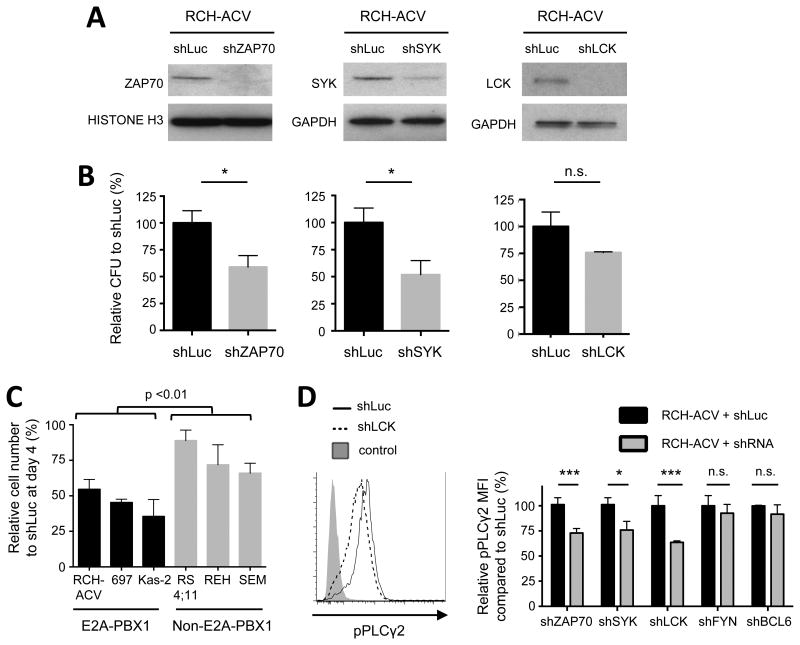
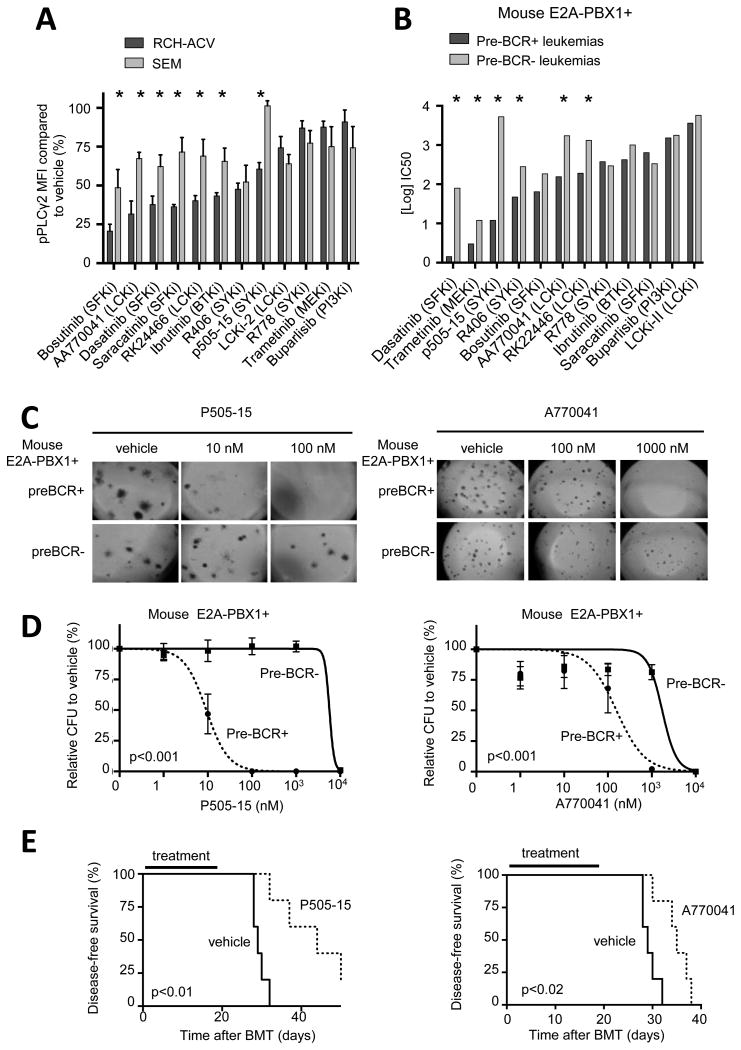
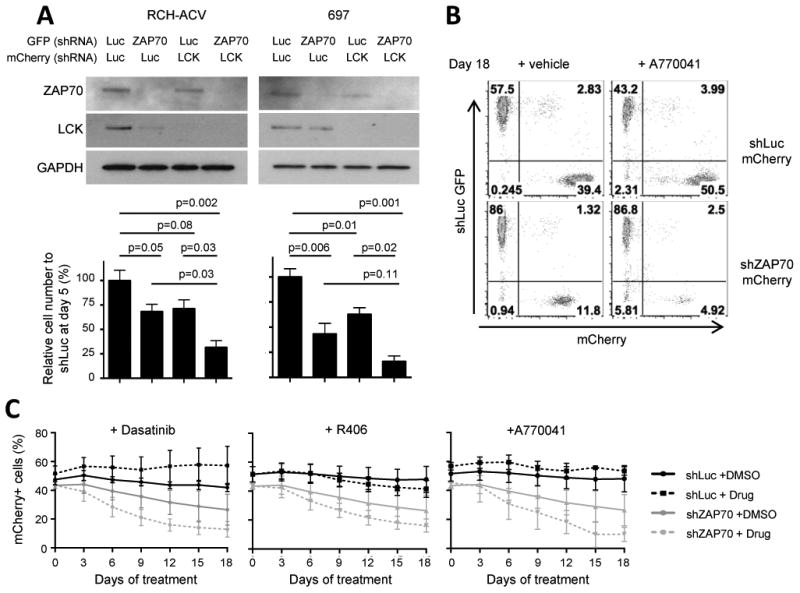
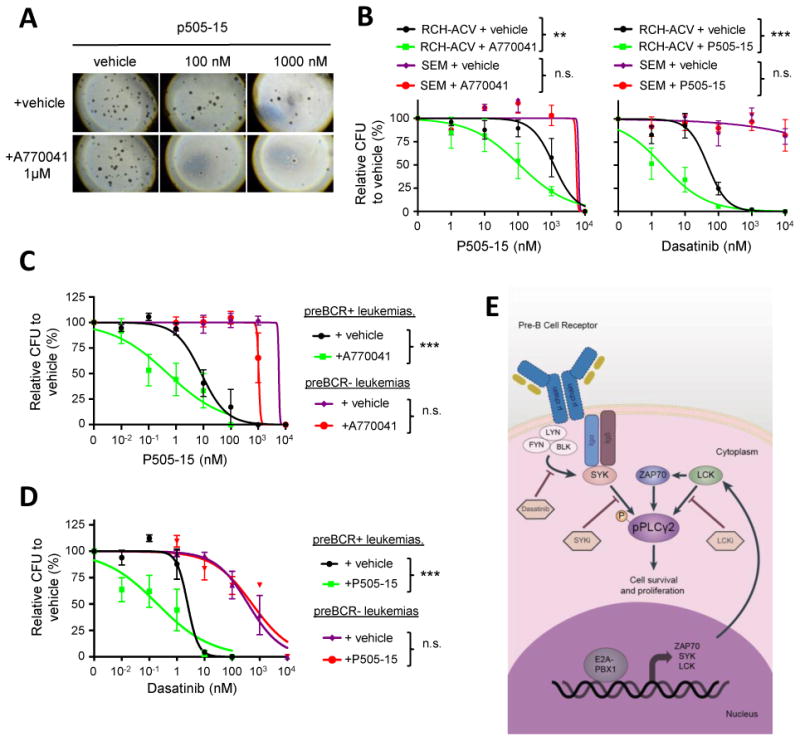
There is limited understanding of how signaling pathways are altered by oncogenic fusion transcription factors that drive leukemogenesis. To address this, we interrogated activated signaling pathways in a comparative analysis of mouse and human leukemias expressing the fusion protein E2A-PBX1, which is present in 5%-7% of pediatric and 50% of pre-B-cell receptor (preBCR+) acute lymphocytic leukemia (ALL). In this study, we describe remodeling of signaling networks by E2A-PBX1 in pre-B-ALL, which results in hyperactivation of the key oncogenic effector enzyme PLCγ2. Depletion of PLCγ2 reduced proliferation of mouse and human ALLs, including E2A-PBX1 leukemias, and increased disease-free survival after secondary transplantation. Mechanistically, E2A-PBX1 bound promoter regulatory regions and activated the transcription of its key target genes ZAP70, SYK, and LCK, which encode kinases upstream of PLCγ2. Depletion of the respective upstream kinases decreased cell proliferation and phosphorylated levels of PLCγ2 (pPLCγ2). Pairwise silencing of ZAP70, SYK, or LCK showed additive effects on cell growth inhibition, providing a rationale for combination therapy with inhibitors of these kinases. Accordingly, inhibitors such as the SRC family kinase (SFK) inhibitor dasatinib reduced pPLCγ2 and inhibited proliferation of human and mouse preBCR+/E2A-PBX1+ leukemias in vitro and in vivo Furthermore, combining small-molecule inhibition of SYK, LCK, and SFK showed synergistic interactions and preclinical efficacy in the same setting. Our results show how the oncogenic fusion protein E2A-PBX1 perturbs signaling pathways upstream of PLCγ2 and renders leukemias amenable to targeted therapeutic inhibition. Cancer Res; 76(23); 6937-49. ©2016 AACR.


Conflict of interest statement

Conflict of Interest Disclosure: The authors declare no competing financial interests.

Figures

Figure 1
Figure 1. PLCγ2 is hyper-phosphorylated in mouse E2A-PBX1+ leukemias and is essential for proliferation
(A) Dot plots show phospho-flow analysis of pPLCγ2 in CD19+CD43+ B-cell progenitors from bone marrow of representative wild-type (WT), and leukemic mice. GFP is activated in mouse cells expressing the E2A-PBX1 transgene. CD19+CD43+GFP- cells from leukemia mice are B-cell progenitors, which did not recombine E2A with the PBX1 transgene. (B) Diagram shows percentages of pPLCγ2 positive cells in WT (n=6) and E2A-PBX1 transgenic/leukemic mice (n=26) of the indicated subpopulations. Each dot represents a bone marrow sample. Statistical analysis performed by Mann-Whitney U test, *** p-value <0.001. Tg., transgenic. (C) Knockdown efficiency of PLCγ2 in mouse E2A-PBX1+ leukemias was quantified by RT-qPCR after 7 days of transduction. Data represent mean ± SEM (n=5 independent experiments). (D) Colony forming units were enumerated 7 days after FACS-sorting of mCherry+ mouse leukemia cells (pre-BCR- and pre-BCR+ leukemias derived from different E2A-PBX1 transgenic mice) with lentiviral vectors containing indicated shRNAs (n=3 independent experiments). Statistical analysis performed by Student's t-test in (C) and (D). ** p-value <0.01, * p-value <0.05. (E) Mouse preBCR+/E2A-PBX1+ leukemia cells were transduced with control (shLuc) and PLCγ2 shRNAs and transplanted into secondary mouse recipients (n=5 mice in each group). Kaplan-Meier curve shows percentage of disease-free survival after secondary transplantation. Statistical analysis was performed using the log-rank (Mantel-Cox) test. (F) Western blot shows shRNA-mediated knock-down of PLCγ2 in human ALL cell lines. GAPDH was used as loading control. (G) Colony forming assay of human ALL cell lines after shRNA-mediated knockdown of PLCγ2 or luciferase. Data represent mean ± SEM (n=3 independent experiments). (H) Colony morphologies of transduced cells after 14-day culture as visualized by light microscopy (original magnification 10×).
Figure 2
Figure 2. E2A-PBX1 binds target genes encoding kinases ZAP70, LCK and SYK that function upstream of PLCγ2
(A) Functional annotation clustering of enriched pathways and biological processes of previously published E2A-PBX1 target genes by ChIP-seq (1) was performed using DAVID functional annotation tool. In italic, signaling pathways identified upstream of PLCγ2. Candidate kinases were identified from the list of genes of each gene ontology term. (B) Chromatin occupancy determined by ChIP-qPCR of exogenous GFP-tagged E2A-PBX1 in RCH-ACV cells is shown. Primers were designed for identified ChIP-seq peaks (1) (Supplementary Fig. S1). Promoter regions of ZAP70 and SYK and intergenic region of LCK not bound by E2A-PBX1 were used as controls. Immunoprecipitations with normal IgG were used as controls for unspecific binding. Data were analyzed using the ΔΔCT method and normalized to 1% input. Diagram shows fold enrichment relative to the TBP control gene and data represent mean ± SEM (n=3 independent experiments). Statistical analysis was performed by Student's t-test. *** p-value <0.001, ** p-value <0.01, * p-value <0.05 and n.s., not significant. (C) RCH-ACV cells were transduced with lentiviral vectors expressing shRNA for luciferase (control) or PBX1 C-terminus (sequence contained in the fusion gene). Of note, wild type PBX1 is not expressed in RCH-ACV cells (data not shown). Expression of indicated transcripts was quantified by RT-qPCR 7 days after transduction and normalized to control cells. ACTB was used as housekeeping gene. Data represent mean ± SEM (n=4 independent experiments). Statistical analysis performed by Student's t-test, * p-value <0.05, *** p-value <0.001. (D) Western blot of a representative experiment from (C) showing the expression of E2A, E2A-PBX1 and SYK. GAPDH was used as loading control. The relative ratio of protein expression (shown below) was determined by densitometry and normalized to GAPDH.
Figure 3
Figure 3. Consistent upregulation of ZAP70, SYK and LCK in E2A-PBX1 transformation
(A) Heat map shows differential intensity values for probes in microarray analysis comparing mouse E2A-PBX1 leukemias (n=18) and sorted Lin-CD19+CD43+ wild-type progenitor B cells (n=9). Each row represents a gene and each column a sample. Red: lower expression, green: higher expression. Analyses were performed using an FDR < 0.05 and fold differential expression >1.2. Probes with low intensity values were filtered. (B) Venn diagram shows shared upregulated genes across E2A-PBX1 cells compared to normal mouse (Lin-CD19+CD43+) and human (CD19+CD10+) B-cell progenitors. Gene expression from human E2A-PBX1 patients and normal B-cell progenitors were obtained from a publicly available database (21). (C) Western blot analysis of Zap70 in E2A-PBX1-expressing cells from mouse E2A-PBX1+ leukemias and preleukemias, human primary leukemias and cell lines. Tubulin and Gapdh served as loading controls. The ratio of ZAP70/Tubulin and ZAP70/GAPDH levels (shown below) was determined by densitometry. (D) Published data sets (21) were analyzed for ZAP70, SYK and LCK expression levels in E2A-PBX1 (n=22) versus non-E2A-PBX1 (n=216) human primary B-ALL. Statistical analysis was performed by Mann-Whitney U test.
Figure 4
Figure 4. Oncogenic role of ZAP70, SYK and LCK in human ALL cell lines
(A) Western blots show protein levels after shRNA-mediated knock-down of the indicated genes. GAPDH and histone H3 were used as loading controls. (B) Colonies were enumerated 14 days after FACS sorting and normalized to the number of colonies in control cells. Data represent mean ± SEM (n=4 independent experiments). CFU, colony-forming units. Statistical analysis performed by Student's t-test, * p-value <0.05, n.s., not significant. (C) E2A-PBX1 leukemia cell lines (n=3) and non-E2A-PBX1 cell lines (n=3) were depleted for ZAP70 and cells were enumerated in liquid culture using trypan blue exclusion assay 4 days after FACS sorting and compared to control transduced cells (shLuc). Data represent mean ± SEM (n=3 independent experiments). Statistical analysis between groups was performed using two-way ANOVA. (D) RCH-ACV cells were interrogated for phosphorylated PLCγ2 after shRNA-mediated knock-down of E2A-PBX1 target genes compared to control transduced cells (shLuc). mCherry positive cells (transduced cells) were gated for the analysis. Left panel, histogram from a representative experiment after LCK-depletion is shown. Right panel, data represent mean ± SEM (n=4 independent experiments). RCH-ACV cells transduced with shRNAs for FYN or BCL6 genes served as controls. MFI, median fluorescence intensity. Statistical analysis by Student's t-test, *** p-value <0.001, * p-value<0.05, n.s. not significant.
Figure 5
Figure 5. Pharmacological inhibition of signaling pathways upstream of PLCγ2 in E2A-PBX1 leukemias
(A) Bars denote relative pPLCγ2 levels determined by phospho-flow after incubation of human RCH-ACV and SEM leukemia cell lines with the indicated compounds. Data represent mean ± SEM (n=3 independent experiments). Statistical analysis by Mann Whitney U test. * p-value<0.05. MFI, median fluorescence intensity. (B) Half maximal inhibitory concentration (IC50) of compounds targeting PLCγ2 upstream signaling pathways are shown for E2A-PBX1+/preBCR+ (n=3) and E2A-PBX1+/preBCR- (n=3) mouse leukemias in colony forming assays. No differences were found regarding pPLCγ2 or Zap70 status. Statistical analysis was performed using F test comparing titration curve of each compound. * p-value <0.05. (C) Images show number and morphology of colonies from preBCR+ and preBCR- mouse leukemia cells treated with p505-15 (SYKi, upper panel) and A770041 (LCKi, lower panel) (original magnification 4×). (D) Dose response curves of preBCR+ (n=3) and preBCR- (n=3) mouse leukemia cells treated with p505-15 (upper panel) and A770041 (lower panel) in colony forming assays. Statistical analysis performed by F test. (E) Kaplan-Meier curve shows disease-free survival after secondary bone marrow transplantation of mouse preBCR+ leukemia cells (n=5 in each cohort) and treatment with P505-15 (upper panel) and A770041 (lower panel), for 21 days. Statistical analysis was performed using the log-rank (Mantel-Cox) test.
Figure 6
Figure 6. Genetic interactions among E2A-PBX1 target genes reveal effective combination therapies
(A) Upper panel, western blot shows the expression of indicated proteins. GAPDH was used as loading control. Lower panel, cell concentration of shRNA transduced cells relative to control transduced cells (shLuc) 5 days after sorting. Cell numbers were quantified by trypan blue exclusion assay. Data represent mean ± SEM (n=4 independent experiments). Statistical analysis by Student's t-test. (B) Dot plots show the proportion of GFP+ and mCherry+ cells at day 18 in flow cytometry from a representative experiment in which RCH-ACV cells were transduced with shRNA for luciferase (GFP) or ZAP70 (mCherry) and mixed 50/50 at day 0. Cells were cultured in the presence of vehicle or A770041 (500 nM) for 18 days. (C) Diagrams showing % of mCherry+ cells transduced from foregoing experiment and treated with the indicated compounds for 18 days: dasatinib (20 nM), R406 (500 nM) and A770041 (500 nM). Data represent mean ± SEM (n=3 independent experiments).
Figure 7
Figure 7. Preclinical efficacy of combination treatment with small molecules in preBCR+ E2A-PBX1+ leukemias
(A) Images show number and morphology of colonies from RCH-ACV cells treated with p505-15 and either vehicle or A770041 in combination (original magnification 4×). (B) Titration growth curves for RCH-ACV and SEM cells cultured in increasing concentrations of p505-15 in combination with either vehicle or A770041 (1μM) (left panel) and increasing concentrations of dasatinib with either vehicle or p505-15 (2 μM) (right panel). Colonies were enumerated after 14 days. Data represent mean ± SEM (n=3 independent experiments). CFU, colony forming units. (C) Titration curves are shown for mouse preBCR+ (n=3) and preBCR- (n=3) leukemia cells cultured in increasing concentrations of p505-15 in combination with either vehicle or A770041 (200 nM). (D) Titration curves are shown for mouse preBCR+ (n=3) and preBCR- (n=3) leukemia cells cultured in methylcellulose at increasing concentrations of dasatinib in combination with either vehicle or p505-15 (50 nM). Colonies were enumerated after 7 days. Statistical analysis performed in (B), (C) and (D) by F test, *** p-value<0.001, ** p-value<0.01. (E) Schematic representation of signaling network remodeling by E2A-PBX1+ in pre-BCR+ ALLs.

Similar articles

Cited by

References

    1. Geng H, Hurtz C, Lenz KB, Chen Z, Baumjohann D, Thompson S, et al. Self-enforcing feedback activation between BCL6 and pre-B cell receptor signaling defines a distinct subtype of acute lymphoblastic leukemia. Cancer Cell. 2015;27(3):409–25. - PMC - PubMed
    1. Köhrer S, Havranek O, Seyfried F, Hurtz C, Coffey GP, Kim E, et al. PreBCR signaling in precursor B-cell acute lymphoblastic leukemia regulates PI3K/AKT, FOXO1 and MYC, and can be targeted by SYK inhibition. Leukemia. 2016 (in press) - PMC - PubMed
    1. Pui CH, Sandlund JT, Pei D, Campana D, Rivera GK, Ribeiro RC, et al. Improved outcome for children with acute lymphoblastic leukemia: results of Total Therapy Study XIIIB at St Jude Children's Research Hospital. Blood. 2004;104(9):2690–6. - PubMed
    1. Moorman AV, Harrison CJ, Buck GA, Richards SM, Secker-Walker LM, Martineau M, et al. Karyotype is an independent prognostic factor in adult acute lymphoblastic leukemia (ALL): analysis of cytogenetic data from patients treated on the Medical Research Council (MRC) UKALLXII/Eastern Cooperative Oncology Group (ECOG) 2993 trial. Blood. 2007;109(8):3189–97. - PubMed
    1. Duque-Afonso J, Feng J, Scherer F, Lin CH, Wong SH, Wang Z, et al. Comparative genomics reveals multistep pathogenesis of E2A-PBX1 acute lymphoblastic leukemia. J Clin Invest. 2015;125(9):3667–80. - PMC - PubMed

Publication types

MeSH terms

Substances