. 2016 Oct;28(10):2385-2397.
doi: 10.1105/tpc.16.00456. Epub 2016 Oct 7.

Genome-Wide Mapping of Uncapped and Cleaved Transcripts Reveals a Role for the Nuclear mRNA Cap-Binding Complex in Cotranslational RNA Decay in Arabidopsis

Affiliations

Genome-Wide Mapping of Uncapped and Cleaved Transcripts Reveals a Role for the Nuclear mRNA Cap-Binding Complex in Cotranslational RNA Decay in Arabidopsis

Xiang Yu et al. Plant Cell. 2016 Oct.

Abstract

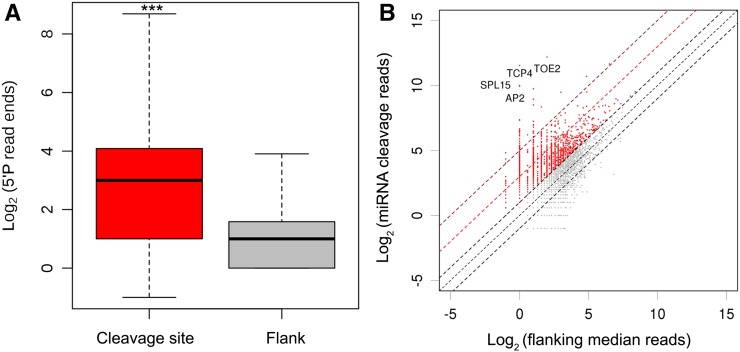
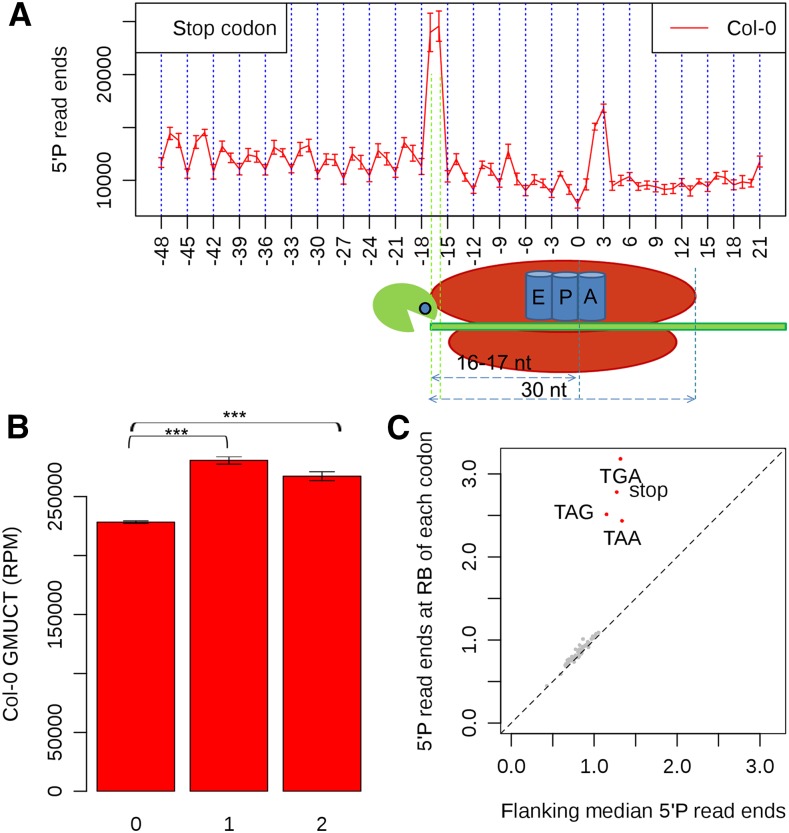
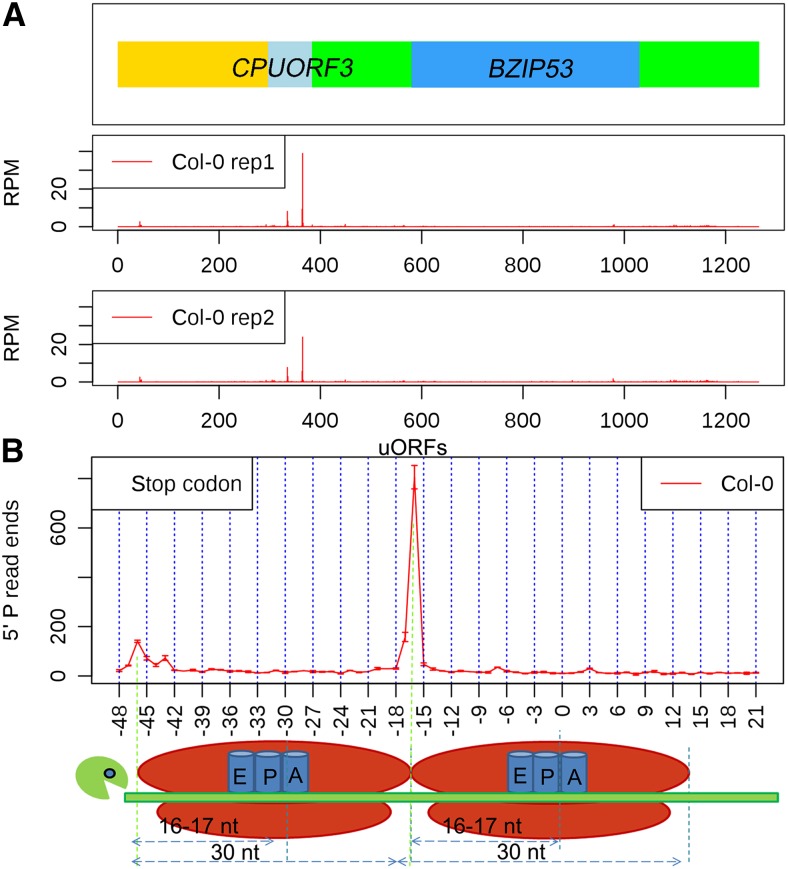
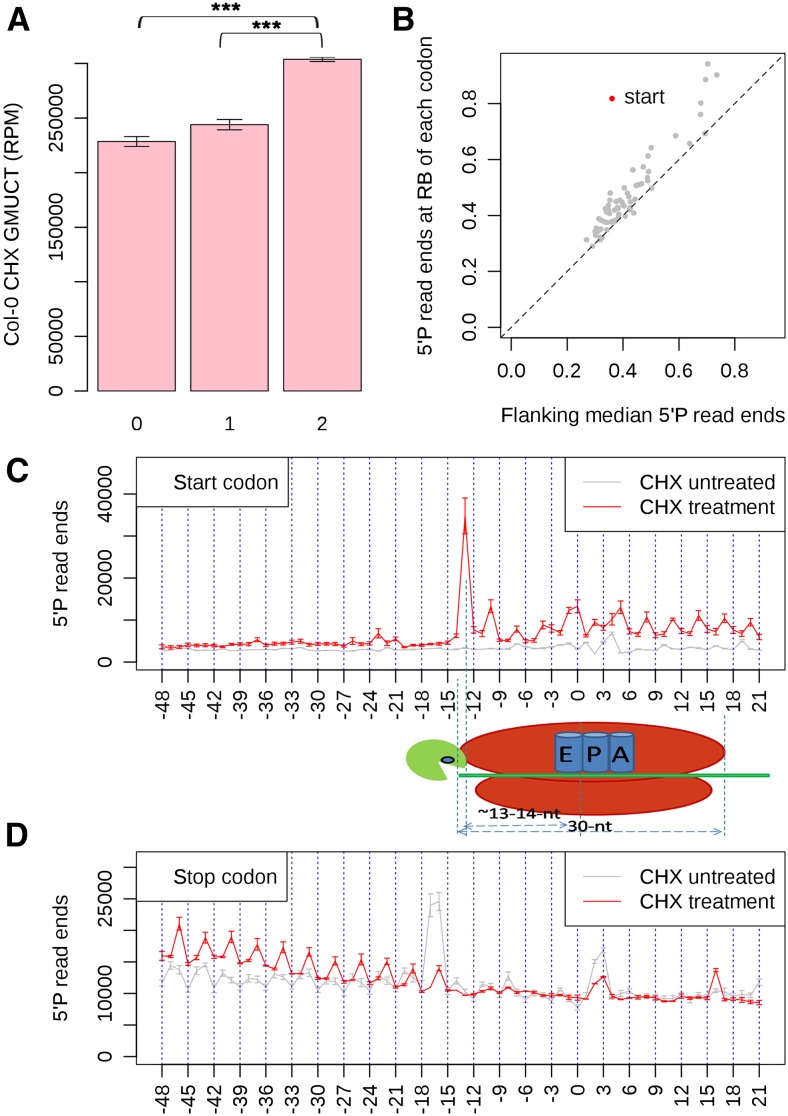
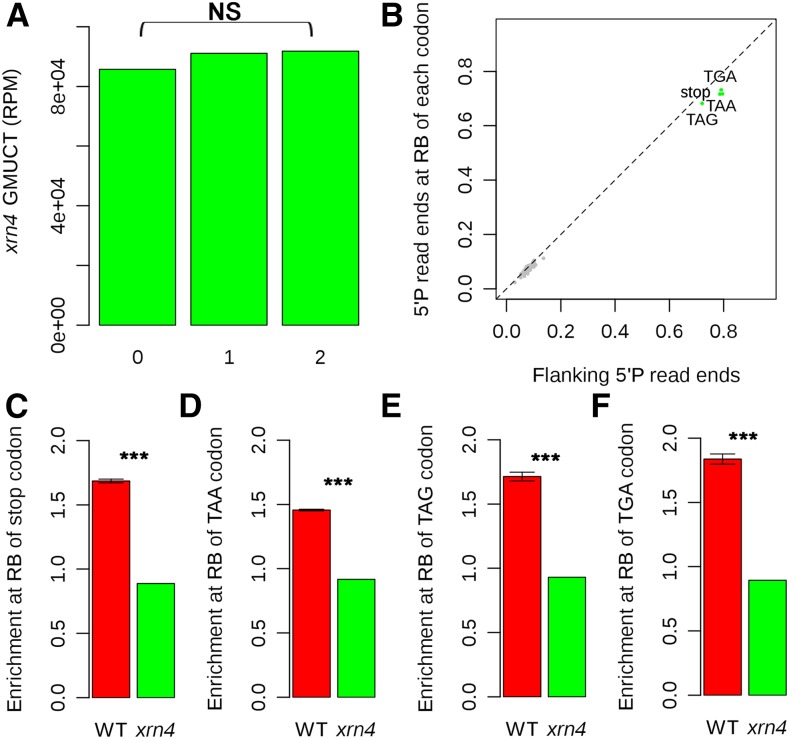
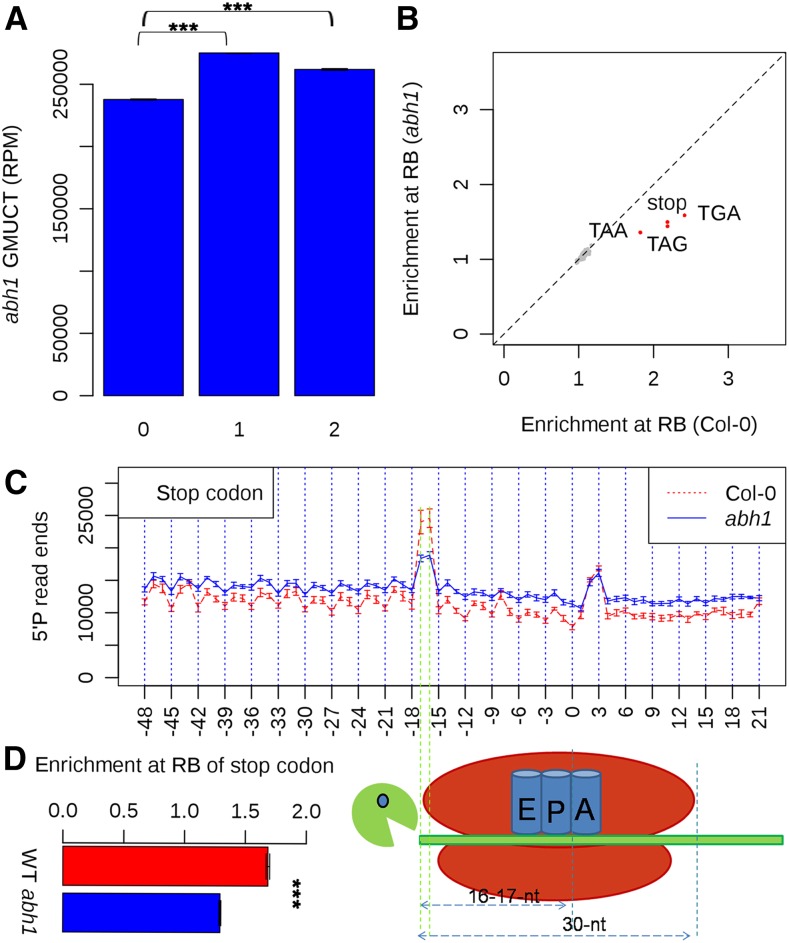
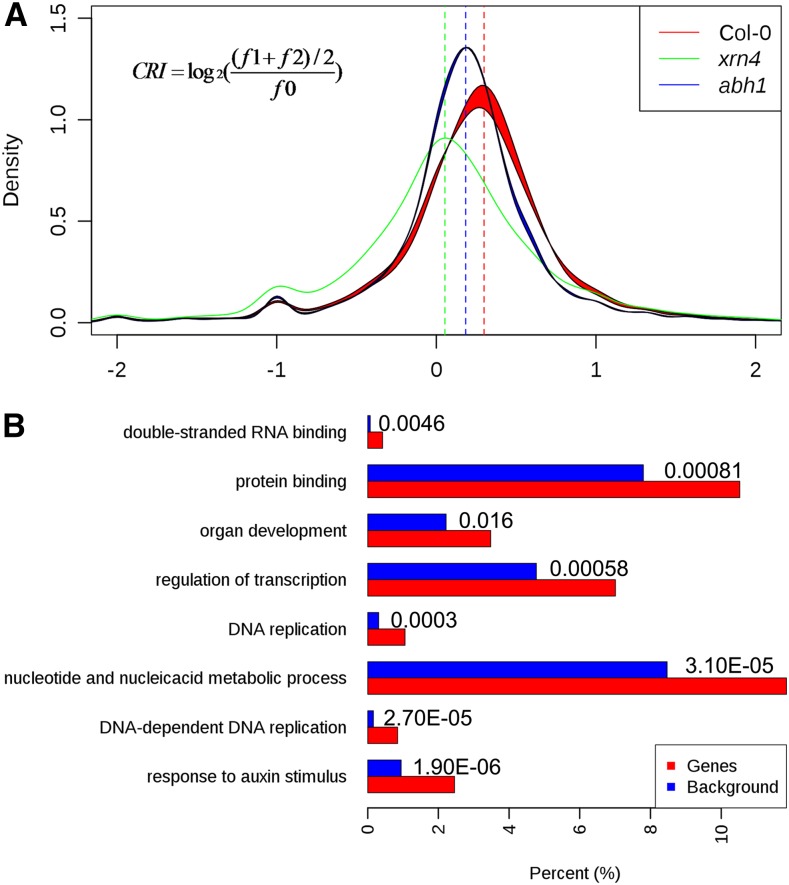
RNA turnover is necessary for controlling proper mRNA levels posttranscriptionally. In general, RNA degradation is via exoribonucleases that degrade RNA either from the 5' end to the 3' end, such as XRN4, or in the opposite direction by the multisubunit exosome complex. Here, we use genome-wide mapping of uncapped and cleaved transcripts to reveal the global landscape of cotranslational mRNA decay in the Arabidopsis thaliana transcriptome. We found that this process leaves a clear three nucleotide periodicity in open reading frames. This pattern of cotranslational degradation is especially evident near the ends of open reading frames, where we observe accumulation of cleavage events focused 16 to 17 nucleotides upstream of the stop codon because of ribosomal pausing during translation termination. Following treatment of Arabidopsis plants with the translation inhibitor cycloheximide, cleavage events accumulate 13 to 14 nucleotides upstream of the start codon where initiating ribosomes have been stalled with these sequences in their P site. Further analysis in xrn4 mutant plants indicates that cotranslational RNA decay is XRN4 dependent. Additionally, studies in plants lacking CAP BINDING PROTEIN80/ABA HYPERSENSITIVE1, the largest subunit of the nuclear mRNA cap binding complex, reveal a role for this protein in cotranslational decay. In total, our results demonstrate the global prevalence and features of cotranslational RNA decay in a plant transcriptome.


Figures

Figure 1.
Figure 1.
GMUCT Provides a Global View of miRNA Target Site Cleavage Efficiency. (A) Accumulation of 5′P read ends at miRNA target sites. The top of the rectangle indicates the top of the third quartile, and the bottom of the rectangle indicates the bottom of the first quartile. The horizontal bold line near the middle of the rectangle indicates the median value of two biological replicates. The vertical line extending from the top of the rectangle indicates the maximum value, and another vertical line extending from the bottom of the rectangle indicates the minimum value. (B) Cleavage efficiency of miRNA target sites. The four transcripts (AP2, SPL15, TOE2, and TCP4) with the most efficiently cleaved miRNA target sites are listed. The rest of the identified miRNA target sites (red dots) with efficient miRNA-directed cleavage can be found in Supplemental Data Set 1.
Figure 2.
Figure 2.
5′P Read Ends Accumulate at The Ribosome Boundary Site of mRNA ORF Stop Codons and Show a 3-Nucleotide Periodicity Pattern throughout ORFs. (A) The distribution of 5′P read ends relative to stop codons. The first nucleotide of the stop codon is numbered 0 in all detectable mRNA ORFs. The illustration below the graph shows the 5′ ribosome boundary site when the ribosome has an mRNA stop codon in its A site. (B) A 3-nucleotide periodicity of 5′P read ends is evident in Arabidopsis mRNA ORFs. Asterisks denote a significant difference at a P value < 2.2 × 10−100 as determined by a χ2 test. Error bars represent se of the mean for two biological replicates. (C) Enrichment of 5′P read ends at the ribosome boundary (16 and 17 nucleotides upstream) of mRNA stop codons. Red dots denote codons with significant enrichment of 5′P read ends at their ribosome boundary sites, while gray dots denote codons that are not significant for this value. Significance was assessed using a χ2 test.
Figure 3.
Figure 3.
Accumulation of 5′P Read Ends at the Ribosome Boundary Site Upstream of uORF Stop Codons. (A) An uORF example (CPUORF3 in the 5′ UTR of BZIP53) that shows accumulation of 5′P read ends at the ribosome boundary of the CPUORF3 stop codon in the two boxes below the transcript model. In the transcript model, the yellow rectangle represents the 5′ UTR upstream of CPUORF3, the light-blue box represents the ORF of CPUORF3, the intervening green box represents the rest of the 5′ UTR before the BZIP53 ORF (blue box), and the last green box represents the 3′ UTR of this transcript. (B) The distribution of 5′P read ends relative to stop codons (first nucleotide of the stop codon is numbered 0) in all detectable TAIR10 annotated uORFs. The illustration below the graph shows how the two tandem ribosomes pausing at the termination site (stop codon in the A site) gives 5′P read end peaks 16 and 17 nucleotides upstream of the stop codon and secondary peaks 46 and 47 nucleotides upstream of the stop codon.
Figure 4.
Figure 4.
5′P Read Ends Accumulate at the Ribosome Boundary Site of mRNA ORF Start Codons and Show a 3-Nucleotide Periodicity Pattern throughout ORFs in Col-0 Leaf Tissue Treated with the Translation Inhibitor CHX. (A) A 3-nucleotide periodicity pattern of 5′P read ends is evident in Arabidopsis mRNA ORFs after treatment of Col-0 leaf tissue with CHX. Asterisks denote a significant difference at a P value < 2.2 × 10 to 100 as determined by a χ2 test. Error bars represent se of the mean for two biological replicates. (B) The average number of 5′P read ends found at the ribosome boundary (16 and 17 nucleotides upstream) of each codon compared with the median coverage in the 50 nucleotide up and downstream. Red dots denote the codons with significant enrichment of 5′P read ends at their ribosome boundary site, while gray dots denote codons that are not significant for this value. Significance was assessed using a χ2 test. (C) The distribution of 5′P read ends relative to start codons (first nucleotide of the start codon is numbered 0) in all detectable mRNA ORFs. The illustration shows how the ribosome boundary of an initiating ribosome during CHX treatment (start codon in the P site) gives 5′P read end peaks ∼13 nucleotides upstream of the start codon P site. The gray line is the distribution of 5′P read ends relative to start codons in Col-0 without CHX treatment. (D) The distribution of 5′P read ends relative to stop codons (the first nucleotide of the stop codon is numbered 0) in all detectable mRNA ORFs. The gray line denotes the distribution of 5′P read ends relative to stop codons in Col-0 without CHX treatment.
Figure 5.
Figure 5.
XRN4 Is the 5′ to 3′ Exoribonuclease Required for Cotranslational mRNA Decay in Arabidopsis. (A) The 3-nucleotide periodicity pattern of 5′P read ends is no longer evident in Arabidopsis mRNA ORFs in GMUCT data from xrn4-5 mutant unopened flower buds. NS denotes no significant difference as determined by a χ2 test. (B) The average number of 5′P read ends found at the ribosome boundary (16 and 17 nucleotides upstream) of each codon compared with the median coverage in the 50 nucleotides up- and downstream. The green dots are codons showing significantly less of an enrichment of 5′P read ends at the ribosome boundary site in GMUCT data from xrn4 mutant compared with wild-type Col-0, and gray dots are other codons. Significance was assessed using a χ2 test. (C) to (F) The enrichment of 5′P read ends at the RB site of all stop codons (C), TAA (D), TAG (E), and TGA (F) compared with median coverage in the 50 nucleotides up- and downstream in Col-0 compared with xrn4-5 mutant unopened flower buds. Asterisks denote a significant difference at a P value < 2.2 × 10 to 100 as determined by a χ2 test. Error bars represent se of the mean for two biological replicates.
Figure 6.
Figure 6.
The Nuclear mRNA Cap Binding Complex Functions in Cotranslational RNA Decay in Arabidopsis. (A) A 3-nucleotide periodicity pattern of 5′P read ends is evident in Arabidopsis mRNA ORFs in abh1 mutant unopened flower buds. Asterisks denote a significant difference at a P value < 2.2 × 10 to 100 as determined by a χ2 test. Error bars represent se of the mean for two biological replicates. (B) The average number of 5′P read ends found at the ribosome boundary (16 and 17 nucleotides upstream) of each codon compared with the median coverage in the 50 nucleotides up- and downstream in the abh1 mutant compared with Col-0 unopened flower buds. The red dots are codons showing significantly less of an enrichment of 5′P read ends at the ribosome boundary site in GMUCT data from the abh1 mutant compared with wild-type Col-0, and gray dots are other codons. (C) The distribution of 5′P read ends relative to stop codons in all detectable mRNA ORFs in Col-0 compared with abh1 mutant unopened flower buds. The first nucleotide of the stop codon is numbered 0. (D) The enrichment of 5′P read ends at the RB site of all stop codons compared with median coverage in the 50 nucleotides up- and downstream in Col-0 compared with abh1 mutant unopened flower buds. Asterisks denote a significant difference at a P value < 2.2 × 10 to 100 as determined by a χ2 test. Error bars represent se of the mean for two biological replicates.
Figure 7.
Figure 7.
The Levels of Cotranslational RNA Decay Vary between Col-0, xrn4, and abh1. (A) Histogram of cotranslational RNA decay index values as determined for Col-0 (red line), xrn4 (green line), and abh1 (blue line). The loss of XRN4 almost entirely abolishes cotranslational RNA decay in Arabidopsis, whereas the absence of ABH1 has a more intermediate effect on this process in Arabidopsis. (B) GO analysis of the group of transcripts with a cotranslational RNA decay index value higher than 1. The length of each bar in the graph is the enrichment ratio of each GO term for genes giving rise to transcripts with high CRI (red bars) or a background control set (blue bars). The value specified for each set of bars is the FDR of enrichment for each denoted GO term in high CRI genes compared with the background control set.

Comment in

Similar articles

Cited by

References

    1. Addo-Quaye C., Eshoo T.W., Bartel D.P., Axtell M.J. (2008). Endogenous siRNA and miRNA targets identified by sequencing of the Arabidopsis degradome. Curr. Biol. 18: 758–762. - PMC - PubMed
    1. Aukerman M.J., Sakai H. (2003). Regulation of flowering time and floral organ identity by a MicroRNA and its APETALA2-like target genes. Plant Cell 15: 2730–2741. - PMC - PubMed
    1. Chekanova J.A., et al. (2007). Genome-wide high-resolution mapping of exosome substrates reveals hidden features in the Arabidopsis transcriptome. Cell 131: 1340–1353. - PubMed
    1. Chen X. (2004). A microRNA as a translational repressor of APETALA2 in Arabidopsis flower development. Science 303: 2022–2025. - PMC - PubMed
    1. Chiba Y., Green P. (2009). mRNA degradation machinery in plants. J. Plant Biol. 52: 114–124.

Publication types

MeSH terms