. 2016 Oct 19:7:13176.
doi: 10.1038/ncomms13176.

SIKs control osteocyte responses to parathyroid hormone

Affiliations

SIKs control osteocyte responses to parathyroid hormone

Marc N Wein et al. Nat Commun. .

Erratum in

  • Corrigendum: SIKs control osteocyte responses to parathyroid hormone.
    Wein MN, Liang Y, Goransson O, Sundberg TB, Wang J, Williams EA, O'Meara MJ, Govea N, Beqo B, Nishimori S, Nagano K, Brooks DJ, Martins JS, Corbin B, Anselmo A, Sadreyev R, Wu JY, Sakamoto K, Foretz M, Xavier RJ, Baron R, Bouxsein ML, Gardella TJ, Divieti-Pajevic P, Gray NS, Kronenberg HM. Wein MN, et al. Nat Commun. 2017 Feb 22;8:14745. doi: 10.1038/ncomms14745. Nat Commun. 2017. PMID: 28224982 Free PMC article. No abstract available.

Abstract

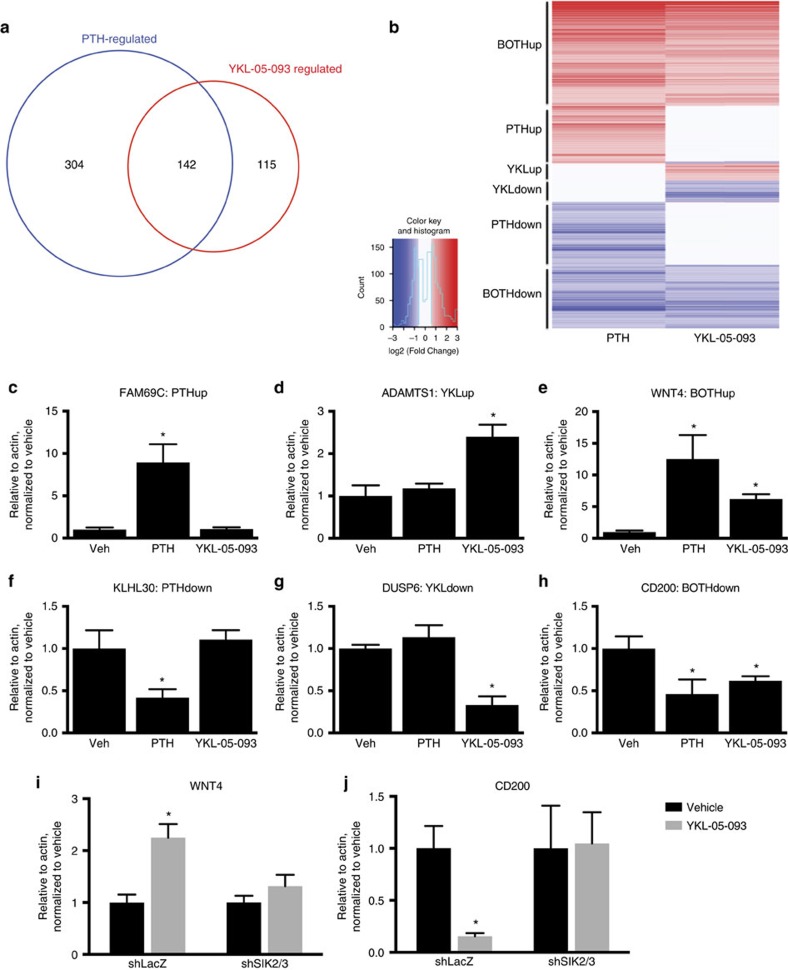
Parathyroid hormone (PTH) activates receptors on osteocytes to orchestrate bone formation and resorption. Here we show that PTH inhibition of SOST (sclerostin), a WNT antagonist, requires HDAC4 and HDAC5, whereas PTH stimulation of RANKL, a stimulator of bone resorption, requires CRTC2. Salt inducible kinases (SIKs) control subcellular localization of HDAC4/5 and CRTC2. PTH regulates both HDAC4/5 and CRTC2 localization via phosphorylation and inhibition of SIK2. Like PTH, new small molecule SIK inhibitors cause decreased phosphorylation and increased nuclear translocation of HDAC4/5 and CRTC2. SIK inhibition mimics many of the effects of PTH in osteocytes as assessed by RNA-seq in cultured osteocytes and following in vivo administration. Once daily treatment with the small molecule SIK inhibitor YKL-05-099 increases bone formation and bone mass. Therefore, a major arm of PTH signalling in osteocytes involves SIK inhibition, and small molecule SIK inhibitors may be applied therapeutically to mimic skeletal effects of PTH.


Conflict of interest statement

Y.L. and N.G. are co-inventors of YKL-04-114, YKL-05-093 and YKL-05-099. H.M.K. receives grant support from Amgen, and has received consulting honorariums from Amgen and Novartis. M.B. receives grant support from Amgen and Merck, and serves on scientific advisory boards for Merck and Eli Lilly. T.S., R.X., H.M.K., and M.N.W. declare that patents have been filed for the therapeutic application of SIK inhibitors. The remaining authors declare no competing financial interests.

Figures

Figure 1
Figure 1. HDAC4 and HDAC5 control osteocyte biology in vivo.
(a) Endogenous MEF2C was immunoprecipitated from Ocy454 cells, followed by immunoblotting for the indicated proteins. Data shown are representative of n=3 independent experiments. (b) Osteocyte density in cortical bone 3 mm below the growth plate. 4–5, 8 week old male mice per genotype was analysed, *indicates P<0.01 versus WT by student's unpaired two tailed t-test. (c) Representative H+E section demonstrating increased osteocyte density and disorganized cortical bone in DKO (HDAC4f/f; HDAC5−/−;DMP1-Cre) mice. Scale bar, 40 μm. (d) Sections were stained with Sirius Red and analysed under polarized light to view collagen fibre organization. Disorganized collagen fibers are only seen in DKO sections. Scale bar, 40 μm. Error bars indicate s.e.m for all figures.
Figure 2
Figure 2. Class IIa HDACs are required for PTH-induced SOST suppression in vitro.
(a) Ocy454 cells were transfected with GFP-HDAC5 and then treated with PTH (50 nM) for the indicated times. Cytosolic (c) and nuclear (n) lysates were prepared and immunoblotted as indicated. (b) Ocy454 cells were treated with PTH (50 nM) for 30 min. Whole cell lysates were prepared and immunoblotted as indicated. Similar results were observed in four independent experiments. (c) Ocy454 cells with (WT, clone 17) and without (Null, clone 8) Gsα were treated with PTH (50 nM for 30 min) and analysed as in (a). (d) Ocy454 cells with (WT) and without (Null) Gsα were treated with either PTH (50 nM) or forskolin (5 μg ml−1) for 30 min and analysed as in b. (e) Ocy454 cells were exposed to the indicated combinations of HDAC4-targeting sgRNAs (with Cas9) and HDAC5 shRNA-expressing lentiviruses, and whole cell lysates were analysed by immunoblotting as indicated. (f) WT, HDAC5 shRNA, HDAC4 KO and DKO Ocy454 cells were treated with PTH (1 nM) for 4 h, and SOST (left) and RANKL (right) mRNA transcript abundance was measured by RT-qPCR. For all cell culture experiments therein, values represent mean of n=3 biologic replicates. *indicates P<0.05 comparing the effects of PTH to vehicle for each cell line. Error bars represent SEM. (g,h) MEF2C chromatin immunoprecipitation was performed, and enrichment for the +45 kB enhancer determined (relative to control IgG ChIP). *indicates P<0.05 comparing fold enrichment of PTH versus vehicle by student's unpaired two tailed t-test.
Figure 3
Figure 3. Class IIa HDACs are required for PTH-induced SOST suppression in vivo.
(a,b) 6 week old male mice of the indicated genotype were treated with vehicle or PTH (1-34, 300 μg kg−1) and euthanized 90 min later. Bone RNA was obtained and RANKL and SOST transcript abundance was determined by RT-qPCR. * indicates P<0.05 comparing vehicle and PTH for each genotype. N=at least 6 mice per group were analysed. (c) Representative photomicrographs of sclerostin immunohistochemistry from WT and DKO mice treated with vehicle or PTH. Scale bar, 40 μm. (d) Quantification of immunohistochemistry results. Cortical osteocytes in a fixed region of bone 3 mm below the tibial growth plate were counted and scored as either sclerostin-positive or negative. N=6 mice per group were analyzed. * indicates P<0.01 comparing vehicle and PTH for each genotype by student's unpaired two tailed t-test.
Figure 4
Figure 4. SIK2 activity is regulated by PTH signaling.
(a) Ocy454 cells were infected with shRNA-expressing lentiviruses, followed by immunoblotting. (b) Ocy454 cells were treated with vehicle or PTH (50 nM, 30′), followed by immunoblotting. In the bottom panels, SIK3 immunoprecipitation was performed followed by immunoblotting. (c) Ocy454 cells were treated with PTH (50 nM), followed by immunoblotting. (d) Ocy454 cells infected with either control, shSIK2 or shSIK3-expressing lentiviruses were treated with PTH (1 nM) for 4 h. RNA was isolated and CITED1 transcript abundance measured. * indicates P<0.05 comparing vehicle and PTH for each cell line. (e) Control and shSIK2 cells were treated with PTH (50 nM, 30′) and then analysed as in (b). (f,g) Control, shSIK2 and shSIK3 cells were treated as in (d), and SOST and RANKL transcript abundance measured. * indicates P<0.05 comparing vehicle and PTH. (h) Left, control and shSIK2 cells were treated with vehicle, PTH (25 nM) or forskolin (FSK, 5 μg ml−1) for 30 min followed by cAMP radioimmunoassay. Middle/right, cells were treated with PTH (2.5 nM) or forskolin (500 ng ml−1) for 4 h, gene expression was analysed. (i) RNA from femurae of 5 week old male WT (SIK2 f/f) or SIK2OcyKO (SIK2 f/f;DMP1-Cre) mice (n=3 group−1) was isolated and SIK2 and PTH receptor (PPR) transcripts measured by RT-qPCR. * indicates P<0.001 comparing WT and SIK2 cKO mice. (j,k) Mice as in (i) were treated with a single dose of PTH (1 mg kg−1) and killed 2 h later. Expression of CITED1, SOST and RANKL in femur RNA was determined by RT-qPCR. * indicates P<0.05 comparing vehicle and PTH. (l) Ocy454 cells were infected with shRNA-expressing lentiviruses targeting CRTC1, CRTC2, or CRTC3. Cells were then treated with PTH (1 nM, 4 h) and RANKL transcript abundance was measured. (m) Ocy454 cells were treated with vehicle or PTH (20 nM, 60 min) followed by ChIP for CRTC2. DNA was quantified by qPCR using primers detecting the indicated RANKL regions, and data are expressed as fold enrichment versus control IgG. *indicates P<0.05 comparing vehicle and PTH. The −23 kB and −75 kB enhancers correspond to ‘D2' and ‘D5' enhancers.
Figure 5
Figure 5. SIK inhibitors regulate SOST and RANKL expression.
(a) Structure of YKL-04-114 (left), YKL-05-093 (middle) and YKL-05-093 Kd determination curves for SIK2 (right). For the Kd determination curves, the y-axis represents the amount of bound kinase measured by qPCR (see Methods), and the x-axis represents the corresponding compound concentration in nM. (b) Ocy454 cells were treated with YKL-04-114 (10 μM) for the indicated times, followed by immunoblotting of whole cell lysates as indicated. (c) Ocy454 cells were treated with the indicated concentrations of YKL-04-114 for 60 min, followed by immunoblotting of whole cell lysates as indicated. (d) Left: Ocy454 cells were treated with vehicle, PTH (50 nM) or YKL-05-093 (10 μM) for 60 min. Cytosol and nuclear fractions were then generated, followed by immunoblotting as indicated. Right: quantification of nuclear fraction (defined as nuclear/total) of HDAC4 or CRTC2. * indicates P<0.01 comparing treatment versus vehicle. (e) Top: Ocy454 cells were treated with the indicated concentrations of YKL-04-114 for 4 h, followed by RT-qPCR. Bottom: Cells were treated with YKL-04-114 (0.5 μM) for the indicated times. * indicates P<0.05 comparing treatment versus vehicle. (f) Cells lacking SIK2, SIK3 or both were treated with YKL-05-093 (10 μM for 45 min). Quantification of HDAC4 S246 phosphorylation, as assessed by densitometric analysis of immunoblots, is shown. * indicates P<0.01 comparing treatment versus vehicle. # indicates P<0.05 for the same comparison. (g) Control and SIK2/3 deficient cells were treated with YKL-05-093 (0.5 μM) for 4 h and SOST transcript abundance was measured by RT-qPCR. (h) Control and CRTC2 shRNA cells were treated with PTH (1 nM) or YKL-05-093 (0.5 μM) for 4 h and RANKL transcript abundance was measured by RT-qPCR. (i) Control and Gsα-deficient Ocy454 cells were treated with PTH (1 nM), YKL-05-093 (0.5 μM) or forskolin (5 μg ml−1) and SOST and RANKL transcript abundance was determined by RT-qPCR. For (h) and (i), * indicates P<0.05 comparing treatment and vehicle. (j) Control and Gsα-deficient Ocy454 cells were treated with PTH (50 nM), YKL-05-093 (10 μM) or forskolin (5 μg ml−1) for 30 min. Whole cell lysates were generated and immunoblotted as indicated.
Figure 6
Figure 6. YKL-05-093 and PTH similarly affect gene expression.
(a) Venn diagram showing overlap between differentially-expressed genes (fold chance >2, FDR<0.05) determined by RNA-Seq from Ocy454 cells treated with vehicle, PTH (1 nM) or YKL-05-093 (0.5 μM) for 4 h. (b) Heat map showing six different clusters of differentially expressed genes. Each row corresponds to a single differentially expressed gene. Colour coding is with respect to the average log2 (fold change) for each gene comparing treatment to vehicle. Genes were ordered by the strength of the significance of the fold change comparing PTH and vehicle. (ch) Ocy454 cells were treated with vehicle, PTH (1 nM) and YKL-05-093 (0.5 μM) for 4 h, and RT-qPCR was performed for the indicated gene. As described in the text, FAM69C and KLHL30 are regulated by PTH alone, ADAMTS1 and DUSP6 are regulated by YKL-05-093 alone, and WNT4 and CD200 are regulated by both PTH and YKL-05-093. (i,j) Control and SIK2/3-deficient cells were treated with vehicle or YKL-05-093 (0.5 μM) for 4 h, and WNT4 and CD200 transcript abundance determined by RT-qPCR. For all panels, * indicates P<0.05 comparing vehicle and compound or PTH treatment by student's unpaired two tailed t-test.
Figure 7
Figure 7. Effects of YKL-05-093 administration on bone gene expression in vivo.
(a,b) Male mice of 8 week age C57B/6 (n=4 per group) were treated with the indicated dose of YKL-05-093 via intraperitoneal injection. After 2 h, bone RNA was isolated and transcript abundance was measured by RT-qPCR. # indicates P<0.05 versus vehicle and * indicates P<0.01 versus vehicle by student's unpaired two tailed t-test. (c) Left: sclerostin immunohistochemistry was performed 2 h after intraperitoneal injection with either vehicle or YKL-05-093 (20 μmol kg−1). Right: quantification of sclerostin-positive cortical osteocytes, n=4 mice per treatment group, * indicated P<0.01 versus vehicle. Scale bar, 40 μm. (di) Genes regulated by PTH and YKL-05-093 in vitro are also regulated by YKL-05-093 in vivo. Male mice were treated with YKL-05-093 (20 μmol kg−1) and bone RNA collected 2 h later as in a. *indicates P<0.05 versus vehicle.
Figure 8
Figure 8. YKL-05-099 increases bone formation and bone mass in vivo.
(a) Ocy454 cells were treated with the indicated doses of YKL-05-093, YKL-05-099 or PTH for 20 min. Whole cell extracts were generated, followed by immunoblotting. (b) Control or shSIK2/3 Ocy454 cells were treated with YKL-05-093 or YKL-05-099 (1 μM) for 4 h. RNA was prepared, and gene expression analysed by RT-qPCR. Both YKL-05-093 and YKL-05-099 regulate SOST and RANKL expression in control, but not SIK2/3-deficient cells. (c) Male mice of 8 week age (n=5 per group) were treated with a single IP dose of YKL-05-099 (20 μmol kg−1) or vehicle. After 2 h, animals were killed, RNA was prepared from femurs, and gene expression analysed by RT-qPCR. SOST down-regulation was observed in response to YKL-05-099, but the P-value for this difference was 0.105. * indicates P<0.01. (d) Male mice of 8 week age were treated with vehicle (n=8) or YKL-05-099 (n=7, 10 umol kg−1, IP) once daily 5 days per week for 2 weeks. Animals were killed 2 h after the final dose, and RNA from femurs analysed for the indicated genes. BGLAP encodes osteocalcin. * indicated P<0.01 versus vehicle, # indicates P<0.05 versus vehicle. (ek), static and dynamic histomorphometry were performed on the tibia from the same mice as in d. Each data point represents an individual mouse; P-values for each difference are shown on the graph. (l) Representative trichrome-stained photomicrograph showing increased osteoblasts on cancellous bone surfaces from YKL-05-099-treated mice. Scale bar, 20 μm. (m) Dual calcein/demeclocycline images demonstrating increased mineralizing surface in YKL-05-099-treated mice.
Figure 9
Figure 9. Model showing PTH signaling via inhibition of SIK2 in osteocytes.
In the absence of PTH signaling, SIK2 tonically phosphorylates its substrates HDAC4/5 and CRTC2, leading to their cytoplasmic retention via binding to 14-3-3 chaperones. PTH signaling leads to PKA-mediated phosphorylation of SIK2, which inhibits its cellular activity. This in turn reduces phosphorylation of HDAC4/5 and CRTC2, leading to their dephosphorylation by an unknown phosphatase (ppase), and subsequent nuclear translocation. Small molecule SIK inhibitors (YKL-05-093 and YKL-05-099) mimic the effects of PTH by directly blocking SIK2 kinase activity. In the nucleus, HDAC4/5 block MEF2C-driven SOST expression, while CRTC2 enhances CREB-mediated RANKL gene transcription. PTH-induced reductions in sclerostin contribute to increased bone formation, while PTH-induced increases in RANKL drive increased bone resorption.

Comment in

Similar articles

Cited by

References

    1. Harvey N., Dennison E. & Cooper C. Osteoporosis: impact on health and economics. Nat. Rev. Rheumatol. 6, 99–105 (2010). - PubMed
    1. Bonewald L. F. The amazing osteocyte. J. Bone Miner. Res.: Off. J. Am. Soc. Bone Miner. Res. 26, 229–238 (2011). - PMC - PubMed
    1. Nakashima T. et al.. Evidence for osteocyte regulation of bone homeostasis through RANKL expression. Nat. Med. 17, 1231–1234 (2011). - PubMed
    1. Xiong J. et al.. Matrix-embedded cells control osteoclast formation. Nat. Med. 17, 1235–1241 (2011). - PMC - PubMed
    1. Baron R. & Kneissel M. WNT signaling in bone homeostasis and disease: from human mutations to treatments. Nat. Med. 19, 179–192 (2013). - PubMed

Publication types

MeSH terms