. 2016 Oct 19:6:35531.
doi: 10.1038/srep35531.

LncRNA SRA promotes hepatic steatosis through repressing the expression of adipose triglyceride lipase (ATGL)

Affiliations

LncRNA SRA promotes hepatic steatosis through repressing the expression of adipose triglyceride lipase (ATGL)

Gang Chen et al. Sci Rep. .

Abstract

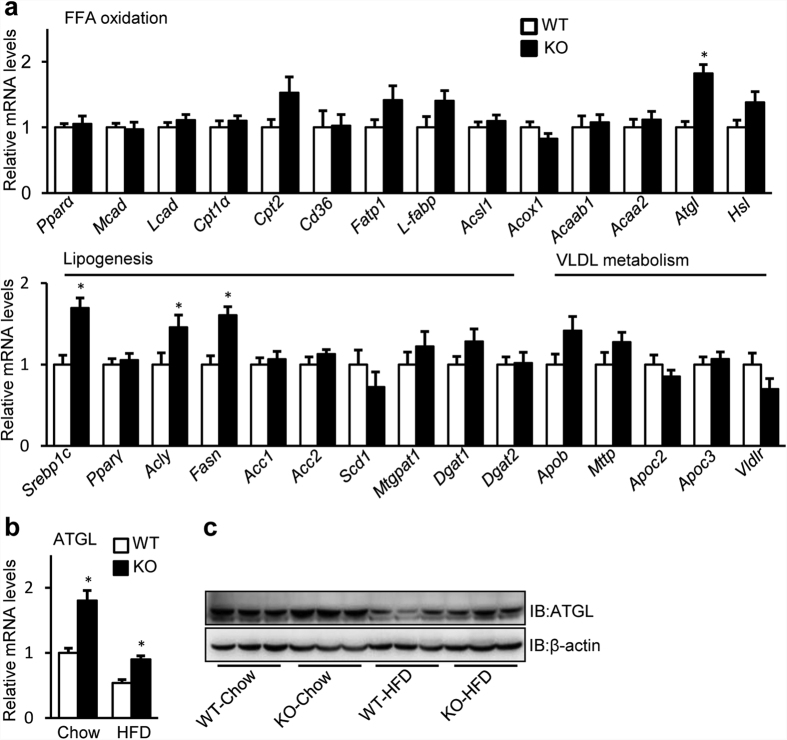
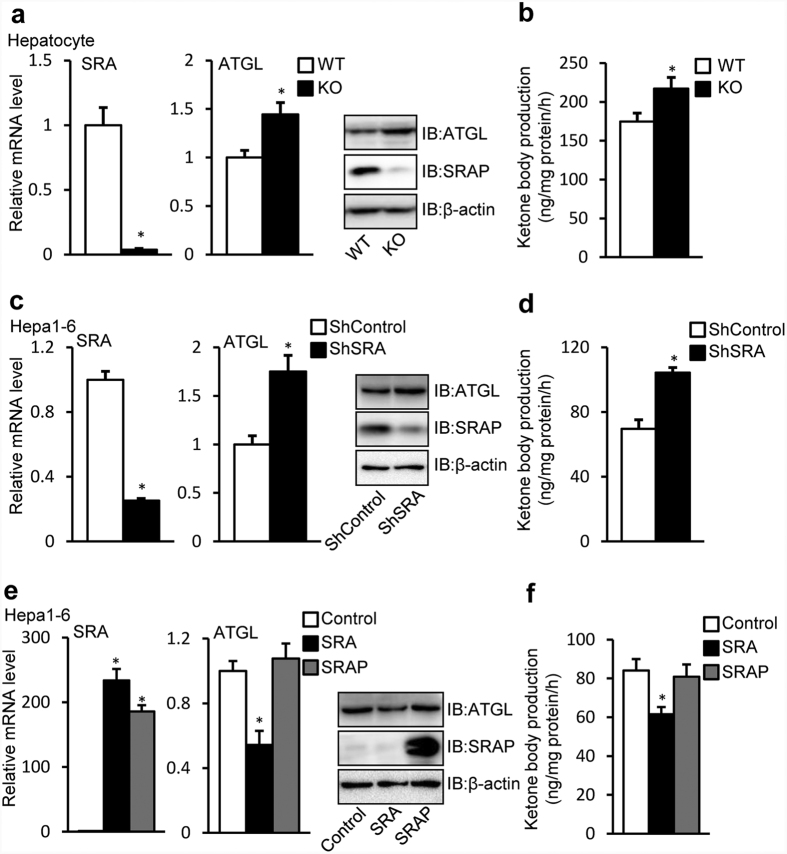
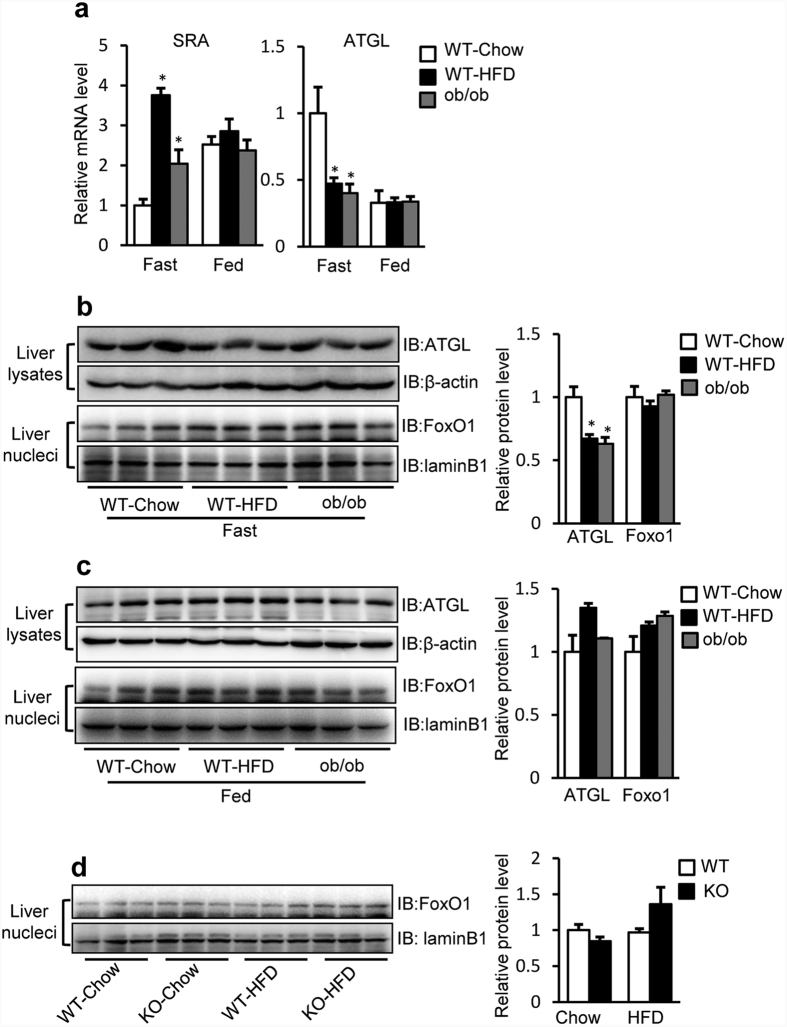
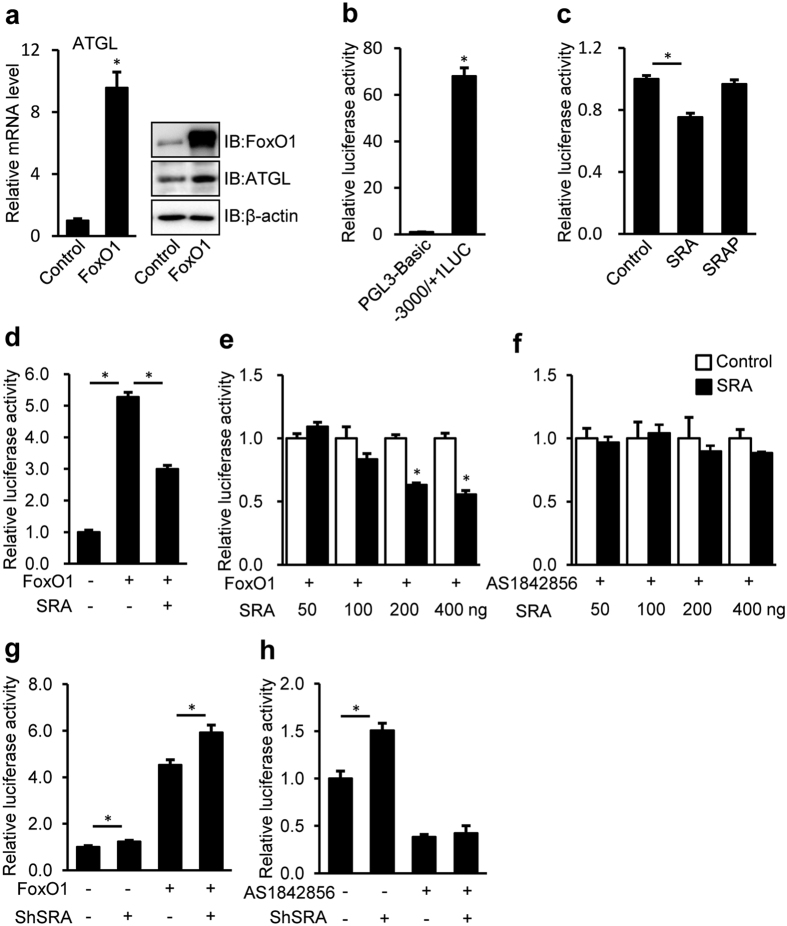
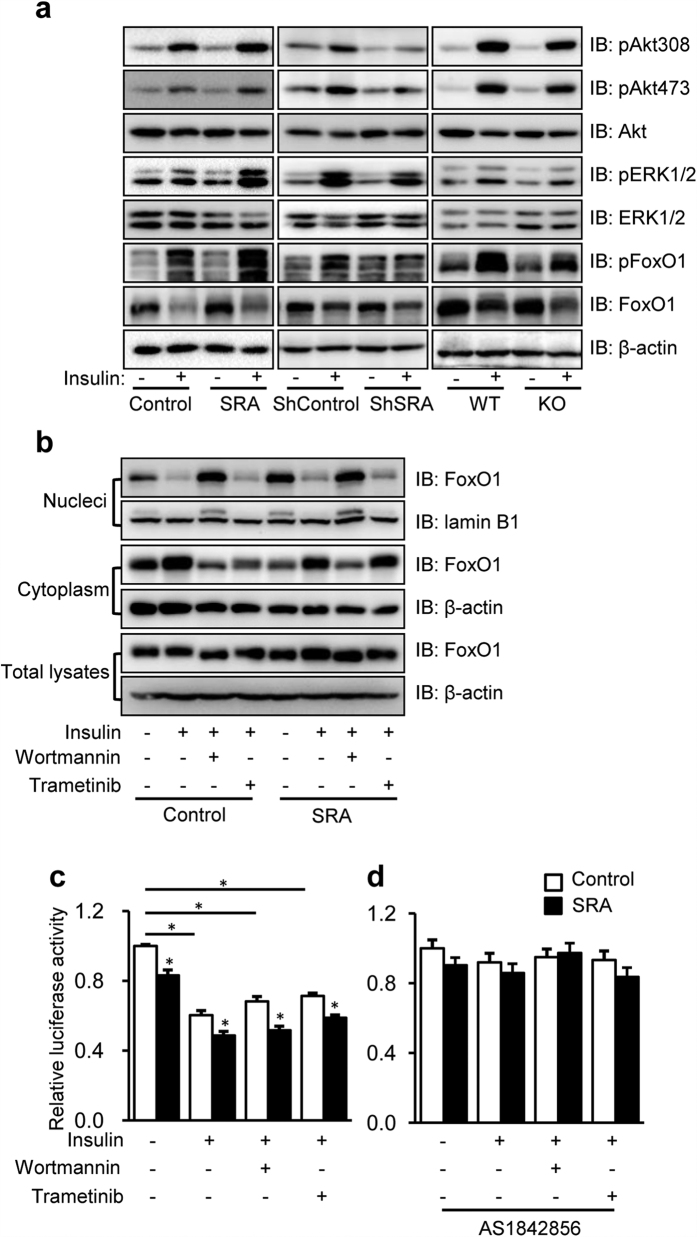
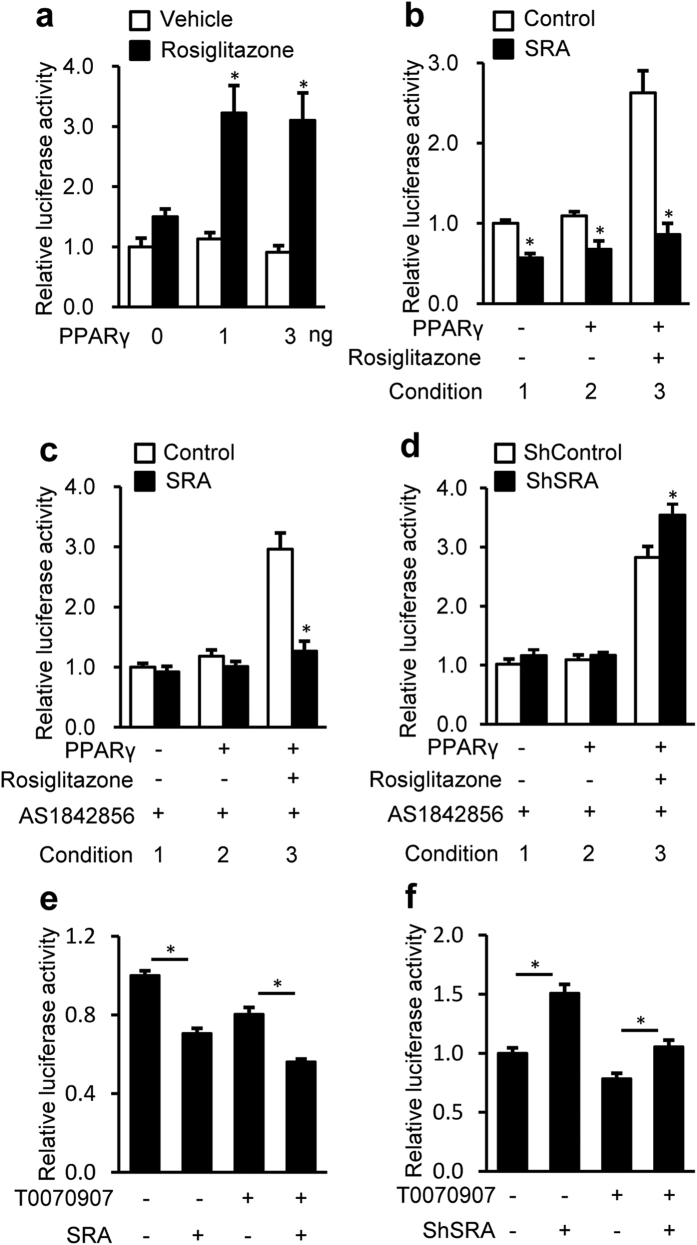
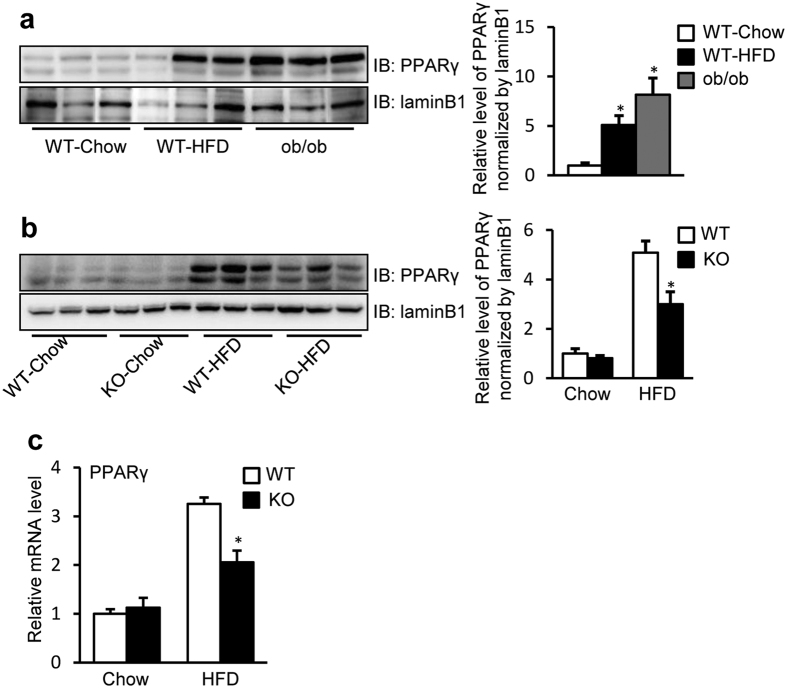
Nonalcoholic fatty liver disease (NAFLD), the most common form of chronic liver disease, manifests as an over-accumulation of hepatic fat. We have recently shown that mice with genetic knockout of a long non-coding RNA (lncRNA) steroid receptor RNA activator (SRA) (SRAKO) are resistant to high fat diet-induced obesity with a phenotype that includes improved glucose tolerance and attenuated hepatic steatosis. The underlying mechanism was investigated in the present study. We found that hepatic levels of SRA and adipose triglyceride lipase (ATGL), a major hepatic triacylglycerol (TAG) hydrolase, were inversely regulated by fasting in mice, and the expression of liver ATGL was induced by SRAKO under normal and high fat diet (HFD) feeding. Loss of SRA in primary hepatocytes or a hepatocyte cell line upregulates, but forced expression of SRA inhibits ATGL expression and free fatty acids (FFA) β-oxidation. SRA inhibits ATGL promoter activity, primarily by inhibiting the otherwise-inductive effects of the transcription factor, forkhead box protein O1 (FoxO1). Our data reveal a novel function of SRA in promoting hepatic steatosis through repression of ATGL expression.


Figures

Figure 1
Figure 1. Loss of SRA increases the hepatic ATGL expression.
(a) RT-qPCR analysis of mRNA expression of FFA oxidation, lipogenesis and VLDL metabolism-related genes in livers of male SRAKO (KO, n = 8) or WT (n = 8) littermates (20 weeks of age) fed with normal chow. (b) Hepatic mRNA level of ATGL in SRAKO (KO, n = 8) or WT (n = 8) littermates (20 weeks of age) fed with normal chow or HFD. The mRNA levels of genes were normalized to 36B4 expression. The data are presented as the mean ± SE and expressed as fold-change relative to the level of WT-Chow. *p < 0.05. (c) Liver lysates from male SRAKO (KO) or WT littermates (20 weeks of age) under different diet conditions were immunoblotted with anti-ATGL and anti-β-actin antibodies.
Figure 2
Figure 2. SRA inhibits FFA oxidation by repressing ATGL expression in hepatocytes.
(a) SRA and ATGL mRNA levels in primary hepatocytes isolated from SRAKO (KO, n = 8) or WT (n = 8) littermates (7–8 weeks of age, chow diet) were analyzed by RT-qPCR. Protein expression of ATGL and SRAP was assessed by immunoblotting. (b) ATGL mediated ketone body production was measured in hepatocytes indicated in (a). (c) Endogenous SRA in Hepa1-6 cells was knocked down by lentiviral infection with shRNA against SRA (shSRA) or scrambled shRNA as control (shControl). Subsequent assays of mRNA and protein expression were performed 72 h after infection. (d) ATGL mediated ketone body production was measured in Hepa1-6 cells with shControl and shSRA knocked down at the same condition as (c). (e) Hepa1-6 cells were transfected with pSCT (Control), pSCT-SRA (SRA) or pSCT-SRAP-SDM1/7 (SRAP) expression vectors, and subsequent assays of RNA and protein expressions were performed 60 h after transfection. (f) ATGL-mediated ketone body production was measured in Hepa1-6 cells described in (e). The mRNA levels of genes were normalized to 36B4 expression. The data are presented as the mean ± SE, *p < 0.05.
Figure 3
Figure 3. Hepatic levels of ATGL and SRA are inversely regulated in mice under fasting conditions.
(a) SRA and ATGL mRNA levels in livers from WT-chow (n = 5) or WT-HFD (n = 6) and ob/ob (n = 8) mice (20 weeks of age) in either fasting or fed conditions were determined by RT-qPCR. The mRNA levels were normalized to 36B4 expression. Data are presented as mean ± SE and expressed as fold-change relative to WT-chow mice. (b,c) Liver or liver nuclear extracts from WT-chow, WT-HFD and ob/ob mice were immunoblotted with anti-FoxO1, anti-ATGL, anti-laminB1 and anti-β-actin antibodies. (b) Mice in fasting condition. (c) Mice in fed condition. (d) Liver nuclear extracts from WT or SRAKO (KO) mice fed with chow or HFD were immunoblotted with anti-FoxO1 and anti-laminB1 antibodies. (b–d) Right panels, quantification of bands in the immunoblots are shown. *p < 0.05.
Figure 4
Figure 4. FoxO1 regulates ATGL expression and SRA inhibits FoxO1-mediated ATGL promoter driven luciferase activity.
(a) Hepa1-6 cells were transfected with FoxO1 or control expression vector (pcDNA3.0). 60 h after transfection, ATGL mRNA expression (normalized to 36B4 expression) was measured by RT-qPCR (left panel) and cell extracts were immunoblotted with anti-FoxO1, anti-ATGL and anti-β-actin antibodies (right panel). (b) HepG2 cells were transfected with either pGL3-Basic empty vector (200 ng) or −3000/+ 1-LUC ATGL construct (200 ng) plus pRL-TK-Renilla (10 ng). (c) pSCT (Control, 200 ng), pSCT-SRA (SRA, 200 ng) or pSCT-SRAP-SDM1/7 (SRAP, 200 ng) were transfected with −3000/+ 1 LUC ATGL (200 ng) plus pRL-TK-Renilla (10 ng) into HepG2 cells. (d) −3000/+ 1 LUC ATGL (200 ng) plus pRL-TK-Renilla (10 ng) was transfected into HepG2 cells without or with FoxO1 (50 ng) and pSCT-SRA (SRA, 200 ng). (e) FoxO1 (50 ng) expression vector and increasing dose of pSCT-SRA as indicated were transfected with −3000/+ 1 LUC ATGL (200 ng) plus pRL-TK-Renilla (10 ng) into HepG2 cells. (f) Increasing doses of pSCT-SRA as indicated were transfected with −3000/+ 1 LUC ATGL (200 ng) plus pRL-TK-Renilla (10 ng) into HepG2 cells. Cells were treated with AS1842856 (1 μM) for 60 h after transfection. (g,h) Endogenous SRA in Hepa1-6 cells was knocked down by lentiviral infection with shRNA against SRA (shSRA) or scrambled shRNA as control (shControl). Subsequent transfection and luciferase assays were performed 12 h and 72 h after infection, respectively. (g) Hepa1-6 cells were transfected with −3000/+ 1 LUC construct (200 ng) plus pRL-TK-Renilla (10 ng) without or with FoxO1 (50 ng). (h) Hepa1-6 cells were cotransfected with −3000/+ 1 LUC ATGL (200 ng) plus pRL-TK-Renilla (10 ng) without or with AS1842856 (1 μM) treatment for 60 h after transfection. ATGL promoter driven luciferase activity were normalized to Renilla luciferase activity, presented as mean ± SE. Data are expressed as fold-change relative to the level of control. *p < 0.05.
Figure 5
Figure 5. SRA promotes insulin-simulated phosphorylation of Akt, ERK1/2 and FoxO1, and inhibits ATGL transcription in an insulin-independent manner.
(a) Left panel: Hepa1-6 cells were transfected with pSCT (Control) or pSCT-SRA (SRA) expression vectors and then cultured for 60 h; middle panel: Hepa1-6 cells were infected with lentivirus of scrambled shRNA (ShContronl) or shRNA against SRA (ShSRA) and then cultured for 72 h; right panel: Primary hepatocytes were isolated from SRAKO mice (KO) or WT littermates and cultured for 16 h. Cells were serum-starved for 5 h followed by treatment with or without insulin (10 nM) for 5 min. Afterwards, cell extracts were immunoblotted with the indicated antibodies. (b) Hepa1-6 cells were transfected with SRA or Control plasmids and then cultured for 60 h. After 5 h serum-starvation, cells were pretreated by MG132 (50 μM) with or without wortmannin (1 μM) or trametinib (1 μM) for 30 min, and finally treated with or without insulin (10 nM) for 5 min before harvesting. Then, proteins extracted from the nucleus, cytoplasm or cell lysates were immunoblotted with indicated antibodies. (c,d) HepG2 cells were cotransfected by −3000/+ 1 LUC ATGL (200 ng) plus pRL-TK-Renilla (10 ng) with either pSCT-SRA or control expression vectors (200 ng). Cells were treated without (c) or with (d) AS1842856 (1 μM) immediately after transfection. 36 h later, cells were serum starved and treated with wortmannin (1 μM) or trametinib (1 μM) plus insulin (10 nM) for further 24 h-culture. ATGL promoter driven luciferase activity were normalized to Renilla luciferase activity and presented as mean ± SE. Data are expressed as fold-change relative to the level of control. *p < 0.05.
Figure 6
Figure 6. SRA inhibits PPARγ-mediated ATGL promotor driven luciferase activity.
Cells were transfected with −3000/+ 1-LUC ATGL construct (200 ng) and pRL-TK-Renilla (10 ng). (a–d) PPARγ expression vector was cotransfected. 36 h after transfection, cells were treated with rosiglitazone (1 μM) for 24 h before harvesting. (a) HepG2 cells were transfected by PPARγ expression vector with the dose indicated. (b) pSCT-SRA or control expression vector (200 ng) plus PPARγ expression vector (3 ng) were transfected into HepG2 cells. (c) Similar to (b), except with AS1842856 (1 μM) treatment immediately after transfection. (d) Hepa1-6 cells were infected with shRNA against SRA (shSRA) or scrambled shRNA as control (shControl). 12 h later, PPARγ expression vector (3 ng) was transfected into Hepa1-6 cells. AS1842856 (1 μM) treatment was started immediately after transfection. Subsequent luciferase assays were performed 72 h after infection. (e) HepG2 cells were transfected by pSCT-SRA or control expression vector (200 ng), followed by T0070907 (0.4 μM) treatment immediately after transfection. 60 h later, cells were harvested for luciferase assay. (f) Hepa1-6 cells were infected with shRNA against SRA (shSRA) or scrambled shRNA as control (shControl). 12 h later, cells were treated with T0070907 (0.4 μM) for 60 h before harvesting. ATGL promoter driven luciferase activity were normalized to Renilla luciferase activity and presented as mean ± SE. Data are expressed as fold-change relative to the level of control. *p < 0.05.
Figure 7
Figure 7. SRA promotes the expression of PPARγ.
Animals were fasted for 16 h before sacrifice. (a) Liver nuclear extracts from male WT mice fed with chow diet or HFD, and ob/ob mice fed with chow diet (20 weeks of age), were immunoblotted with anti-PPARγ or anti-laminB1 antibodies. (b) Liver nuclear extracts from male WT or SRAKO (KO) mice fed with chow diet or HFD (20 weeks of age), were immunoblotted with anti-PPARγ and anti-laminB1 antibodies. (c) mRNA levels of PPARγ in livers of male SRAKO (KO, n = 8) or WT (n = 8) littermates (20 weeks of age) fed with normal chow or HFD. Quantification of bands and their relative intensities are shown in the right panel. Data are presented as mean ± SE and expressed as fold-change relative to the level of chow-fed WT mice. *p < 0.05.

References

    1. Marchesini G. et al.. Nonalcoholic fatty liver disease: a feature of the metabolic syndrome. Diabetes 50, 1844–1850 (2001). - PubMed
    1. Youssef W. & Mccullough A. J. Diabetes mellitus, obesity, and hepatic steatosis. Seminars in Gastrointestinal Disease 13, 17–30 (2002). - PubMed
    1. Rinella M. E. Nonalcoholic fatty liver disease: a systematic review. Jama the Journal of the American Medical Association 313, 2263–2273 (2015). - PubMed
    1. Shaker M., Tabbaa A., Albeldawi M. & Alkhouri N. Liver transplantation for nonalcoholic fatty liver disease: New challenges and new opportunities. World Journal of Gastroenterology 20, 5320–5330 (2014). - PMC - PubMed
    1. Ruhl C. E. & Everhart J. E. Fatty liver indices in the multiethnic United States National Health and Nutrition Examination Survey. Alimentary Pharmacology & Therapeutics 41, 65–76 (2015). - PubMed

Publication types

MeSH terms