

Nondestructive, real-time determination and visualization of cellulose, hemicellulose and lignin by luminescent oligothiophenes
- PMID: 27759105
- PMCID: PMC5069672
- DOI: 10.1038/srep35578
Nondestructive, real-time determination and visualization of cellulose, hemicellulose and lignin by luminescent oligothiophenes
Abstract
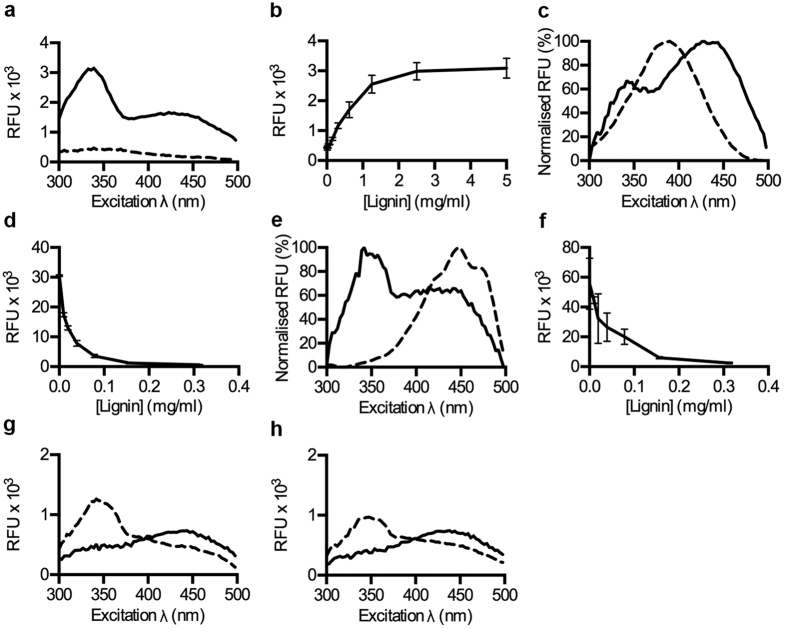
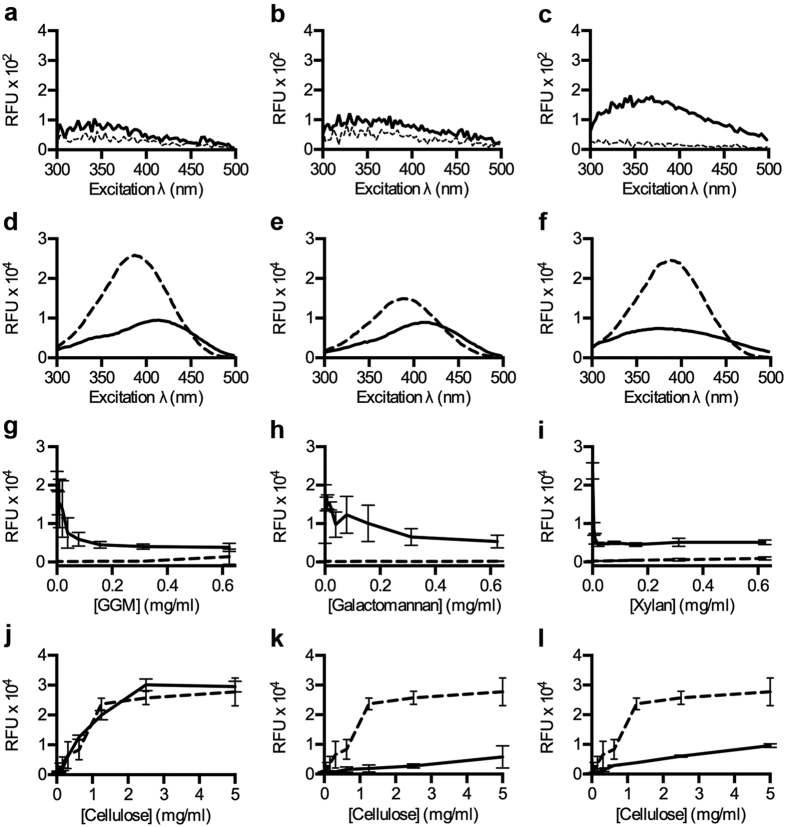
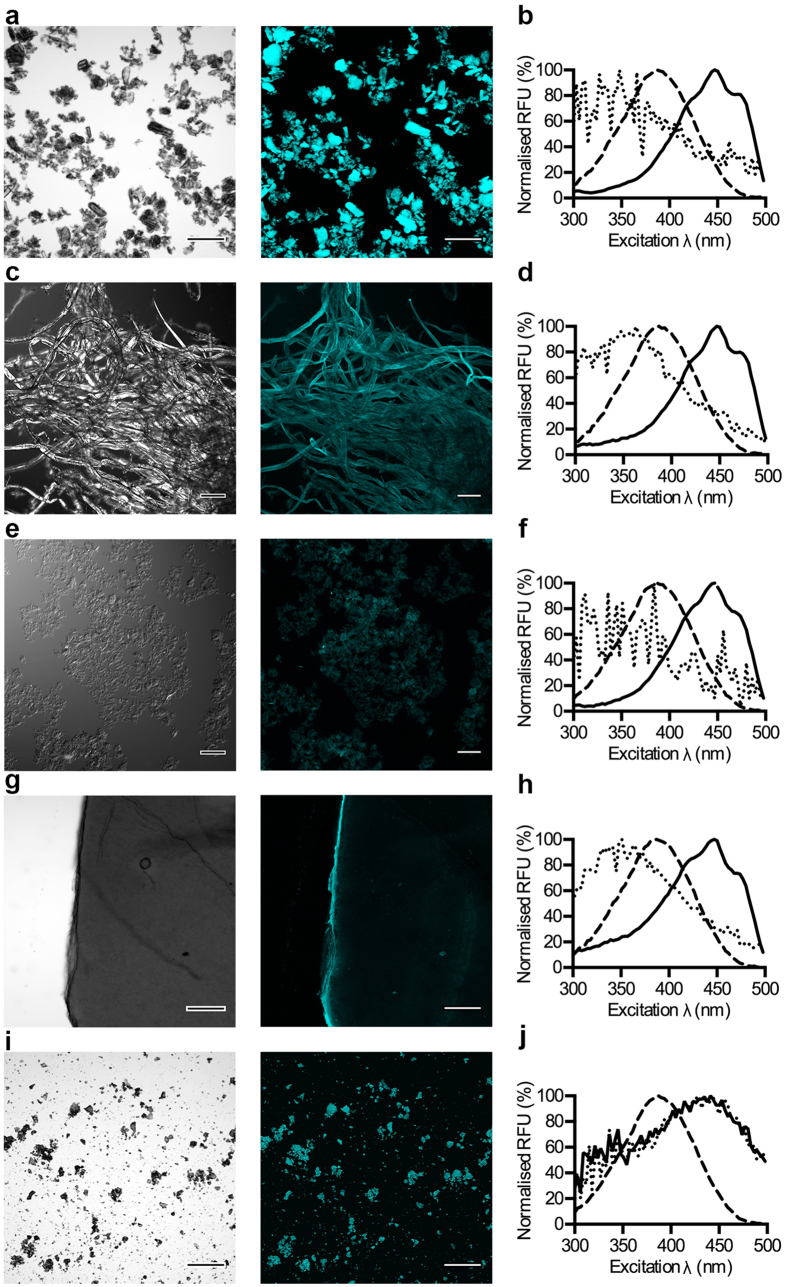
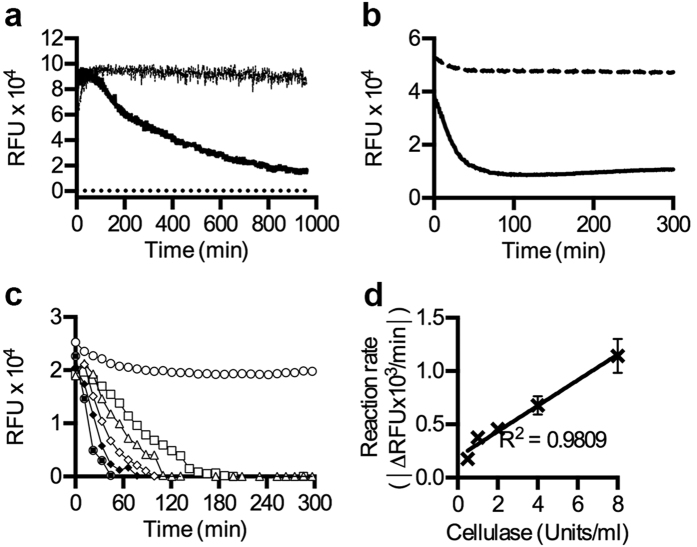
Enabling technologies for efficient use of the bio-based feedstock are crucial to the replacement of oil-based products. We investigated the feasibility of luminescent conjugated oligothiophenes (LCOs) for non-destructive, rapid detection and quality assessment of lignocellulosic components in complex biomass matrices. A cationic pentameric oligothiophene denoted p-HTEA (pentamer hydrogen thiophene ethyl amine) showed unique binding affinities to cellulose, lignin, hemicelluloses, and cellulose nanofibrils in crystal, liquid and paper form. We exploited this finding using spectrofluorometric methods and fluorescence confocal laser scanning microscopy, for sensitive, simultaneous determination of the structural and compositional complexities of native lignocellulosic biomass. With exceptional photostability, p-HTEA is also demonstrated as a dynamic sensor for real-time monitoring of enzymatic cellulose degradation in cellulolysis. These results demonstrate the use of p-HTEA as a non-destructive tool for the determination of cellulose, hemicellulose and lignin in complex biomass matrices, thereby aiding in the optimization of biomass-converting technologies.
Conflict of interest statement
S.E.S. and K.M. declare no competing financial interest. F.X.C. and A.R.D. are co-inventors on a pending patent. F.X.C., M.B., K.P.R.N., U.E. and A.R.D. are part owners of a company, which may commercialize LCOs for uses as described in this article..
Figures


Similar articles
-
Recent advances in understanding the role of cellulose accessibility in enzymatic hydrolysis of lignocellulosic substrates.Curr Opin Biotechnol. 2014 Jun;27:150-8. doi: 10.1016/j.copbio.2014.01.014. Epub 2014 Feb 16. Curr Opin Biotechnol. 2014. PMID: 24549148 Review.
-
Use of multivariate NMR analysis in the content prediction of hemicellulose, cellulose and lignin in greenhouse crop residues.Phytochemistry. 2019 Feb;158:110-119. doi: 10.1016/j.phytochem.2018.11.013. Epub 2018 Nov 28. Phytochemistry. 2019. PMID: 30502594
-
Determination of hemicellulose, cellulose and lignin content using visible and near infrared spectroscopy in Miscanthus sinensis.Bioresour Technol. 2017 Oct;241:603-609. doi: 10.1016/j.biortech.2017.05.047. Epub 2017 May 10. Bioresour Technol. 2017. PMID: 28601778
-
Determination of Hemicellulose, Cellulose and Lignin in Moso Bamboo by Near Infrared Spectroscopy.Sci Rep. 2015 Nov 25;5:17210. doi: 10.1038/srep17210. Sci Rep. 2015. PMID: 26601657 Free PMC article.
-
Cellulose, hemicellulose, lignin, and their derivatives as multi-components of bio-based feedstocks for 3D printing.Carbohydr Polym. 2020 Dec 15;250:116881. doi: 10.1016/j.carbpol.2020.116881. Epub 2020 Aug 13. Carbohydr Polym. 2020. PMID: 33049824 Review.
Cited by
-
Current and future advances in fluorescence-based visualization of plant cell wall components and cell wall biosynthetic machineries.Biotechnol Biofuels. 2021 Mar 29;14(1):78. doi: 10.1186/s13068-021-01922-0. Biotechnol Biofuels. 2021. PMID: 33781321 Free PMC article. Review.
-
Structural Properties Dictating Selective Optotracer Detection of Staphylococcus aureus.Chembiochem. 2022 Jun 3;23(11):e202100684. doi: 10.1002/cbic.202100684. Epub 2022 Apr 1. Chembiochem. 2022. PMID: 35298076 Free PMC article.
-
Progress and Opportunities in the Characterization of Cellulose - An Important Regulator of Cell Wall Growth and Mechanics.Front Plant Sci. 2019 Mar 1;9:1894. doi: 10.3389/fpls.2018.01894. eCollection 2018. Front Plant Sci. 2019. PMID: 30881371 Free PMC article. Review.
-
Dispersion preparation, characterization, and dosimetric analysis of cellulose nano-fibrils and nano-crystals: Implications for cellular toxicological studies.NanoImpact. 2019 Mar;15:10.1016/j.impact.2019.100171. doi: 10.1016/j.impact.2019.100171. Epub 2019 May 31. NanoImpact. 2019. PMID: 32133424 Free PMC article.
-
Lignocellulosic Biomass Transformations via Greener Oxidative Pretreatment Processes: Access to Energy and Value-Added Chemicals.Front Chem. 2018 Apr 27;6:141. doi: 10.3389/fchem.2018.00141. eCollection 2018. Front Chem. 2018. PMID: 29755972 Free PMC article. Review.
References
-
- Saito T., Kimura S., Nishiyama Y. & Isogai A. Cellulose nanofibers prepared by TEMPO-mediated oxidation of native cellulose. Biomacromolecules. 8, 2485–2491 (2007). - PubMed
-
- Isogai A., Saito T. & Fukuzumi H. TEMPO-oxidized cellulose nanofibers. Nanoscale. 3, 71–85 (2011). - PubMed
-
- Pérez S. & Samain D. Structure and engineering of celluloses. Adv Carbohydr Chem Biochem. 64, 25–116 (2010). - PubMed
-
- Delidovich I. et al.. Alternative monomers based on lignocellulose and their use for polymer production. Chem Rev. 116, 1540–1599 (2016). - PubMed
-
- Ghosh D. et al.. Fuels and chemicals from lignocellulosic biomass: An integrated biorefinery approach. Energy & Fuels. 29, 3149–3157 (2015).
Publication types
MeSH terms
Substances
LinkOut - more resources
Full Text Sources
Other Literature Sources
