

Hearing aid fitting for visual and hearing impaired patients with Usher syndrome type IIa
- PMID: 27759911
- PMCID: PMC5516239
- DOI: 10.1111/coa.12775
Hearing aid fitting for visual and hearing impaired patients with Usher syndrome type IIa
Abstract
Objectives: Usher syndrome is the leading cause of hereditary deaf-blindness. Most patients with Usher syndrome type IIa start using hearing aids from a young age. A serious complaint refers to interference between sound localisation abilities and adaptive sound processing (compression), as present in today's hearing aids. The aim of this study was to investigate the effect of advanced signal processing on binaural hearing, including sound localisation.
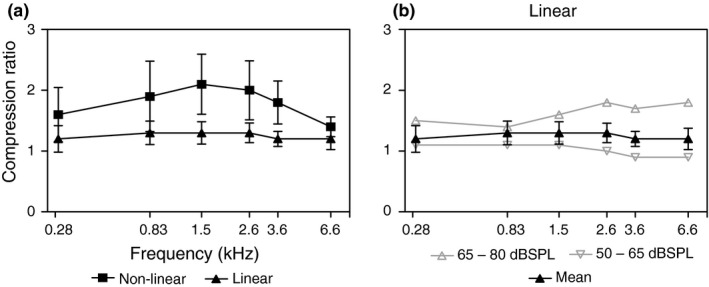
Design and participants: In this prospective study, patients were fitted with hearing aids with a nonlinear (compression) and linear amplification programs. Data logging was used to objectively evaluate the use of either program. Performance was evaluated with a speech-in-noise test, a sound localisation test and two questionnaires focussing on self-reported benefit.
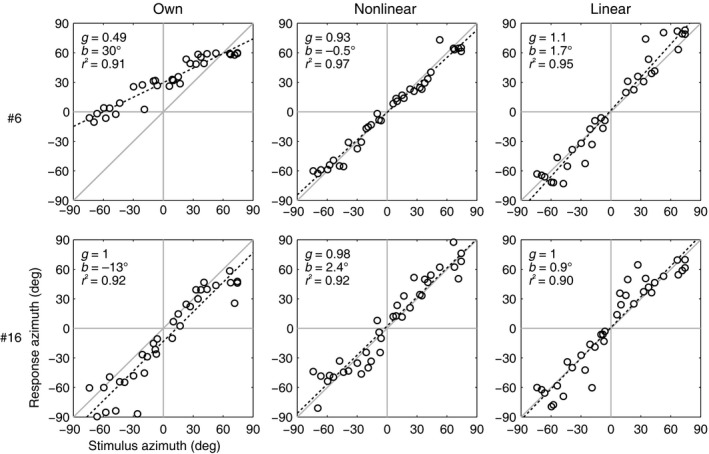
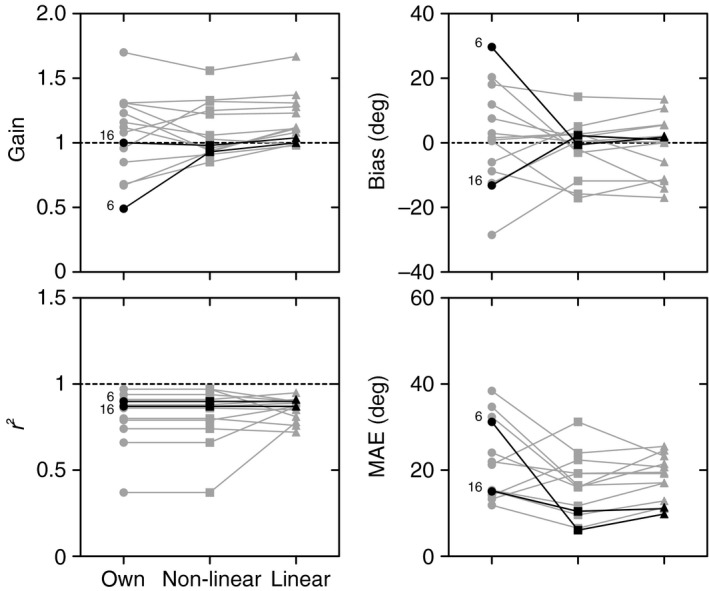
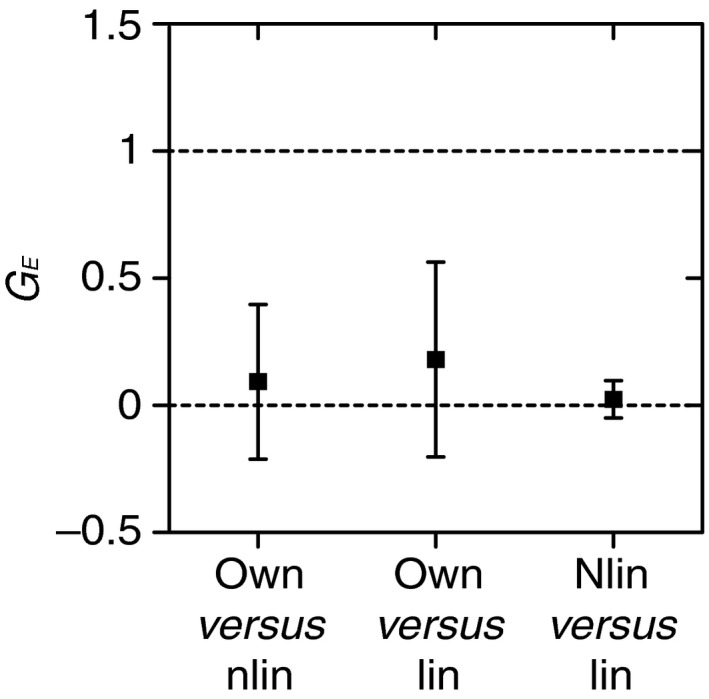
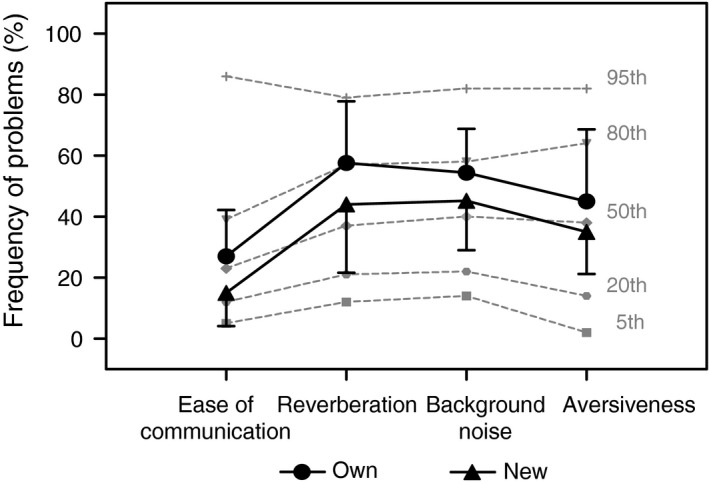
Results: Data logging confirmed that the reported use of hearing aids was high. The linear program was used significantly more often (average use: 77%) than the nonlinear program (average use: 17%). The results for speech intelligibility in noise and sound localisation did not show a significant difference between type of amplification. However, the self-reported outcomes showed higher scores on 'ease of communication' and overall benefit, and significant lower scores on disability for the new hearing aids when compared to their previous hearing aids with compression amplification.
Conclusions: Patients with Usher syndrome type IIa prefer a linear amplification over nonlinear amplification when fitted with novel hearing aids. Apart from a significantly higher logged use, no difference in speech in noise and sound localisation was observed between linear and nonlinear amplification with the currently used tests. Further research is needed to evaluate the reasons behind the preference for the linear settings.
© 2016 The Authors. Clinical Otolaryngology Published by John Wiley & Sons Ltd.
Figures
Similar articles
-
Investigation of Extended Bandwidth Hearing Aid Amplification on Speech Intelligibility and Sound Quality in Adults with Mild-to-Moderate Hearing Loss.J Am Acad Audiol. 2018 Mar;29(3):243-254. doi: 10.3766/jaaa.16180. J Am Acad Audiol. 2018. PMID: 29488874
-
Comparison of speech discrimination in noise and directional hearing with 2 different sound processors of a bone-anchored hearing system in adults with unilateral severe or profound sensorineural hearing loss.Otol Neurotol. 2013 Aug;34(6):1064-70. doi: 10.1097/MAO.0b013e31828bb781. Otol Neurotol. 2013. PMID: 23856626
-
Localization and speech-identification ability of hearing-impaired listeners using phase-preserving amplification.Ear Hear. 2005 Oct;26(5):461-72. doi: 10.1097/01.aud.0000179690.30137.21. Ear Hear. 2005. PMID: 16230896 Clinical Trial.
-
The contribution of a frequency-compression hearing aid to contralateral cochlear implant performance.J Am Acad Audiol. 2013 Feb;24(2):105-20. doi: 10.3766/jaaa.24.2.4. J Am Acad Audiol. 2013. PMID: 23357804 Clinical Trial.
-
How neuroscience relates to hearing aid amplification.Int J Otolaryngol. 2014;2014:641652. doi: 10.1155/2014/641652. Epub 2014 Jun 18. Int J Otolaryngol. 2014. PMID: 25045354 Free PMC article. Review.
Cited by
-
Sound localization with bilateral bone conduction devices.Eur Arch Otorhinolaryngol. 2022 Apr;279(4):1751-1764. doi: 10.1007/s00405-021-06842-1. Epub 2021 May 6. Eur Arch Otorhinolaryngol. 2022. PMID: 33956208 Free PMC article.
-
Ocular Manifestations in Patients with Sensorineural Hearing Loss.J Ophthalmic Vis Res. 2022 Nov 29;17(4):551-573. doi: 10.18502/jovr.v17i4.12321. eCollection 2022 Oct-Dec. J Ophthalmic Vis Res. 2022. PMID: 36620710 Free PMC article. Review.
-
Interventions for adults with deafblindness - an integrative review.BMC Health Serv Res. 2022 Dec 30;22(1):1594. doi: 10.1186/s12913-022-08958-4. BMC Health Serv Res. 2022. PMID: 36585684 Free PMC article. Review.
-
Usher Syndrome in the Inner Ear: Etiologies and Advances in Gene Therapy.Int J Mol Sci. 2021 Apr 10;22(8):3910. doi: 10.3390/ijms22083910. Int J Mol Sci. 2021. PMID: 33920085 Free PMC article. Review.
-
Design and Integration of Alert Signal Detector and Separator for Hearing Aid Applications.IEEE Access. 2020;8:106296-106309. doi: 10.1109/access.2020.2999546. IEEE Access. 2020. PMID: 32793404 Free PMC article.
References
-
- Boughman J.A., Vernon M. & Shaver K.A. (1983) Usher syndrome: definition and estimate of prevalence from two high‐risk populations. J. Chronic Dis. 36, 595–603 - PubMed
-
- Rosenberg T., Haim M., Hauch A.M. et al (1997) The prevalence of Usher syndrome and other retinal dystrophy‐hearing impairment associations. Clin. Genet. 51, 314–321 - PubMed
-
- Spandau U.H. & Rohrschneider K. (2002) Prevalence and geographical distribution of Usher syndrome in Germany. Graefes Arch. Clin. Exp. Ophthalmol. 240, 495–498 - PubMed
-
- Baux D., Larrieu L., Blanchet C. et al (2007) Molecular and in silico analyses of the full‐length isoform of usherin identify new pathogenic alleles in Usher type II patients. Hum. Mutat. 28, 781–789 - PubMed
-
- Dreyer B., Tranebjaerg L., Rosenberg T. et al (2000) Identification of novel USH2A mutations: implications for the structure of USH2A protein. Eur. J Hum Genet. 8, 500–506 - PubMed
MeSH terms
Supplementary concepts
LinkOut - more resources
Full Text Sources
Other Literature Sources
Medical
