
Deficiency of base excision repair enzyme NEIL3 drives increased predisposition to autoimmunity

Michel J Massaad et al. J Clin Invest. .

Abstract

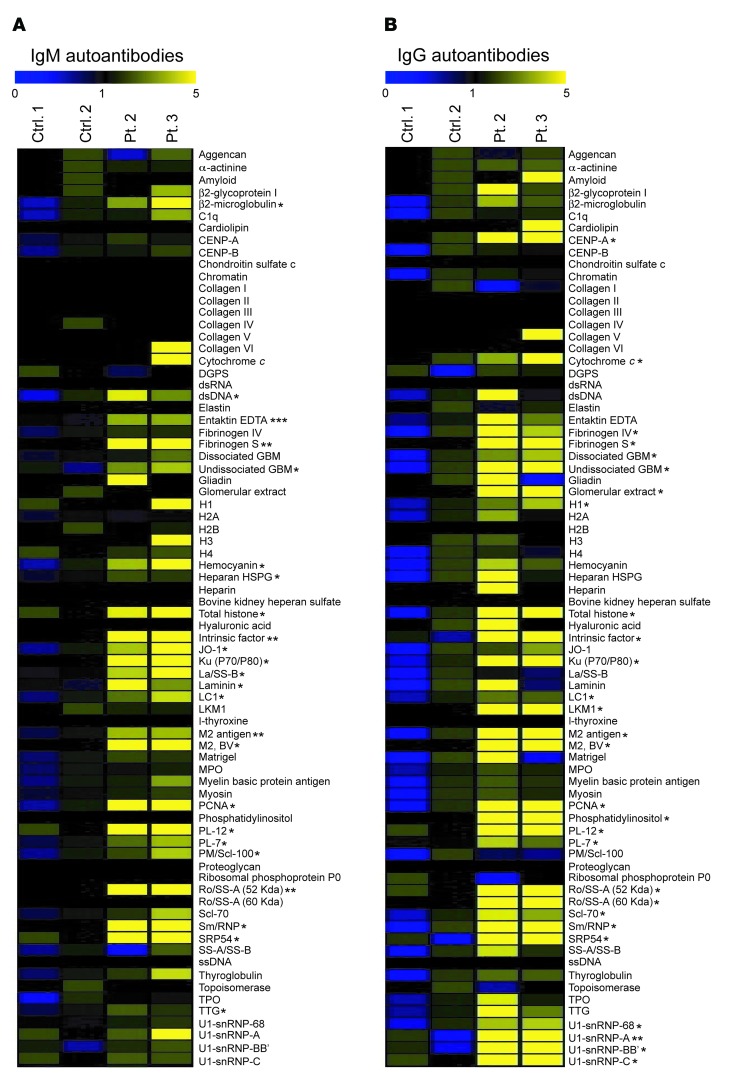
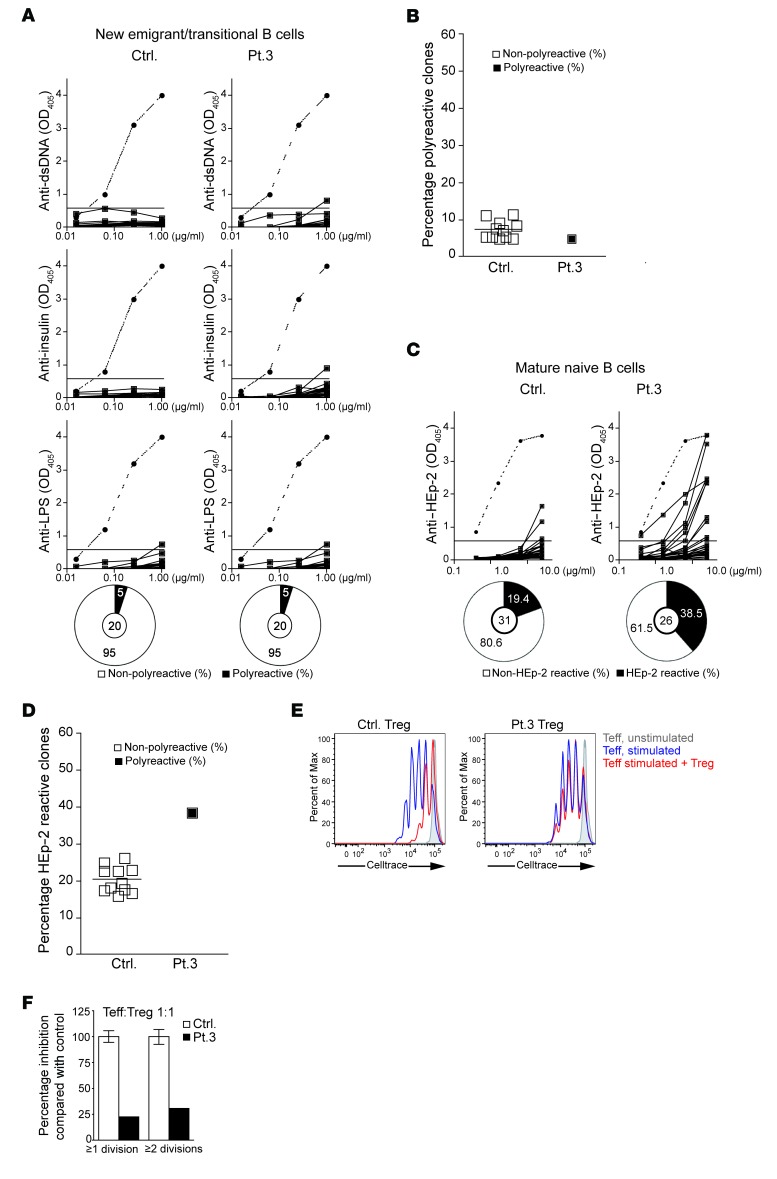
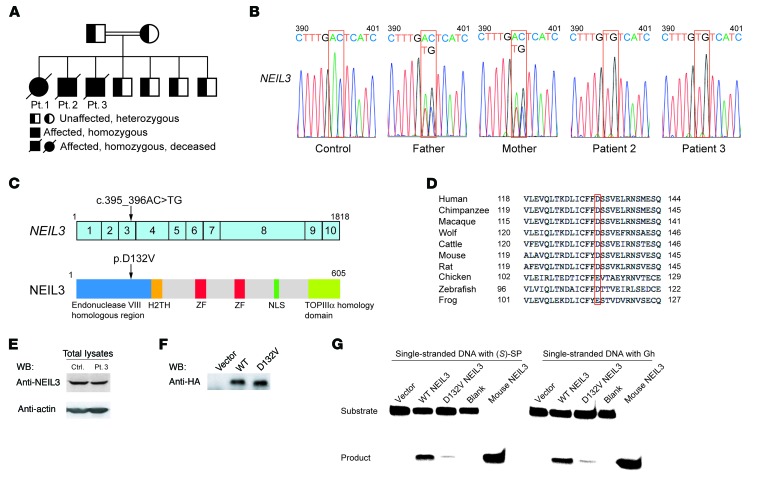
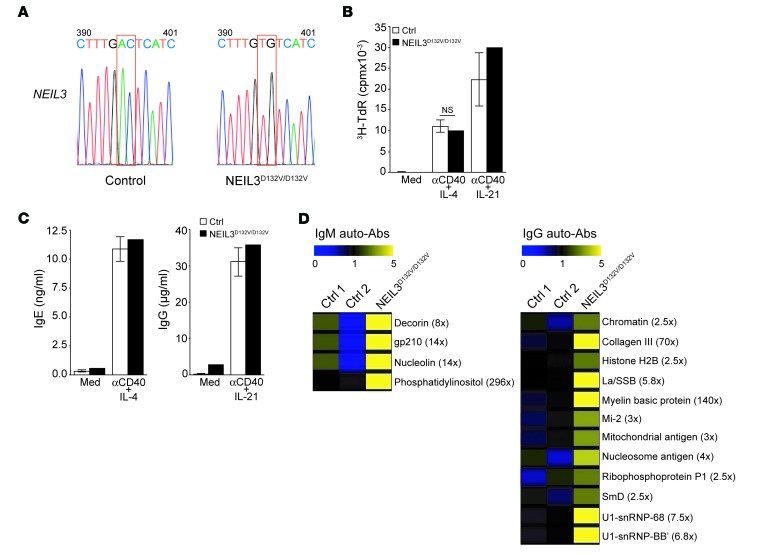
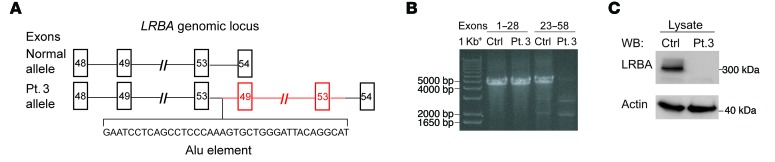
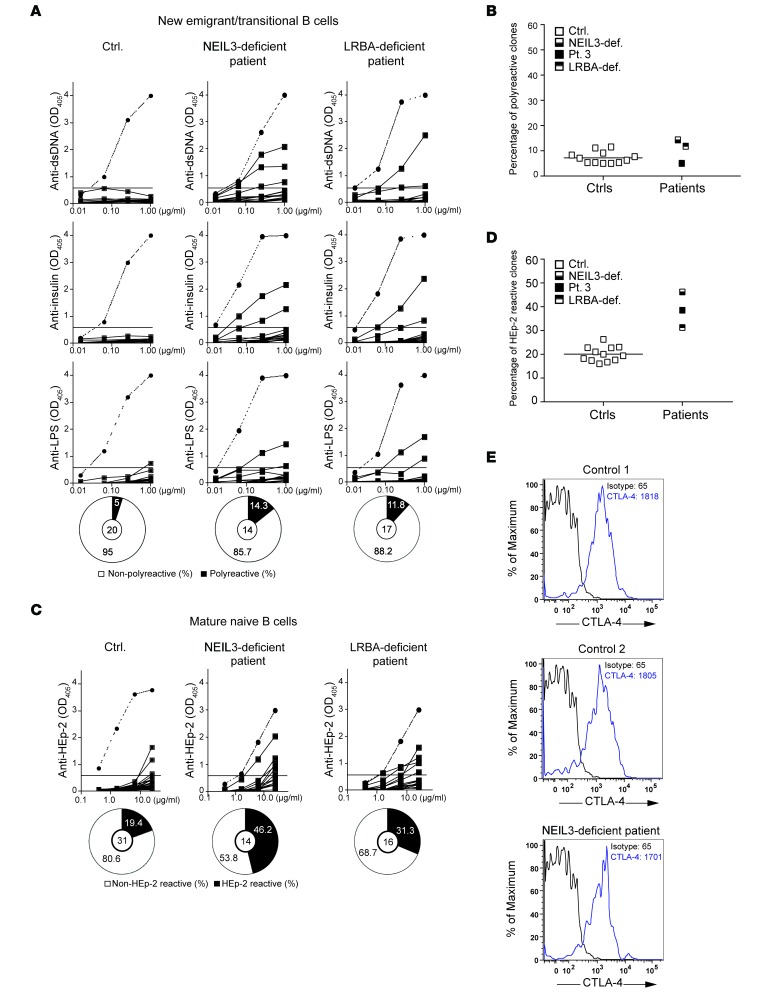
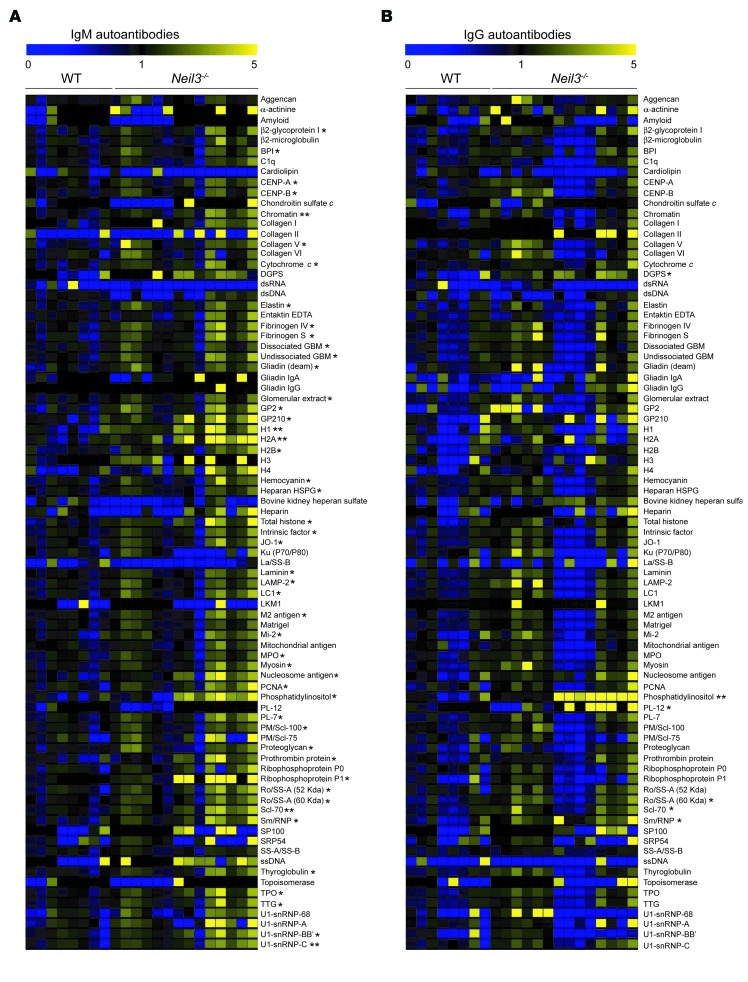
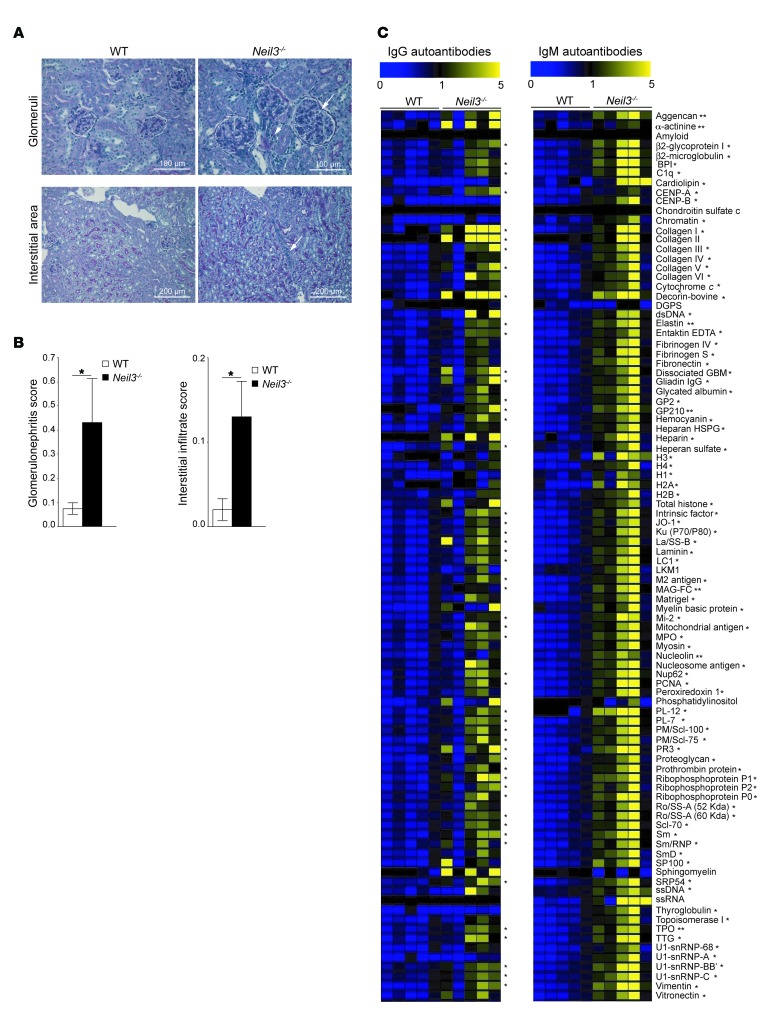
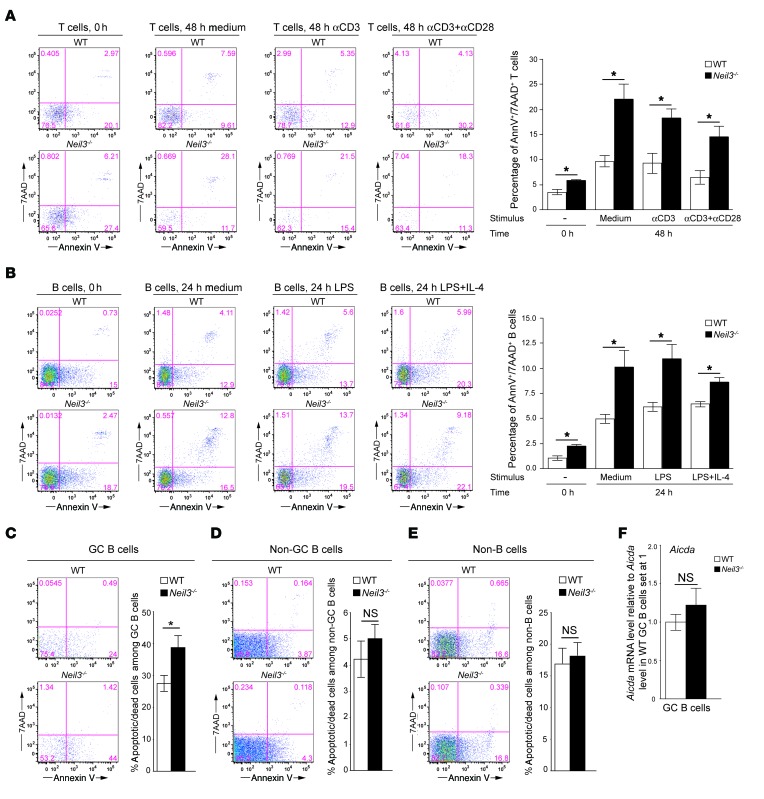
Alterations in the apoptosis of immune cells have been associated with autoimmunity. Here, we have identified a homozygous missense mutation in the gene encoding the base excision repair enzyme Nei endonuclease VIII-like 3 (NEIL3) that abolished enzymatic activity in 3 siblings from a consanguineous family. The NEIL3 mutation was associated with fatal recurrent infections, severe autoimmunity, hypogammaglobulinemia, and impaired B cell function in these individuals. The same homozygous NEIL3 mutation was also identified in an asymptomatic individual who exhibited elevated levels of serum autoantibodies and defective peripheral B cell tolerance, but normal B cell function. Further analysis of the patients revealed an absence of LPS-responsive beige-like anchor (LRBA) protein expression, a known cause of immunodeficiency. We next examined the contribution of NEIL3 to the maintenance of self-tolerance in Neil3-/- mice. Although Neil3-/- mice displayed normal B cell function, they exhibited elevated serum levels of autoantibodies and developed nephritis following treatment with poly(I:C) to mimic microbial stimulation. In Neil3-/- mice, splenic T and B cells as well as germinal center B cells from Peyer's patches showed marked increases in apoptosis and cell death, indicating the potential release of self-antigens that favor autoimmunity. These findings demonstrate that deficiency in NEIL3 is associated with increased lymphocyte apoptosis, autoantibodies, and predisposition to autoimmunity.


Figures

Figure 1
Figure 1. Serum autoantibodies in patients 2 and 3.
(A and B) Heat map display of IgM (A) and IgG (B) autoantibody reactivity against self-proteins in the sera of patients (Pt.) and controls (Ctrl.). A value of 1 is equal to the mean of the controls. P values were obtained by 2-tailed Student’s t test. *P < 0.05; **P < 0.01; ***P < 0.001.
Figure 2
Figure 2. Defective peripheral B cell tolerance checkpoint and impaired Treg function in patient 3.
(A) Reactivity of recombinant antibodies expressed by single CD19+CD10+CD21+IgM+CD27 new emigrant/transitional B cells from a representative healthy age-matched control and patient 3 against dsDNA, insulin, and LPS. Clones were considered polyreactive when they recognized all 3 antigens. The frequencies of polyreactive B cells are summarized in the pie charts, with the number of antibody-secreting B cells tested shown in the center. (B) Percentage of polyreactive new emigrant/transitional B cell clones from patient 3 and 12 controls. (C) Reactivity of recombinant antibodies expressed by single CD19+CD10CD21+IgM+CD27 mature naive B cell clones from a representative control and patient 3 against lysates of HEp-2 cells tested by ELISA. The frequencies of HEp-2– and non–HEp-2–reactive B cells are summarized in the pie charts, with the number of antibody-secreting B cells tested shown in the center. (D) Percentage of polyreactive new emigrant/transitional B cell clones from patient 3 and 12 controls. (E) Suppression by CD4+CD25+CD127lo Tregs from control (left panel) and patient 3 (right panel) of the proliferation of CellTrace Violet–labeled CD4+CD25+ Teff cells sorted from a third-party healthy subject stimulated with anti-CD3/CD28/CD2 beads at a 1:1 Treg/Teff ratio. (F) Quantification of the suppressive function of Tregs sorted from controls and patient 3 on Teff cells. Columns and bars in F represent mean ± SEM of 3 controls and patient 3. Dotted lines in A and C show the results from ED38. Horizontal lines show the OD405 cutoff for positive reactivity.
Figure 3
Figure 3. Family pedigree, NEIL3 mutation, and effect of the mutation on NEIL3 expression and enzymatic activity.
(A) Family pedigree. (B) Sanger sequencing chromatogram depicting the c.395_396AC>TG homozygous mutation in NEIL3 from patients 2 and 3 and the heterozygous mutation in their parents compared with a control. (C) cDNA organization of NEIL3 and protein structure showing the domains and location of the patients’ mutation indicated by the arrows. Boxes with numbers represent exons. H2TH, helix-2turn-helix; ZF, zinc finger; NLS, nuclear localization signal; TOPIIIα, topoisomerase IIIα. (D) Alignment of the aa sequence surrounding the conserved D132 residue in NEIL3 in homologues from 9 species. (E) Representative immunoblot of NEIL3 in lysates of EBV-transformed B cells from patient 3 and control. WB, Western blot. (F) Representative immunoblot of HA-tagged WT and D132V NEIL3 immunoprecipitated from transfected HeLa cells and detected with anti-HA mAb. (G) Enzymatic activity of HA-tagged WT and D132V NEIL3 immunoprecipitated from transfected HeLa cells and incubated with single-stranded DNA substrates containing the SP [(S)-SP] or the Gh modifications. Empty vector with substrate (vector) or substrate with no enzyme (blank) was used as negative control. Recombinant mouse NEIL3 was used as positive control. Data in EG are representative of 3 independent experiments.
Figure 4
Figure 4. Homozygous NEIL3 mutation, B cell activation, and serum autoantibodies in an asymptomatic healthy unrelated individual.
(A) Sanger sequencing chromatogram depicting the c.395_396AC>TG homozygous mutation in NEIL3 in a healthy unrelated adult asymptomatic subject (NEIL3D132V/D132V) compared with a control subject. (B and C) B cell proliferation (B) and Ig secretion (C) following stimulation of PBMC with anti-CD40+IL-4 or anti-CD40+IL-21. Columns and bars represent mean ± SEM of 5 controls and the NEIL3D132V/D132V subject. (D) Heat map display of IgM and IgG autoantibody reactivity in the sera of the NEIL3D132V/D132V subject compared with 2 healthy controls. Only autoantibodies, the levels of which were more than 2.5-fold higher in the NEIL3D132V/D132V subject than the mean of the controls, are shown. Values between brackets represent the fold increase in autoantibody levels in the subject with the NEIL3D132V/D132V mutation compared with the mean of the 2 controls.
Figure 5
Figure 5. Loss of LRBA protein expression in patient 3 as a result of the duplication of exons 49 to 53 of LRBA.
(A) Schematic representation of exons 48–54 of LRBA in the control and patient 3 showing the presence of an Alu element and the duplication of exons 49–53 of LRBA from patient 3. (B) RT-PCR of LRBA cDNA from EBV-transformed B cells from patient 3 and a normal control shows normal amplification of exons 1–28, but absent amplification of exons 23–58 in patient 3, as compared with the control. (C) Immunoblot of LRBA in lysates of EBV-transformed B cells from patient 3 and a control showing absent LRBA protein expression in patient 3. Data are representative of 3 independent experiments.
Figure 6
Figure 6. Defective peripheral B cell tolerance checkpoint in the NEIL3-deficient subject and in an LRBA-deficient patient.
(A) Reactivity of recombinant antibodies expressed by single new emigrant/transitional B cell clones from a representative healthy age-matched control, the NEIL3-deficient subject, and an LRBA-deficient patient against dsDNA, insulin, and LPS tested by ELISA. Dotted lines show the results from a positive control designated ED38. Horizontal lines show the OD405 cutoff for positive reactivity. The frequencies of polyreactive B cells are summarized in the pie charts, with the number of antibody-secreting B cell clones tested shown in the center. Clones are considered polyreactive when they recognize all 3 antigens. (B) Percentage of polyreactive new emigrant/transitional B cell clones from the NEIL3-deficient subject (NEIL3-def.), the LRBA-deficient patient, patient 3, and 12 controls. (C) Reactivity of recombinant antibodies expressed by single mature naive B cell clones from a control, the NEIL3-deficient subject, and the LRBA-deficient patient against lysates of HEp-2 cells tested by ELISA. Dotted lines show the results from the positive control ED38. Horizontal lines show the OD405 cutoff for positive reactivity. The frequencies of HEp-2– and non–HEp-2–reactive B cells are summarized in the pie charts, with the number of antibody-secreting B cell clones tested shown in the center. (D) Percentage of HEp-2–reactive mature naive B cell clones from the NEIL3-deficient subject, the LRBA-deficient patient, patient 3, and 12 controls. The percentage of reactive clones from patient 3 represented in Figure 2 was added to B and D for comparison with the subject with NEIL3 deficiency and the patient with LRBA deficiency. Each symbol represents 1 individual. The horizontal bar represents the mean of the controls. (E) Intracellular CTLA-4 staining in Tregs from 2 controls and the NEIL3-deficient subject. The numbers in the plots represent mean fluorescence intensity (MFI).
Figure 7
Figure 7. Elevated levels of autoantibodies in the sera of Neil3–/– mice.
(A and B) Heat map display of IgM (A) and IgG (B) autoantibody reactivity against self-proteins in the sera of Neil3–/– mice compared with WT controls. A value of 1 is equal to the mean of the WT. Thirteen Neil3–/– and 9 WT mice were used in this assay. P values were obtained by 2-tailed Student’s t test. *P < 0.05; **P < 0.01.
Figure 8
Figure 8. Poly(I:C)-induced glomerulonephritis in the kidneys and elevated levels of autoantibodies in the sera of Neil3–/– mice.
(A) Representative photomicrographs of kidney sections stained with PAS from Neil3–/– mice and WT controls treated with poly(I:C). Kidney sections from Neil3–/– mice show glomerulonephritis with periglomerular infiltrates (upper right panel, arrows) and interstitial infiltrate (lower right panel, arrow). Original magnification, ×40 (upper panels); ×20 (lower panels). Data are representative of 10 mice per group. (B) Histologic scores of glomerulonephritis and interstitial infiltrates, scored according to ref. . Columns and bars represent mean ± SEM of 10 mice per group. P values were obtained by 2-tailed Student’s t test. (C) Heat map display of IgM and IgG autoantibody reactivity against self-proteins in the sera of poly(I:C)-treated Neil3–/– mice and WT controls (n = 5 mice per group). A value of 1 is equal to the mean of the poly(I:C)-treated WT controls. P values were obtained by 2-tailed Student’s t test. *P < 0.05; **P < 0.01.
Figure 9
Figure 9. Percentages of apoptotic/dead T, B, and GC B cells and Aicda mRNA levels in GC B cells from Neil3–/– mice.
(A and B) Representative annexin V and 7AAD staining and quantitative analysis of the percentages of annexin V+7AAD+ cells among splenic CD4+ T cells (A) and B220+ B cells (B) freshly isolated from Neil3–/– mice and WT controls (0 hours) and after in vitro T cell stimulation with anti–CD3 ± CD28 for 48 hours or B cell stimulation with LPS ± IL-4 for 24 hours. (CE) Representative annexin V and 7AAD staining and quantitative analysis of the percentages of annexin V+ cells among B220+Fas+GL7+ GC B cells (C), B220+FasGL7 non–GC B cells (D), and B220 non–B cells (E) from PP of Neil3–/– mice and WT controls. (F) Aicda mRNA levels in sorted GC B cells from Neil3–/– mice and WT controls expressed relative to the average levels of Aicda mRNA in WT GC B cells set at 1. Columns and bars represent mean ± SEM of 3 mice per group for AB, and F, or 8 mice per group for CE. P values were obtained by 2-tailed Student’s t test. *P < 0.05. NS, not significant.

Comment in

Similar articles

Cited by

References

    1. Hochreiter-Hufford A, Ravichandran KS. Clearing the dead: apoptotic cell sensing, recognition, engulfment, and digestion. Cold Spring Harb Perspect Biol. 2013;5(1): doi: 10.1101/cshperspect.a008748. - DOI - PMC - PubMed
    1. Stuart L, Hughes J. Apoptosis and autoimmunity. Nephrol Dial Transplant. 2002;17(5):697–700. doi: 10.1093/ndt/17.5.697. - DOI - PubMed
    1. Al-Mayouf SM, et al. Loss-of-function variant in DNASE1L3 causes a familial form of systemic lupus erythematosus. Nat Genet. 2011;43(12):1186–1188. doi: 10.1038/ng.975. - DOI - PubMed
    1. Bidère N, Su HC, Lenardo MJ. Genetic disorders of programmed cell death in the immune system. Annu Rev Immunol. 2006;24:321–352. doi: 10.1146/annurev.immunol.24.021605.090513. - DOI - PubMed
    1. Emlen W, Niebur J, Kadera R. Accelerated in vitro apoptosis of lymphocytes from patients with systemic lupus erythematosus. J Immunol. 1994;152(7):3685–3692. - PubMed

MeSH terms