. 2016 Oct 27;538(7626):523-527.
doi: 10.1038/nature19847. Epub 2016 Oct 19.

Chromosome conformation elucidates regulatory relationships in developing human brain

Affiliations

Chromosome conformation elucidates regulatory relationships in developing human brain

Hyejung Won et al. Nature. .

Abstract

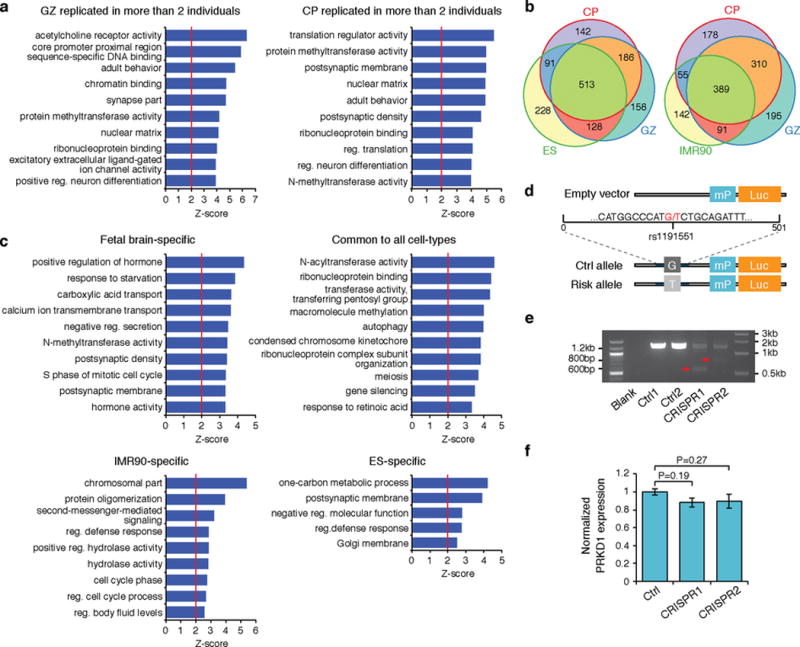
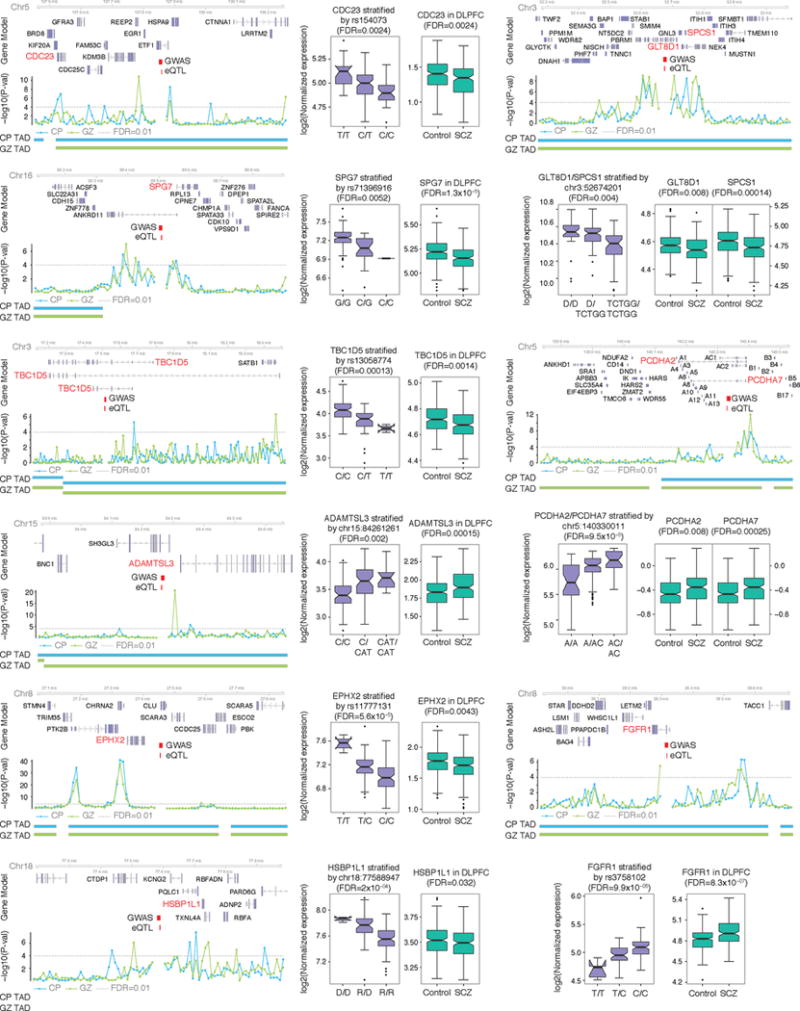
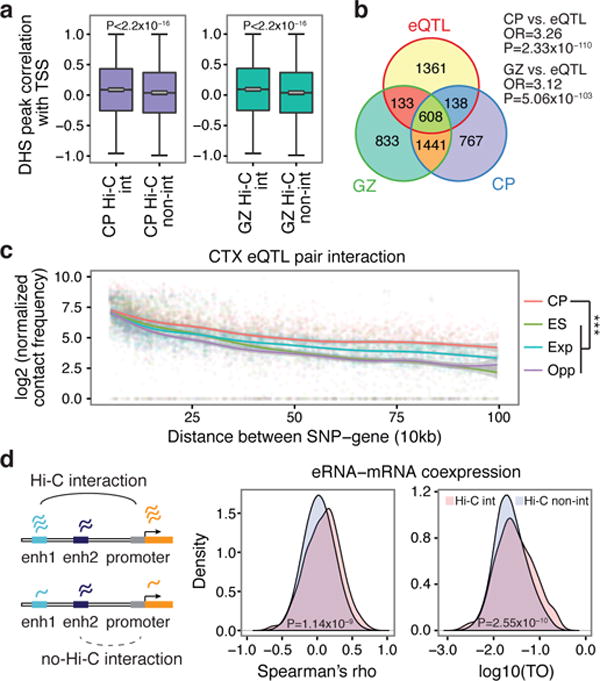
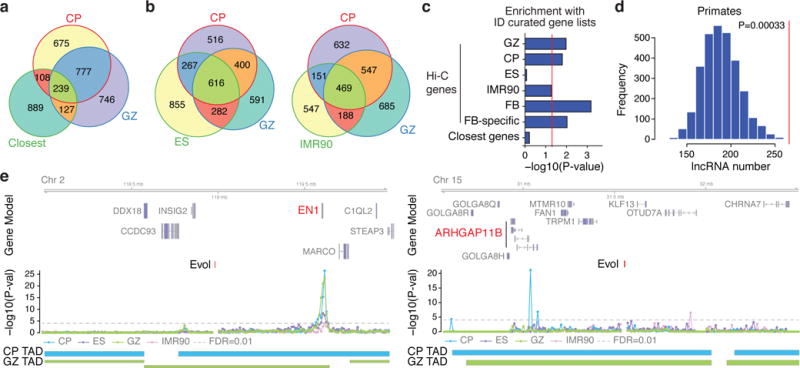
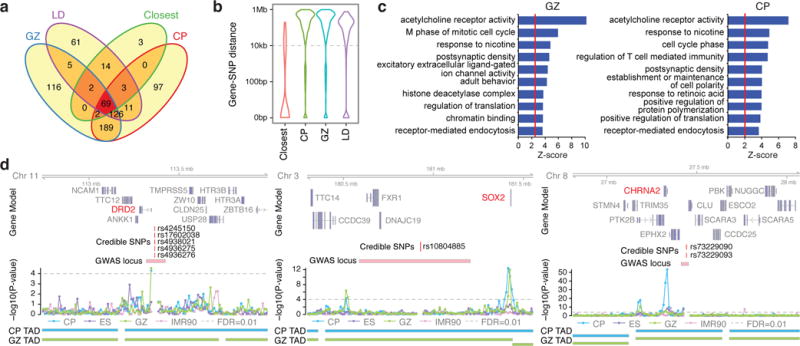
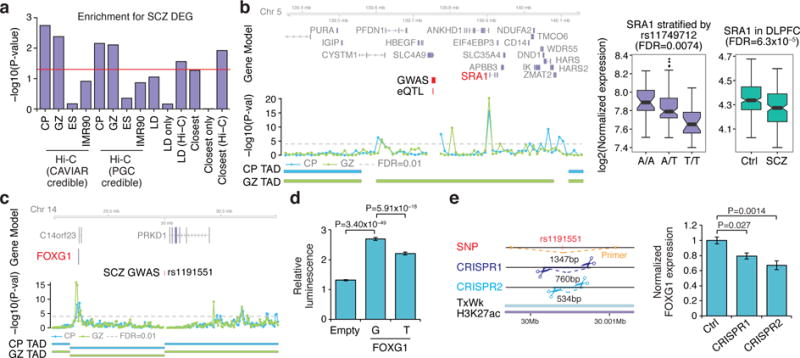
Three-dimensional physical interactions within chromosomes dynamically regulate gene expression in a tissue-specific manner. However, the 3D organization of chromosomes during human brain development and its role in regulating gene networks dysregulated in neurodevelopmental disorders, such as autism or schizophrenia, are unknown. Here we generate high-resolution 3D maps of chromatin contacts during human corticogenesis, permitting large-scale annotation of previously uncharacterized regulatory relationships relevant to the evolution of human cognition and disease. Our analyses identify hundreds of genes that physically interact with enhancers gained on the human lineage, many of which are under purifying selection and associated with human cognitive function. We integrate chromatin contacts with non-coding variants identified in schizophrenia genome-wide association studies (GWAS), highlighting multiple candidate schizophrenia risk genes and pathways, including transcription factors involved in neurogenesis, and cholinergic signalling molecules, several of which are supported by independent expression quantitative trait loci and gene expression analyses. Genome editing in human neural progenitors suggests that one of these distal schizophrenia GWAS loci regulates FOXG1 expression, supporting its potential role as a schizophrenia risk gene. This work provides a framework for understanding the effect of non-coding regulatory elements on human brain development and the evolution of cognition, and highlights novel mechanisms underlying neuropsychiatric disorders.


Conflict of interest statement

The authors declare no competing financial interests. Readers are welcome to comment on the online version of the paper.

Figures

Extended Data Figure 1
Extended Data Figure 1. Basic characterization of Hi-C library
a, Hi-C library sequencing information. Percentage for double-stranded (DS) reads indicates percentage of DS reads to all reads, and percentage for valid pairs and filtered reads indicates percentage of valid pairs and filtered reads to DS reads. Cis ratio, ratio of cis (intra-chromosomal) reads to the total number of reads. b, Frequency distribution of Hi-C contacts in GZ (left) and CP (right). c, Pearson correlation between replicates at 100 kb resolution is >0.8, demonstrating a high degree of correlation between biological replicates from different individuals. d, Size distribution of TADs in GZ (left) and CP (right). e, f, Size distribution of genomic regions in between TADs that are less than (TAD boundaries, e) and bigger than (unorganized chromosome, f) 400 kb in GZ (left) and CP (right).
Extended Data Figure 2
Extended Data Figure 2. Inter-chromosome conformation is associated with various genomic features
a, Representative heat map of the chromosome contact matrix of CP. Normalized contact frequency (contact enrichment) is colour-coded according to the legend on the right. b, Pearson correlation of the leading principle component (PC1) of inter-chromosomal contacts at 100 kb resolution between in vivo cortical layers and non-neuronal cell types (ES and IMR90). PC1s from neuronal tissues (CP and GZ) have significantly higher correlation than the PC1s between non-neuronal cell types, consistent with the higher similarity between tissues from brain vs the two other cell lines, although batch effects are also likely to contribute. c, Spearman correlation of PC1 of chromatin interaction profile of fetal brain (GZ) with GC content, gene number, DHS of fetal brain, and gene expression level in fetal laminae. d, GO enrichment of genes located in the top 1,000 highly interacting inter-chromosomal regions specific to CP vs GZ (left), and CP vs ES (right), indicating that genes located on dynamic chromosomal regions are enriched for neuronal development.
Extended Data Figure 3
Extended Data Figure 3. Intra-chromosomal conformation is associated with various genomic features
a, GO enrichment of genes that change compartment status from A to B (left) and B to A (right) in GZ to CP. b, Heat map of PC1 values of the genome that change compartment status in different cell types. Fraction of genome with compartment switch in different lineages is described below. c, Distribution of gene expression fold change (FC, left) and DHS FC (right) for genes/regions that change compartment status (‘A to B’ or ‘B to A’) or that remain the same (stable) in different cell/tissue types. B to A compartment shift is associated with increased DHS and gene expression, whereas the A to B shift is associated with decreased DHS and gene expression. P values from one-way ANOVA; whiskers, 1.5 × interquartile range (IQR); centre lines, median (black) and mean (grey). d, Percentage of epigenetic states for genomic regions that change compartment status between ES and GZ (left) and ES and CP (right). Note that B to A shift in ES to GZ/CP is associated with increased proportion of active promoter and transcribed regions (TssA and Tx) and enhancers (Enh, top), while A to B shift in ES to GZ/CP is associated with increased proportions of repressive marks (Het and ReprPCWk, bottom). *P < 0.05, **P < 0.01, ***P < 0.001. P values from Fisher’s test. Annotation for epigenetic marks described in a core 15-state model from ref. . e, Epigenetic changes in TADs mediate gene expression changes during neuronal differentiation. Genes were divided by expression FC between ES and differentiated neural cells, and epigenetic states in the TADs containing genes in each group were counted and compared between ES and CP. Upregulated genes in neurons locate in TADs with more active epigenetic marks in CP than in ES, while downregulated genes in neurons locate in TADs with more repressive marks in CP than in ES. Epigenetic states associated with activation and transcription of the genes were marked as red bars, while those associated with repression were marked as blue bars on the right. Annotation for epigenetic states described in ref. . f, Histone mark enrichment for adult cortical eQTL in fetal brain (FB, left) and adult frontal cortex (FCTX, right). g, Hi-C interaction frequency between eQTL and associated transcripts. LOESS smooth curve plotted with actual data points. Shaded area corresponds to 95% confidence intervals. GZ, chromatin contact frequency in GZ; ES, chromatin contact frequency in ES; Exp, expected interaction frequency given the distance between two regions; Opp, opposite interaction frequency: interaction frequency of SNPs and transcripts when the position of genes was mirrored relative to the eQTL. ***P < 0.001, P values from repeated measure of ANOVA.
Extended Data Figure 4
Extended Data Figure 4. Interacting regions share co-expression and epigenetic states
a, Top 2% (left), 5% (middle) and 10% (right) highest interacting regions both in GZ and CP (High) show positive correlation in gene expression, while top lowest interacting regions (Low) and variant interacting regions (Variant) have no skew in distribution. P values from Wilcoxon signed-rank test. b, Mean (top) and median (bottom) values for gene expression correlation for high, low and variant interacting regions with different cut-offs, indicating that higher the interaction, higher the correlation of gene expression. c, Top 2% highest interacting regions in fetal brain (FB) show more positive correlation in fetal brain gene expression compared with top 2% highest interacting regions in non-neuronal cells such as ES and IMR90 cells. d, Epigenetic state combination in inter-chromosomal interacting regions in GZ (left) and CP (right). Enhancers (TxEnh5′, TxEnh3′, TxEnhW, EnhA1), transcriptional regulatory regions (TxReg), and transcribed regions (Tx) interact highly to each other as marked in red. e, Epigenetic state combination in intra-chromosomal interacting regions in GZ (left) and CP (right). Enhancers (TxEnh5′, TxEnh3′, TxEnhW, EnhA1) and transcriptional regulatory regions (TxReg) interact highly to promoters (PromD1, PromD2) and transcribed regions (Tx5′, Tx) as marked in red. Inter- and intra-chromosomal contact frequency map is compared to epigenetic state combination matrix by Fisher’s test to calculate the enrichment of shared epigenetic combinations in interacting regions. Coloured bars on the left represent epigenetic marks associated with promoters and transcribed regions (orange), enhancers (red), and repressive marks (blue). Annotation for epigenetic marks is described in a 25-state model from ref. .
Extended Data Figure 5
Extended Data Figure 5. Characterization of chromatin interactome of human-gained enhancers
a, Distribution fitting of normalized chromatin interaction frequency between human-gained enhancers and 1 Mb (top) or 100 kb upstream (bottom) regions. Weibull distribution (red line) fits Hi-C interaction frequency the best for every distance range. b, Distribution of the number of significant interacting loci with human-gained enhancers in GZ (top) and CP (bottom). c, The fraction of epigenetic states for loci interacting with human-gained enhancers in CP and GZ. d, The proportions of human-gained enhancers and interacting regions within the same TAD. e, GO enrichment for human-gained interacting genes in CP (left) and GZ (right).
Extended Data Figure 6
Extended Data Figure 6. Human-gained enhancers interact to evolutionary lineage-specific lncRNAs
a, GO enrichment for cell type-specific human-gained enhancer interacting genes. b, GO enrichment for human-gained enhancer interacting genes replicated in more than two individuals from CP (top) and GZ (bottom). c, Protein-coding genes interacting with human-gained enhancers in CP and GZ have lower non-synonymous substitutions (dN) to synonymous substitutions (dS) ratio compared to protein-coding genes that do not interact with human-gained enhancers (All) in mammals (mouse), primates (rhesus macaque), and great apes (chimpanzee), indicative of purifying selection. P values from Wilcoxon signed-rank test. d, Number of lineage-specific lncRNAs interacting to human-gained enhancers (red vertical lines in the graph) in GZ (top) and CP (bottom). Null distribution was generated from 3,000 permutations, where the number of lncRNAs interacting to the same number of enhancers pooled from all fetal brain enhancers was counted.
Extended Data Figure 7
Extended Data Figure 7. Defining schizophrenia risk genes based on functional annotation of credible SNPs
a, b, Credible SNPs identified by CAVIAR (a) and defined in the original study (b) are categorized into functional SNPs, SNPs that fall onto gene promoters, and un-annotated SNPs. DHS and histone marks enrichment of credible SNPs was assessed in fetal brain (FB) and adult frontal cortex (FCTX). Functional SNPs and promoter SNPs were directly assigned to the target genes, while un-annotated SNPs were assigned to the target genes via Hi-C interactions in CP and GZ. GO enrichment for genes identified by each category is shown in the bottom. Note that two credible SNP lists overlap with each other; credible SNPs defined in the original study are not restricted to genome-wide significant loci, so they include broader range (20,362 credible SNPs vs 7,547 CAVIAR SNPs) of SNPs than CAVIAR credible SNPs. NMD, nonsense-mediated decay.
Extended Data Figure 8
Extended Data Figure 8. Chromatin interactions identify genes that are neither the closest nor in the LD with index SNPs
a, Number of closest genes and LD genes that interact with credible SNPs (Hi-C identified) vs not (Hi-C non-identified). b, Number of credible SNP interacting genes that are closest to or in LD with index SNPs (Hi-C genes that are also) vs not (Hi-C alone). Hi-C genes here contain only physically interacting genes, but not genes identified by functional SNPs. c, GO enrichment for the closest genes (top) and genes in LD with index SNPs (bottom) that are identified by the schizophrenia risk gene assessment pipeline in Extended Data Fig. 7 (right) vs not (left). d, GO enrichment for schizophrenia risk genes that are neither the closest genes nor in LD to index SNPs. Intersect (left) and union (right) of genes identified by chromatin contacts in CP and GZ are indicated. Venn diagrams are marked in orange to depict the gene list assessed for GO enrichment. e, Representative interaction map of a 10 kb bin, in which credible SNPs reside, to the corresponding 1 Mb flanking regions. Credible SNPs, genomic coordinates for credible SNPs that interact to the target gene; GWAS locus, LD region for the index SNP.
Extended Data Figure 9
Extended Data Figure 9. Cell-type specificity and reproducibility of Hi-C interactions with schizophrenia GWAS hits
a, GO enrichment for schizophrenia risk genes replicated in more than two individuals in CP (left) and GZ (right). b, Overlap between genes that interact to schizophrenia credible SNPs in CP and GZ vs ES (left) and IMR90 (right). c, GO enrichment for genes that interact to schizophrenia credible SNPs in cell-type specific manner. d, Schematic showing the incorporation of sequence flanking rs1191551 into reporter (Luc) vector with a minimal promoter (mP). e, PCR amplification of targeted genomic region demonstrates deletion of the SNP-containing region. Expected band size, 587 bp (CRISPR1) and 813 bp (CRISPR2). f, CRISPR/Cas9-mediated deletion of rs1191551 flanking region does not affect the closest protein-coding gene PRKD1 expression. Normalized expression levels of PRKD1 relative to control (Ctrl) (mean ± standard error, n = 6 (Ctrl), 4 (CRISPR1 and CRISPR2)). P values, one-way ANOVA and post hoc Tukey test.
Extended Data Figure 10
Extended Data Figure 10. High probability schizophrenia risk loci predicted by Hi-C interactions and cortical eQTL
Hi-C interactions and eQTL association target the same gene (marked in red). Risk alleles lead to target gene dysregulation in the same direction as in schizophrenia brains. Chromosome ideogram and genomic axis (top); gene model based on Gencode v.19 and target genes identified by both Hi-C and eQTL are marked in red; Genomic coordinates for the 10 kb bin containing credible SNPs (schizophrenia GWAS) and eQTL; –log10[P value], P value for the significance of the interaction between schizophrenia credible SNPs and each 10 kb bin, grey dashed line denotes FDR = 0.01; TAD borders in CP and GZ are indicated. Protocadherins (PCDH) gene family is marked as A (PCDHA) and B (PCDHB) except target genes, PCDHA2 and PCDHA7. Whiskers and centre lines correspond to 1.5 × IQR and median, respectively.
Figure 1
Figure 1. Chromosome conformation and gene regulatory mechanisms
a, DHS peak correlations with the transcription start site (TSS) for putative enhancers that physically interact with promoters by Hi-C (Hi-C int.) vs not (Hi-C non-int.). P values calculated by t-test from correlation values converted to Z scores; whiskers, 1.5 × interquartile range; centre lines, median (black) and mean (grey). b, Overlap between eQTL transcripts and genes physically interacting with eQTL in CP and GZ (Fisher’s test). OR, odds ratio. c, Hi-C interaction frequency between eQTL and associated transcripts. Chromatin contact frequency in CP and ES; Exp., expected interaction frequency; Opp., (opposite) interaction frequency of SNPs and transcripts when the position of genes was mirrored relative to the eQTL. ***P < 0.001, repeated measures ANOVA. LOESS curves and confidence intervals (95%, shaded area) are depicted. d, Hi-C interacting enhancer–gene pairs show increased expression correlation (Spearman, middle) as well as co-expression (TO, topological overlap, right) compared with non-interacting pairs (Wilcoxon signed-rank test).
Figure 2
Figure 2. Regulatory architecture of human-gained enhancers
a, b, Overlap between Hi-Cevol genes in CP and GZ with the closest genes (a) and Hi-Cevol genes in ES (left) and IMR90 (right, b) cells. c, Overrepresentation of Hi-Cevol genes in different tissues and closest genes with ID risk genes. GPCR, G-protein coupled receptor; Hi-C genes: GZ, CP, ES, IMR90, Hi-Cevol genes in each cell type; FB (fetal brain), union of Hi-Cevol genes in GZ and CP; FB-specific, Hi-Cevol genes in FB only; Closest genes, closest genes to human-gained enhancers. d, Number of primate-specific lncRNAs interacting with human-gained enhancers in CP (a red vertical line in the graph) against permuted background. e, Representative interaction map of a 10 kb bin, in which human-gained enhancers reside, with the corresponding flanking regions. Chromosome ideogram and genomic axis on the top, possible target genes marked in red; genomic coordinates for human-gained enhancers are labelled as Evol; –log10[P value], significance of the interaction between human-gained enhancers and each 10 kb bin; grey dotted line marks FDR = 0.01; TAD borders in CP and GZ below.
Figure 3
Figure 3. Annotation of schizophrenia-associated loci
a, Overlap between closest genes and genes in LD with index SNPs, and schizophrenia risk genes in CP and GZ. b, Distance between credible/index SNPs and their target genes for closest, LD, and schizophrenia risk genes in CP and GZ. c, GO enrichment for schizophrenia risk genes in CP (left) and GZ (right). d, Representative interaction map of a 10 kb bin, in which credible SNPs reside, to the corresponding flanking regions. Credible SNPs, genomic coordinates for credible SNPs that interact to the target gene; GWAS locus, LD region for the index SNP.
Figure 4
Figure 4. Functional validation of schizophrenia risk genes predicted by Hi-C
a, Over-representation of schizophrenia risk genes with downregulated genes in schizophrenia DLPFC. Hi-C: CP, GZ, ES, IMR90, genes that are associated with CAVIAR credible SNPs or originally identified credible SNPs (PGC credible) in each tissue/cell type; LD, genes that are in LD with index SNPs, that are identified (LD, Hi-C) and not (LD only) by Hi-C; closest, closest genes to index SNPs, that are identified (closest, Hi-C) and not (closest only) by Hi-C. b, Hi-C interactions and eQTL association identify the same gene (left, marked in red), which is dysregulated in the same direction in schizophrenia DLPFC (right). Coordinates for the 10 kb bin containing credible SNPs (schizophrenia GWAS) and eQTL are indicated. Whiskers, 1.5 × interquartile range; centre lines, median. c, Interaction map of SNP rs1191551 indicates an interaction with FOXG1. d, rs1191551 risk allele (T) decreases luciferase activity (mean ± standard error, n = 32). P values, linear mixed effect model. e, Predicted cleavage sites for two guide RNA pairs (CRISPR1 and CRISPR2); location of primers used to validate deletion are indicated. Rs1191551 is located in a weakly transcribed region (TxWk) containing a predicted active enhancer (H3K27ac) in fetal brain (left). CRISPR/Cas9-mediated deletion of rs1191551 flanking region reduces the expression of FOXG1 (right). Normalized expression levels of FOXG1 relative to control (Ctrl) (mean ± standard error, n = 6 (Ctrl), 4 (CRISPR1 and CRISPR2)). P values, one-way ANOVA and post hoc Tukey test.

References

    1. Lieberman-Aiden E, et al. Comprehensive mapping of long-range interactions reveals folding principles of the human genome. Science. 2009;326:289–293. - PMC - PubMed
    1. Jin F, et al. A high-resolution map of the three-dimensional chromatin interactome in human cells. Nature. 2013;503:290–294. - PMC - PubMed
    1. Rao SS, et al. A 3D map of the human genome at kilobase resolution reveals principles of chromatin looping. Cell. 2014;159:1665–1680. - PMC - PubMed
    1. Parikshak NN, et al. Integrative functional genomic analyses implicate specific molecular pathways and circuits in autism. Cell. 2013;155:1008–1021. - PMC - PubMed
    1. McCarthy SE, et al. De novo mutations in schizophrenia implicate chromatin remodeling and support a genetic overlap with autism and intellectual disability. Mol Psychiatry. 2014;19:652–658. - PMC - PubMed

Publication types

MeSH terms