. 2016 Oct 19;11(10):e0163915.
doi: 10.1371/journal.pone.0163915. eCollection 2016.

Formin DAAM1 Organizes Actin Filaments in the Cytoplasmic Nodal Actin Network

Affiliations

Formin DAAM1 Organizes Actin Filaments in the Cytoplasmic Nodal Actin Network

Weiwei Luo et al. PLoS One. .

Abstract

A nodal cytoplasmic actin network underlies actin cytoplasm cohesion in the absence of stress fibers. We previously described such a network that forms upon Latrunculin A (LatA) treatment, in which formin DAAM1 was localized at these nodes. Knock down of DAAM1 reduced the mobility of actin nodes but the nodes remained. Here we have investigated DAAM1 containing nodes after LatA washout. DAAM1 was found to be distributed between the cytoplasm and the plasma membrane. The membrane binding likely occurs through an interaction with lipid rafts, but is not required for F-actin assembly. Interesting the forced interaction of DAAM1 with plasma membrane through a rapamycin-dependent linkage, enhanced F-actin assembly at the cell membrane (compared to the cytoplasm) after the LatA washout. However, immediately after addition of both rapamycin and LatA, the cytoplasmic actin nodes formed transiently, before DAAM1 moved to the membrane. This was consistent with the idea that DAAM1 was initially anchored to cytoplasmic actin nodes. Further, photoactivatable tracking of DAAM1 showed DAAM1 was immobilized at these actin nodes. Thus, we suggest that DAAM1 organizes actin filaments into a nodal complex, and such nodal complexes seed actin network recovery after actin depolymerization.


Conflict of interest statement

The authors have declared that no competing interests exist.

Figures

Fig 1
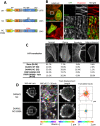
Fig 1. DAAM1 localizes to both membrane and actin cytoskeleton.
(A) Localization of endogenous DAAM1 transfected GFP-DAAM1 and the mutants. DAAM1 localized to both cytoplasm and cell edge. Comparing N-terminus mutants, construct lacking the first 45aa did not show membrane localization (yellow triangle). Comparing C-terminus mutants, construct lacking the last 33aa showed less filopodia and filopodia tip localizations (yellow ^). (B) Middle section of live-cell confocal image showed the colocalization of bright DAAM1 puncta with membrane structure. HeLa cells were transfected with GFP-DAAM1 WT and CFP-Lyn11. Two regions of the image are enlarged. (C) Domain structures of DAAM1 and its mutants.
Fig 2
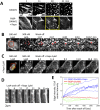
Fig 2. DAAM1 assembled actin in cytoplasm and membrane upon LatA wash off.
(A) Actin filament grew from the DAAM1-containing nodes upon LatA wash off. HeLa JW cells were transfected with Ruby-Lifeact and GFP-DAAM1 24 hours before imaging. 500 nM LatA was first added to the cells. Wash off was done by replacing the LatA-containing medium to normal DMEM after 3 times washing. (B) Enlarged area from the white box in (A) showed the details of DAAM1 dots and actin nodes localization in the first few minutes after LatA wash off. (C) Imaris tracking of WT DAAM1 dots and actin nodes at 50 minutes of 500 nM LatA treatment showed 55% of DAAM1 dots was colocalized with actin nodes, and 50% of actin nodes were colocalized with DAAM1 dots. Green: DAAM1 dots. Magenta: actin nodes. Yellow: co-localization of DAAM1 and actin. (D) The percentage of DAAM1 dots associated with actin nodes (green line) and actin nodes to DAAM1 (red line) changed over time. The blue line indicates the quantification time shown in (C). The black line indicates LatA washed off time. (E) Enlarged area from the red box in (A) showed the cell edge actin deformation during the course of LatA treatment and wash off. (F) Actin filament grew from the nodes with the speed of 25.2 ± 12.4 nm/sec.
Fig 3
Fig 3. Actin structures change upon DAAM1 wild type (WT) and NC mutant transfection.
(A) Schematic illustrations of the two constructs. *: C16-17A mutation. (B) H460 cells were transfected with either DAAM1 WT or NC mutant 24 hours before fixation then stained with phalloidin. Epifluorescence images were taken. White box showed the actin structure of untransfected cells, and yellow boxes showed the transfection of respective GFP constructs. Rolling ball background subtraction was performed to the insert to increase the contrast (C) The transfected HFF cells were categorized into 4 groups according to the actin structure. (D) Actin nodes movement in NC or NC I698A transfected H460 cells were compared. The inserts showed temporal-color coded 9-minute maximum intensity projection (MIP), from 17 to 26 minutes after 500 nM LatA treatment. Actin nodes movement was tracked using Imaris. All the tracks were then translated to initial position (x = 0, y = 0) with color-coded track displacement length.
Fig 4
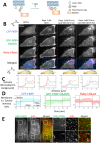
Fig 4. Rapamycin-trigged membrane translocation of DAAM1 requires actin depolymerization.
(A) Schematic diagram of inducible translocation of DAAM1. (B) Rapamycin addition induced fast translocation of CFP-FKBP but minor translocation of GFP-FKBP-DAAM1. HeLa cell was transfected with Lyn11-FRB, CFP-FKBP, GFP-FKBP-DAAM1, Ruby-Lifeact and treated with 1 uM Rapamycin and 500 nM LatA as indicated. The middle confocal section of the cell was shown as indicated by the yellow bar at the bottom. (C) Intensity of the yellow line in the merged image in (B) is normalized to the background. Blue: CFP-FKBP. Green- GFP-FKBP-DAAM1. Red: Ruby-Lifeact. (D) Quantification of cell membrane vs. cytosol intensity change. The membrane area of the cell was defined as a 1 μm-thick area from the cell outer surface of the confocal z-stack. The intensity quantification was done by averaging 7 cells. The bold line is the mean value and the shade represents the standard deviation. (E) Combination of 1μM rapamycin and 500nM LatA treatment for 1 hour eliminated the localization of GFP-FKBP-DAAM1 at actin nodes.
Fig 5
Fig 5. Membrane translocation of DAAM1 resulted in transient actin nodes upon LatA treatment and peripheral actin filament assembly upon LatA wash-off.
(A) HeLa JW cells time lapse images of the actin node dynamics in control (transfected with WT DAAM1 and Lifeact) and inducible translocation system (transfected with GFP-FKBP-DAAM1, Lyn11-FRB and Lifeact). Actin nodes appeared transiently 20 minutes after LatA treatment in the cells with DAAM1 translocate to the membrane (highlighted in yellow box). The image corresponds to S3 Movie. (B) The cell was treated with 500 nM LatA then wash off using culture medium. The red box region is enlarged on the right. Four actin nodes in the last frame of LatA treatment were marked in red circles. After wash-off LatA, actin polymerization occurs. These nodes became asters and marked as “*” in red. Images were background subtracted to increase the contrast. (C) The cell was treated with a combination of 1 μM rapamycin and 500 nM LatA then wash off LatA using 1 μM rapamycin-containing medium. The red box region is enlarged on the right. The HeLa JW cells were transfected with GFP-FKBP-DAAM1, Lyn11-FRB and Lifeact in (B) and (C). (D) The cell edge area is enlarged from the yellow rectangular in (C) to show the actin intensity change over time after LatA wash off. (E) The intensity ratio between membrane and cytoplasmic region after LatA wash off. The membrane area was defined as 1 μm-thick area from the cell outer surface.
Fig 6
Fig 6. Fluorescence recovery after photobleaching (FRAP) showed there is a significant portion of immobile DAAM1.
(A) FRAP images of GFP-DAAM1. Scale bar: 10 μm. (B) The recovery curves of GFP vector, GFP-mDia1, GFP-mDia1C (543–1192 aa), GFP-DAAM1 and GFP-DAAM1C (524–1078 aa). DAAM1 recovered significantly slower than the others. (C) Mobile fraction measurements from all the samples. (D) Half time measurements from all the samples.
Fig 7
Fig 7. Photoactivatable tracking of PATagRFP-DAAM1 showed the dispersion of DAAM1 molecules was related to actin structures and drug treatments.
(A) PATagRFP-DAAM1 intensity dropped exponentially with increased exposure time. With constant 30 ms exposure time, various intervals between frames were used. The curves were exponential fits of the measured intensity except the data from stream acquisition. (B) Demonstration of the intensity over distances measurement of PATagRFP-DAAM1. Given the R as the distance away from the edge of ROI, the mean intensity between (R, R+ΔR) ring regions was measured. (C) A plot of measurement in (B) with multiple time points post-activation. The spreading width is defined as the half-maximum width at time = 1 sec. (D) The spreading width extended further for longer time post-activation. (E) The PATagRFP-DAAM1 spreading width vs. post-activation time in cells with and without LatA treatment. The orange line is the overall trending line for data collected in various time intervals. Note that LatA treatment samples were acquired only with 2 second interval due to the time limits of drug treatment. (F) The FRAP and photoactivation samples were categorized into 4 groups according the actin structures and the drug treatments. DAAM1 molecules dispersion was different in different groups. The first row is the typical GFP-β-actin structure 1 frame before the FRAP/photoactivation. The second row is the 1 sec-maximum intensity projection of all the samples in each group. Scale bar: 5 μm. (G) The spreading width measurement of each group corresponding to the group in (F). It is an estimation using the data points from all the samples. No error bars are available. (H) The actin FRAP measurements of each group corresponding to each group in (F).

Similar articles

Cited by

References

    1. Matsudaira P. Actin crosslinking proteins at the leading edge. Seminars in cell biology. 1994;5(3):165–74. . - PubMed
    1. Munro E, Nance J, Priess JR. Cortical flows powered by asymmetrical contraction transport PAR proteins to establish and maintain anterior-posterior polarity in the early C. elegans embryo. Developmental cell. 2004;7(3):413–24. 10.1016/j.devcel.2004.08.001 - DOI - PubMed
    1. Werner M, Munro E, Glotzer M. Astral signals spatially bias cortical myosin recruitment to break symmetry and promote cytokinesis. Current biology: CB. 2007;17(15):1286–97. 10.1016/j.cub.2007.06.070 - DOI - PMC - PubMed
    1. Schuh M. An actin-dependent mechanism for long-range vesicle transport. Nat Cell Biol. 2011;13(12):1431–6. 10.1038/ncb2353 - DOI - PMC - PubMed
    1. Holubcova Z, Howard G, Schuh M. Vesicles modulate an actin network for asymmetric spindle positioning. Nat Cell Biol. 2013;15(8):937–47. 10.1038/ncb2802 - DOI - PMC - PubMed