. 2016 Oct 18;17(4):1037-1052.
doi: 10.1016/j.celrep.2016.09.069.

ATP-Citrate Lyase Controls a Glucose-to-Acetate Metabolic Switch

Affiliations

ATP-Citrate Lyase Controls a Glucose-to-Acetate Metabolic Switch

Steven Zhao et al. Cell Rep. .

Abstract

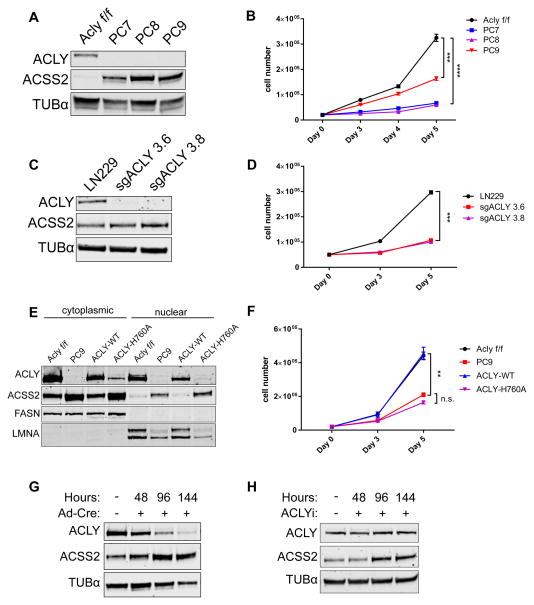
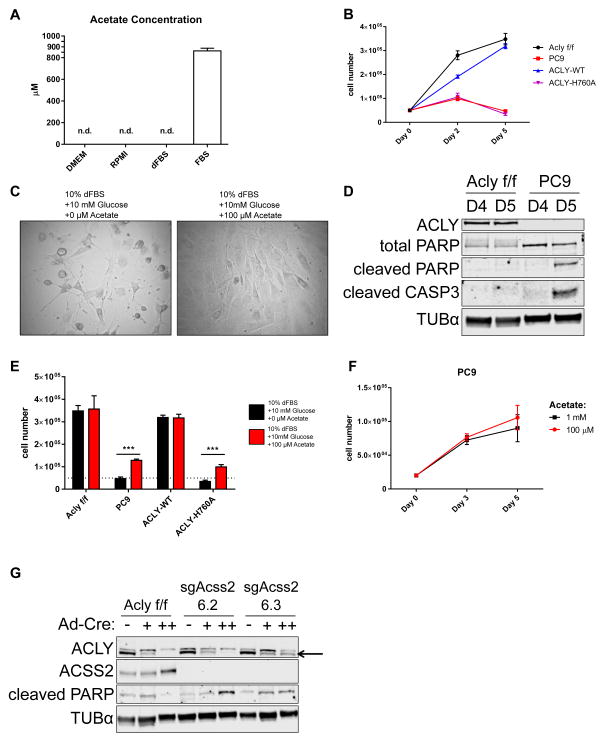
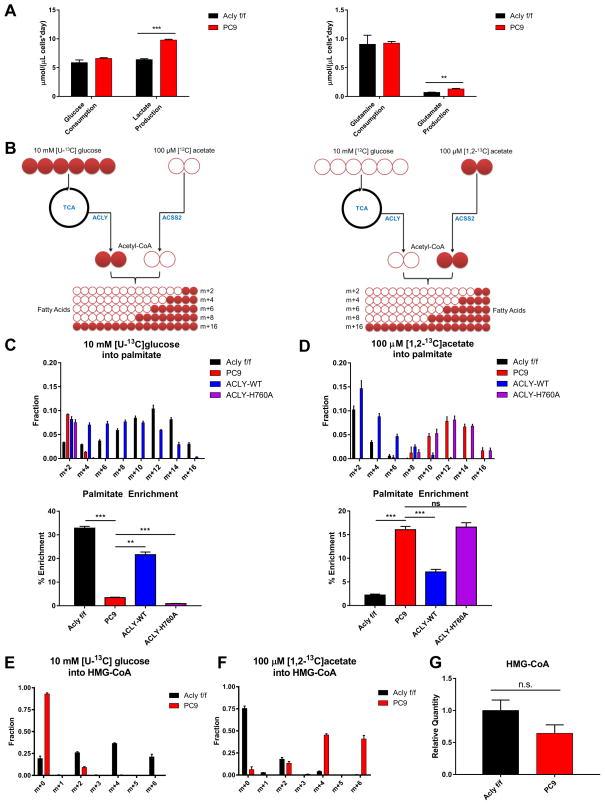
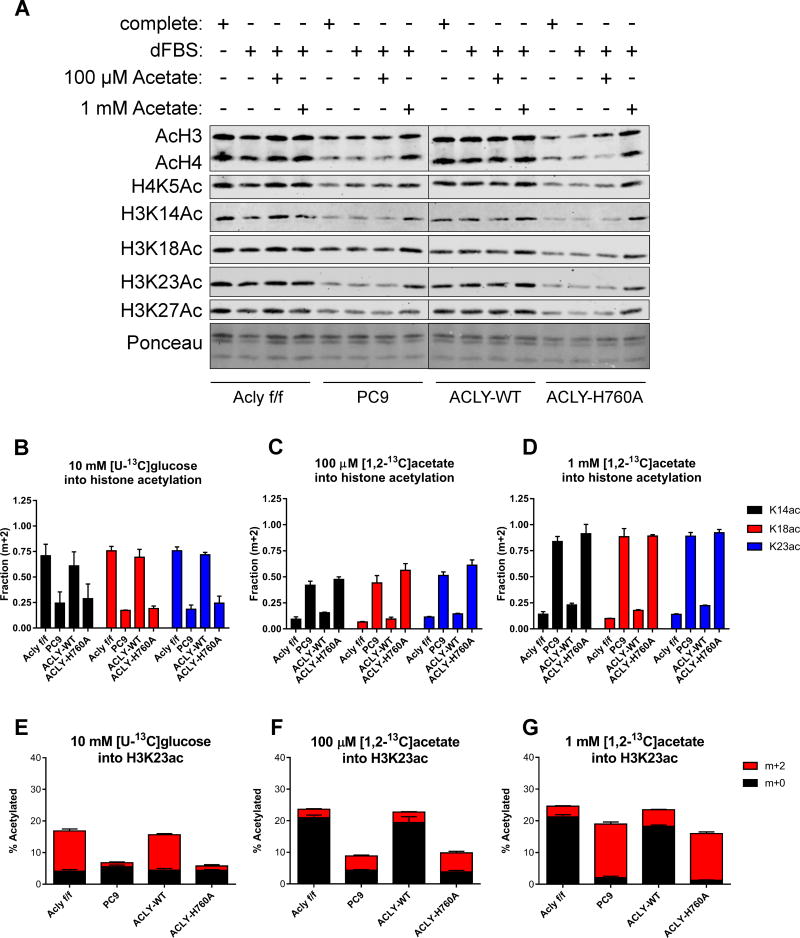
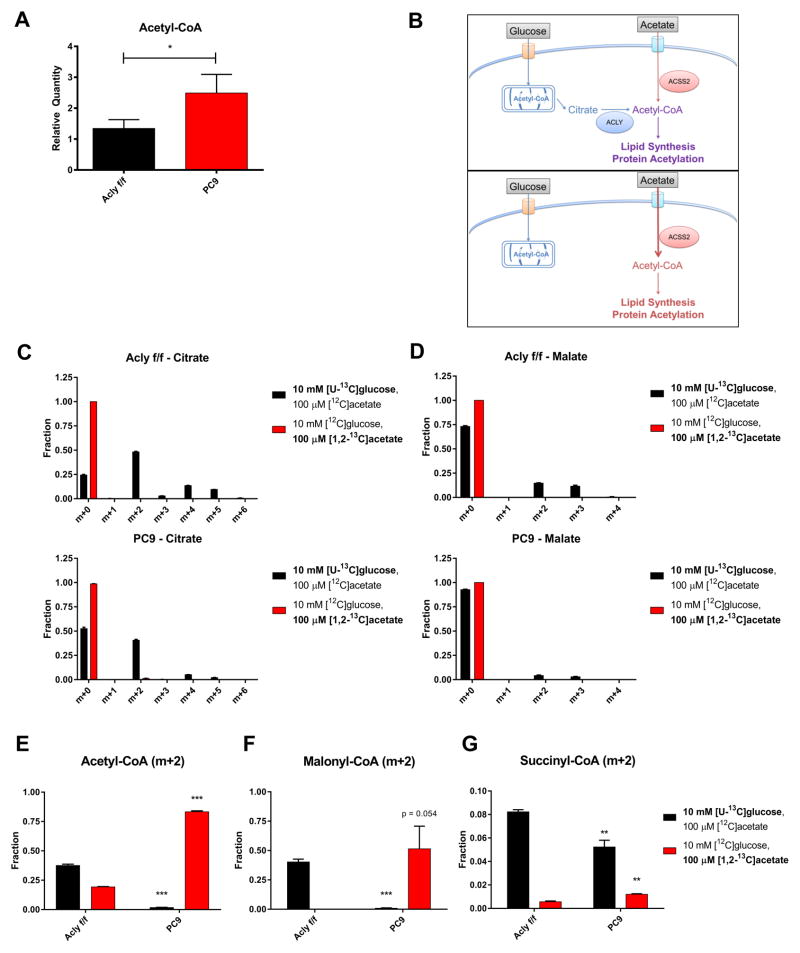
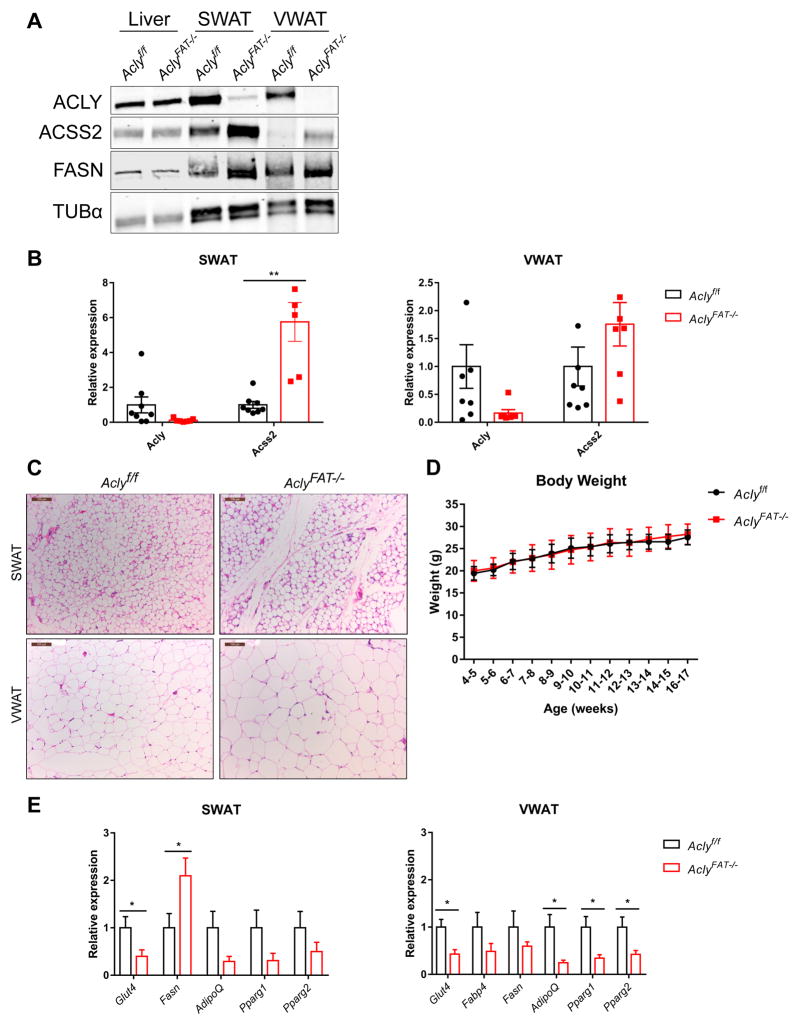
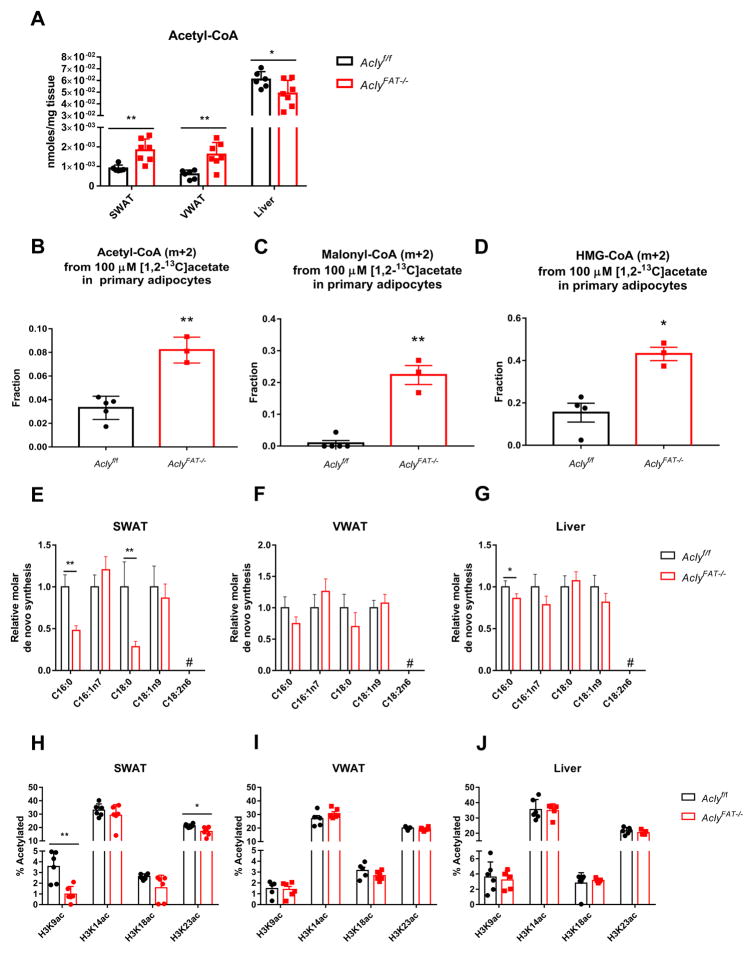
Mechanisms of metabolic flexibility enable cells to survive under stressful conditions and can thwart therapeutic responses. Acetyl-coenzyme A (CoA) plays central roles in energy production, lipid metabolism, and epigenomic modifications. Here, we show that, upon genetic deletion of Acly, the gene coding for ATP-citrate lyase (ACLY), cells remain viable and proliferate, although at an impaired rate. In the absence of ACLY, cells upregulate ACSS2 and utilize exogenous acetate to provide acetyl-CoA for de novo lipogenesis (DNL) and histone acetylation. A physiological level of acetate is sufficient for cell viability and abundant acetyl-CoA production, although histone acetylation levels remain low in ACLY-deficient cells unless supplemented with high levels of acetate. ACLY-deficient adipocytes accumulate lipid in vivo, exhibit increased acetyl-CoA and malonyl-CoA production from acetate, and display some differences in fatty acid content and synthesis. Together, these data indicate that engagement of acetate metabolism is a crucial, although partial, mechanism of compensation for ACLY deficiency.

Keywords: ACLY; ACSS2; acetate; acetyl-CoA; acetylation; adipose tissue; fatty acid synthesis; metabolic flexibility; metabolism.


Conflict of interest statement

Authors have no conflicts of interest to declare.

Figures

Figure 1
Figure 1. Genetic deletion of Acly is consistent with cell viability but impairs proliferation
A) Western blot of 3 clonal ACLY deficient (KO) cell lines (PC7, PC8, and PC9) generated from Aclyf/f MEFs. B) Proliferation curve of Aclyf/f and ACLY-KO MEFs over 5 days, mean +/− SEM of triplicate wells, statistical significance compared to Aclyf/f. C) Western blot verification of ACLY knockout by CRISPR-Cas9 in LN229 glioblastoma cells. D) Proliferation curve of LN229 and two ACLY-knockout clonal cell lines over 5 days, mean +/− SEM of triplicate wells, statistical significance compared to LN229. E) Western blot of nuclear and cytoplasmic fractions of Aclyf/f, PC9, and reconstituted ACLY-WT and ACLY-H760A PC9 cells. FASN and LMNA are cytoplasmic and nuclear markers, respectively. F) Proliferation curve of Aclyf/f MEF and PC9 lines compared to PC9 reconstituted with ACLY-WT or ACLY-H760A over 5 days, mean +/− SEM of triplicate wells, statistical significance compared to PC9. G) Western blot of ACLY and ACSS2 protein levels in Aclyf/f MEFs over 144 hours following administration of Cre recombinase. H) Western blot of ACLY and ACSS2 protein levels in Aclyf/f MEFs over 144 hours with pharmacological inhibition of ACLY (50 μM BMS-303141). For all panels: **, p<0.01; ***, p<0.001; ****, p<0.0001. See also Figure S1.
Figure 2
Figure 2. ACLY-deficient MEFs require exogenous acetate for viability
A) Acetate concentrations in DMEM, RPMI, 100% dialyzed fetal bovine serum (dFBS), and 100% calf serum (CS), mean +/− SEM of triplicate aliquots. See Fig. S2A for spectrum. B) Proliferation curve over 5 days of Aclyf/f, PC9, PC9-ACLY-WT, and PC9-ACLY-H760A cells in acetate-free conditions (DMEM + 10% dFBS + 10 mM glucose), mean +/− SEM of triplicate wells C) Image of ACLY-deficient PC9 cells cultured for 5 days in DMEM + 10% dFBS + 10 mM glucose, without (left), or with (right) 100 μM sodium acetate. D) Western blot of apoptotic markers cleaved PARP and cleaved caspase 3 (CASP3) in Aclyf/f and PC9 cells cultured in acetate-free conditions (DMEM + 10% dFBS + 10 mM glucose) for 4 (D4) or 5 (D5) days. E) Cell numbers following 5 days in culture in DMEM + 10% dFBS + 10 mM glucose alone (black) or supplemented with 100 μM sodium acetate (red) in Aclyf/f, PC9, PC9-ACLY-WT and PC9-ACLY-H760A cells, mean +/− SEM of triplicates, ***, p<0.001. Dotted line represents cell number at plating. F) Proliferation of PC9 cells over 5 days cultured in DMEM + 10% dFBS + 10 mM glucose, with 100 μM or 1 mM sodium acetate, mean +/− SEM of triplicate wells. G) Parental Aclyf/f MEFs and two clones of ACSS2-deficient Aclyf/f MEFs were administered Cre recombinase once (+) or twice (++) and proteins collected for Western blot after 2 days (+) and 2 weeks (++). See Fig. S2D for corresponding images. See also Figure S2.
Figure 3
Figure 3. Acetate supports lipid synthesis in the absence of ACLY
A) Measurements of glucose consumption and lactate production (left) and glutamine consumption and glutamate production (right), normalized to cell volume (cell number X mean cell volume), mean +/− SEM of triplicate wells, **, p<0.01; ***, p<0.001. Experiment was performed in glucose-free DMEM + 10% dFBS + 10 mM glucose + 100 μM sodium acetate. B) Experimental design for heavy isotope labeling of fatty acids using [U-13C]glucose, with unlabeled acetate present (left) and [1,2-13C]acetate, with unlabeled glucose present (right). C) Isotopologue distribution of palmitate after 48 hours labeling in 10 mM [U-13C]glucose in Aclyf/f, PC9, PC9-ACLY-WT, PC9-ACLY-H760A MEFs (top). Expressed as percent enrichment of palmitate (bottom), mean +/− SD of triplicates. D) Isotopologues of palmitate after 48 hours labeling in 100 μM [1,2-13C]acetate in Aclyf/f, PC9, PC9-ACLY-WT, PC9-Acly H760A MEFs (top). Expressed as percent enrichment of palmitate (bottom), mean +/− SD of triplicates. E) Isotopologues of HMG-CoA upon 6 hours labeling in 10 mM [U-13C]glucose (100 μM unlabeled acetate present) in Aclyf/f and PC9 MEFs, mean +/− SEM of triplicates. F) Isotopologues of HMG-CoA upon 6 hours labeling in 100 μM [1,2-13C]acetate (10 mM unlabeled glucose present) in Aclyf/f and PC9 MEFs, mean +/− SEM of triplicates. G) Total HMG-CoA quantitation in cells cultured in DMEM + 10% dFBS + 10 mM glucose + 100 μM sodium acetate (unlabeled), mean +/− SEM of triplicates.
Figure 4
Figure 4. ACLY is required for sustaining histone acetylation levels, despite ACSS2 compensation
A) Western blot of acetylated histones extracted from Aclyf/f, PC9, PC9-ACLY-WT, PC9-ACLY-H760A MEFs cultured in complete (DMEM + 10%CS), dFBS (DMEM + 10%dFBS), +100 μM Acetate (DMEM + 10%dFBS + 100 μM sodium acetate), and +1 mM Acetate (DMEM + 10%dFBS + 1 mM sodium acetate) for 48 hours. B–D) Fraction of histone H3-K14, -K18, and -K23 acetylation (m+2) derived from 10 mM [U-13C]glucose, with unlabeled 100 μM acetate present (B), 100 μM [1,2-13C]acetate, with 10 mM unlabeled glucose present (C), or 1 mM [1,2-13C]acetate with 10 mM unlabeled glucose present (D), mean +/− SEM of triplicate samples. Labeling was for 24 hours (see also Fig. S3B for experimental design). E–G) Overall percentage of H3K23 acetylated in each cell line (y-axis), as well as the relative fraction of this acetylation incorporated from a labeled source (red): 10 mM [U-13C]glucose (E), 100 μM [1,2-13C]acetate (F), 1 mM [1,2-13C]acetate (G) or unlabeled sources (black), mean +/− SEM of triplicate samples. The same dataset is represented in parts B–D and E–G. See Figs. S3C–E for overall percentage data on K14 and K18 acetylation. See also Figures S3 and S4.
Figure 5
Figure 5. Acetyl-CoA pools are sustained by acetate in the absence of ACLY
A) Relative whole-cell acetyl-CoA levels in Aclyf/f and PC9 MEFs cultured in glucose-free DMEM + 10% dFBS + 10 mM glucose + 100 μM sodium acetate for 6 hours, normalized to cellular volume, mean +/− SEM of triplicates. B) Schematic of acetyl-CoA production from glucose and acetate with (top) or without (bottom) ACLY. C) Isotopologue distribution of citrate after 6 hours incubation with 10 mM [U-13C]glucose, with 100 μM unlabeled acetate present (black) or 100 μM [1,2-13C]acetate with 10 mM unlabeled glucose present (red), in Aclyf/f (top) or PC9 (bottom) MEFs, mean +/− SEM of triplicates. D) Isotopologue distribution of malate in the same conditions as panel C. E–G) m+2 acetyl-CoA (E), malonyl-CoA (F), or succinyl-CoA (G) following 6 hours labeling in 10 mM [U-13C]glucose (with 100 μM unlabeled acetate present) or 100 μM [1,2-13C]acetate (with 10 mM unlabeled glucose present), mean +/− SEM of triplicates. For E, F, and G all statistical comparisons are to Aclyf/f. For all panels: *, p<0.05; **, p<0.01; ***, p<0.001. See also Figure S5.
Figure 6
Figure 6. ACSS2 is upregulated in vivo upon deletion of Acly from adipocytes
A) Western blot of liver, SWAT, and VWAT from Aclyf/f and AclyFAT−/− mice. B) mRNA expression of Acly and Acss2 in SWAT (left) and VWAT (right) from Aclyf/f and AclyFAT−/− mice, mean +/− SEM. C) Representative SWAT and VWAT histology from male 16-week-old Aclyf/f and AclyFAT−/− mice, scale bars indicate 100 μm. D) Body weight of male Aclyf/f (n=9) and AclyFAT−/− (n=8) mice, mean +/− SD. E) Expression of adipocyte genes in SWAT (left) and VWAT (right) from Aclyf/f (n=8) and AclyFAT−/− (n=7) mice, mean +/− SEM. For all panels: *, p<0.05; **, p<0.01.
Figure 7
Figure 7. ACLY-deficient adipose tissue exhibits depot-specific alterations in DNL and histone acetylation
A) Acetyl-CoA abundance in SWAT, VWAT, and liver in 11-week-old Aclyf/f (n=6) and AclyFAT−/− (n=7) mice. B–D) Primary mature adipocytes were isolated from 12-16 week old Aclyf/f (n=5) and AclyFAT−/− (n=3) mice and labeled with 100 μM [1,2-13C]acetate (with 5 mM unlabeled glucose present). Acetyl-CoA (B), malonyl-CoA (C), and HMG-CoA (D) enrichment from acetate was analyzed, mean +/− SEM. E–G) Relative quantities of fatty acids synthesized de novo in SWAT (E), VWAT (F), and liver (G) of Aclyf/f (n=6) and AclyFAT−/− (n=8) mice, mean +/− SEM. H–J) Overall histone H3 acetylation levels in 11-week-old SWAT (H), VWAT (I), and liver (J) of Aclyf/f (n=6) and AclyFAT−/− (n=7) mice, mean +/− SEM. For all panels, *, p<0.05; **, p<0.01. See also Figure S6.

References

    1. Ballantyne CM, Davidson MH, Macdougall DE, Bays HE, Dicarlo LA, Rosenberg NL, Margulies J, Newton RS. Efficacy and safety of a novel dual modulator of adenosine triphosphate-citrate lyase and adenosine monophosphate-activated protein kinase in patients with hypercholesterolemia: results of a multicenter, randomized, double-blind, placebo-controlled, parallel-group trial. J Am Coll Cardiol. 2013;62:1154–1162. - PubMed
    1. Balmer ML, Ma EH, Bantug GR, Grahlert J, Pfister S, Glatter T, Jauch A, Dimeloe S, Slack E, Dehio P, et al. Memory CD8(+) T Cells Require Increased Concentrations of Acetate Induced by Stress for Optimal Function. Immunity. 2016;44:1312–1324. - PubMed
    1. Bauer DE, Hatzivassiliou G, Zhao F, Andreadis C, Thompson CB. ATP citrate lyase is an important component of cell growth and transformation. Oncogene. 2005;24:6314–6322. - PubMed
    1. Beigneux AP, Kosinski C, Gavino B, Horton JD, Skarnes WC, Young SG. ATP-citrate lyase deficiency in the mouse. J Biol Chem. 2004;279:9557–9564. - PMC - PubMed
    1. Cai L, Sutter BM, Li B, Tu BP. Acetyl-CoA induces cell growth and proliferation by promoting the acetylation of histones at growth genes. Mol Cell. 2011;42:426–437. - PMC - PubMed

Publication types

MeSH terms